Cosmological Constraints from a Combined Analysis of the Cluster Mass Function and Microwave Background Anisotropies.
Abstract
We present constraints on several cosmological parameters from a combined analysis of the most recent Cosmic Microwave Background anisotropy data and the Sloan Digital Sky Survey cluster mass function. We find that the combination of the two data sets breaks several degeneracies among the parameters and provides the following constraints: , , , , .
1 Introduction
The last few years have seen a spectacular increase in the amount and quality of available cosmological data. The new results on the Cosmic Microwave Background angular power spectrum (Netterfield et al., 2001; Halverson et al., 2001; Lee et al., 2001; Pearson et al., 2002; Scott, et al., 2002; Benoit et al., 2002) have confirmed the theoretical prediction of acoustic oscillations in the primeval plasma and constrained theories of large-scale structure formation (see e.g. Wang, Tegmark & Zaldarriaga, 2001). At the same time, early data from the 2dFGRS (Percival et al., 2001) and the Sloan Digital Sky Survey (York et al., 2000; Stoughton et al., 2002) galaxy redshift surveys have provided an unprecedented view of the large-scale structure of the universe as traced by galaxies.
Combined analysis of these independent CMB and galaxy data sets are placing strong constraints on some of the fundamental cosmological parameters (Bahcall et al., 1999; Efstathiou et al., 2001; Lahav et al., 2002; Melchiorri & Silk, 2002). Together with the high-redshift supernovae results (Perlmutter et al., 1999; Filippenko & Riess, 2000), a concordance model of a flat, low-density Cold Dark Matter cosmology has become the current paradigm.
The goal of these analyses is to determine the precise values of the cosmological parameters of the -CDM model. Due to ’cosmic degeneracy’, the CMB data alone are unable to place tight constraints on several fundamental parameters, such as the r.m.s. amplitude of the mass fluctuations , the Hubble parameter and the optical depth of the universe , even if one restricts the analysis to a flat universe.
In the present Letter we combine the most recent CMB anisotropies data with the constraints obtained from the mass function of clusters of galaxies determined from early commissioning imaging data of the SDSS (Bahcall et al., 2003) to break the degeneracy among the cosmological models, allowing a determination of the best-fit values for individual parameters.
2 Method
2.1 CMB data and analysis
We consider a template of flat, adiabatic, -CDM CMB spectra computed with CMBFAST (Seljak & Zaldarriaga, 1996), sampling the various parameters as follows: the physical density in cold dark matter , in steps of ; the physical density in baryons , in steps of ; and the cosmological constant , in steps of . For each set of these parameters, the scalar spectral index is varied over the relevant inflationary values of , in steps of . The value of the Hubble constant is not an independent parameter, since ; we include a top-hat prior (Freedman et al., 2001). Only models with age Gyrs are considered.
We allow for a reionization of the intergalactic medium by varying the Compton optical depth parameter in the range in steps of . High values of are in disagreement with recent estimates of the redshift of reionization (see e.g. Fan et al., 2001; Gnedin, 2001), which point towards . However, since the mechanism of reionization is still not clear, we allow this parameter to vary freely within the above conservative range. As shown below, the combination of the CMB and CMF data provides an independent constraint on this parameter.
For the CMB data, we use the recent results from the BOOMERanG-98 (Netterfield et al., 2001), DASI (Halverson et al., 2001), MAXIMA-1 (Lee et al., 2001), CBI (Pearson et al., 2002), VSA (Scott, et al., 2002) and Archeops (Benoit et al., 2002) experiments.
The power spectra from these experiments were estimated in , , , , and bins respectively. For the CBI, we use the data from the MOSAIC configuration (Pearson et al., 2002), spanning the range . We also use the COBE data from the RADPACK compilation (Bond, Jaffe & Knox, 2000).
For the Archeops, CBI, DASI, MAXIMA-I and VSA experiments we use the publicly available correlation matrices and window functions. For the BOOMERanG experiment we assign a flat interpolation for the spectrum in each bin , and we approximate the signal inside the bin to be a Gaussian variable. The CMB likelihood for a given theoretical model is defined by where is the Gaussian curvature of the likelihood matrix at the peak.
We consider , , , , and Gaussian distributed calibration errors (in ) for the Archeops, BOOMERanG-98, DASI, MAXIMA-1, VSA, and CBI experiments respectively and we include the beam uncertainties by the analytical marginalization method presented in Bridle, et al. (2001). Finally, we rescale the spectrum by a prefactor , assumed to be a free parameter, in units of .
In order to constrain a parameter we marginalize over the values of the other parameters . This yields the marginalized likelihood distribution
| (1) |
The central values and limits are then found from the 16%, 50% and 84% integrals of .
2.2 Cluster Mass Function Analysis
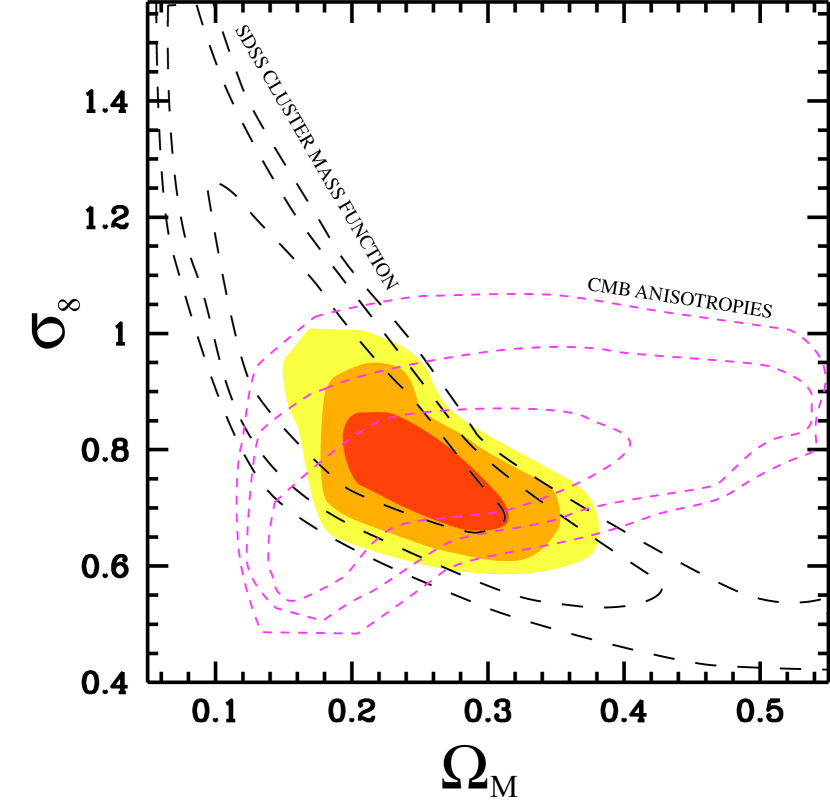
We use the cluster mass function (CMF) obtained from the early SDSS commissioning data (Bahcall et al., 2003). This CMF was derived from 294 clusters in the redshift range z = 0.1 - 0.2 selected by the Hybrid Matched Filter (HMF) method. The HMF mass function was compared with large scale cosmological simulations as well as with model predictions, as discussed in Bahcall et al. (2003). If the Hubble constant and spectral index are kept constant at =0.72 and =1, then the best-fit relation between amplitude and density can be summarized as . The 68, 95, and 99% confidence contours (allowing and to vary as in the previous section) are shown by the dashed curves in Figure 1.
The shape of the cluster mass function only partially breaks the degeneracy between and in the above relation: low values of yield a steeper CMF shape at the high-mass end (i.e., fewer high mass clusters) than do low values (which produce a flatter CMF shape). The cluster mass function prefers a low value for the mass density parameter and a relatively high value for the amplitude : the best-fit parameters for the HMF clusters are =0.18 and =0.92; similar results are obtained for SDSS clusters selected by the the maxBCG method (see Bahcall et al., 2003). The above relation is consistent with recent results from the X-ray cluster temperature function (see Seljak, 2001), and from cosmic shear lensing observations (Ikebe et al., 2002; Reiprich & Bohringer, 2002; Hamana et al., 2002; Jarvis et al., 2002). It also implies that for a mass density of =0.3 the relevant amplitude is = 0.7.
The observed CMB spectrum of fluctuations suggests a lower amplitude value for (which is, however, degenerate with the optical depth parameter for CMB), and a somewhat larger value for the mass density parameter ( for =0.72), than given by the cluster mass function above (see e.g. Lahav et al., 2002; Melchiorri & Silk, 2002, and references therein). However, the CMB and the cluster mass function results are consistent with each other within one sigma. Combining the CMB and CMF data will clearly result in intermediate values for the cosmological parameters, shifting the CMF constraints presented above towards a somewhat lower amplitude and higher mass density regime.
We combine the cluster mass function results with those of the CMB by multiplying the two likelihoods , using the same range of parameters (, , , ) and marginalizing over the nuisance parameters as discussed in the previous section.
3 Results
The main result of our analysis is presented in Figure 1, where we plot likelihood contours in the plane for the two datasets, separately and combined. It can be seen that both the CMB and CMF datasets are affected by degeneracies between and . In the case of the CMF, an increase of results in a larger number of clusters, and must be reduced to bring the predicted CMF back in line with observations. On the other hand, the CMB is only weakly sensitive to the tradeoff between density and amplitude, so models with higher and can be in agreement with CMB data. The degeneracy in the CMB dataset is therefore opposite to the one in the CMF data, and the two measurements complement each other. The combination of the two datasets provides the constraints: and at confidence level, as shown in Figure 1.
The CMB+CMF combination can also break additional degeneracies. The optical depth and the Hubble parameter are better determined after the inclusion of the CMF data. From the combined analysis, we obtain (at C.L.) , and ; these values can be compared with , and from the CMB-only analysis.
4 Conclusions
We combine the Cosmic Microwave Background anisotropy and SDSS cluster mass function data to produce constraints on several cosmological parameters. The complementary nature of the two data sets breaks existing degeneracies among cosmological parameters. The CMB data tend to indicate a higher and a lower amplitude than suggested by the cluster data; thus the combined result for is pulled to a lower value than suggested by the CMB alone, and the amplitude is lower than suggested by the cluster data alone. We find the combined data suggest a mass density ; a normalization of the matter power spectrum ; Hubble parameter ; a nearly scale-invariant spectrum of primordial fluctuations ; and an optical depth of the universe . We have restricted the analysis to flat universes; if this is the case, the density of mass-energy in the universe is dominated by a form other than ordinary matter.
References
- Bahcall et al. (1999) Bahcall, N.A., Ostriker, J.P., Perlmutter, S., & Steinhardt, P. 1999, Science, 284, 1481
- Bahcall et al. (2003) Bahcall, N.A., et al. 2003, ApJ, 585 (March 2003). (astro-ph/0205490)
- Benoit et al. (2002) Benoit, A., et al. 2002, astro-ph/0210305, (2002).
- Bond, Jaffe & Knox (2000) Bond, J.R., Jaffe, A.H., & Knox, L.E. 2000, ApJ, 533, 19
- Bridle, et al. (2001) Bridle, S.L., Crittenden, R., Melchiorri, A., Hobson, M.P., Kneissl, R., & Lasenby, A.N. 2001, astro-ph/0112114
- Efstathiou et al. (2001) Efstathiou, G., et al 2001, astro-ph/0109152
- Fan et al. (2001) Fan, X., Narayanan, V.K., Strauss, M.A., White, R.L., Becker, R.H., Pentericci, L., & Rix, H-W. 2001, AJ, in press, astro-ph/0111184
- Filippenko & Riess (2000) Filippenko, A.V, & Riess, A.C. 2000, in Particle Physics and Cosmology: Second Tropical Workshop, ed J.F. Nieves (New York: AIP), 227
- Freedman et al. (2001) Freedman, W. L., Madore, B. F., Gibson, B. K., et al. 2001,
- Gnedin (2001) Gnedin, N. 2001, astro-ph/0110290
- Halverson et al. (2001) Halverson, N.W., et al. 2001, astro-ph/0104489
- Hamana et al. (2002) Hamana, T., et al. 2002, astro-ph/0210450
- Ikebe et al. (2002) Ikebe, Y., Reiprich, T. H., Bohringer, H., Tanaka, Y. & Kitayama, T. 2002, A&A, 383, 773
- Jarvis et al. (2002) Jarvis, M., et al. 2002, astro-ph/0210604
- Lahav et al. (2002) Lahav, O., Bridle S., et al. 2002, MNRAS, 333, 133.
- Lee et al. (2001) Lee, A.T., et al. 2001, ApJ, 561, L1
- Melchiorri & Silk (2002) Melchiorri A. and Silk J., Phys. Rev. D 66, 041301 (2002) [arXiv:astro-ph/0203200].
- Perlmutter et al. (1999) Perlmutter, S., et al. 1999, ApJ, 517, 565
- Netterfield et al. (2001) Netterfield, C.B., et al. 2001, astro-ph/0104460
- Pearson et al. (2002) Pearson, T.J., et al. 2002, astro-ph/0205388
- Percival et al. (2001) Percival, W., et al. 2001, astro-ph/0105252.
- Reiprich & Bohringer (2002) Reiprich, T. H., & Bohringer, H. 2002, ApJ, 567, 716
- Scott, et al. (2002) Scott, P.F., et al. 2002, astro-ph/0205380
- Seljak (2001) Seljak, U., 2002, astro-ph/0111362
- Seljak & Zaldarriaga (1996) Seljak, U. & Zaldarriaga, M. 1996, ApJ, 469, 437
- Stoughton et al. (2002) Stoughton, C., et al. 2002, AJ, 123, 485
- York et al. (2000) York, D.G., et al. 2000, AJ, 120, 1579
- Wang, Tegmark & Zaldarriaga (2001) Wang, X., Tegmark, M., & Zaldarriaga, M. 2001, astro-ph/0105091