The Position of Sagittarius A*: II. Accurate Positions and Proper Motions of Stellar SiO Masers near the Galactic Center
Abstract
Menten et al. (1997) accurately determined the position of Sgr A* on an infrared image, by aligning the infrared image with positions measured for SiO masers, associated with infrared-bright evolved stars, at radio wavelengths. We now report greatly improved radio positions and, for the first time, proper motions of many stellar SiO masers at the Galactic Center. These positions and motions, coupled with better infrared imaging, allow a much improved location of Sgr A* on infrared images. With current data, infrared stars can be placed in a reference frame tied to Sgr A*, to an accuracy of mas in position and mas y-1 in motion. The position of Sgr A* is, within uncertainties, consistent with stellar accelerations and the measured orbital focus of the star S2. The star S2 was observed within 16 mas ( AU in projection) of Sgr A* on 2002 May 02. Finally, we find that the central stellar cluster moves with Sgr A* to within km s-1.
1 Introduction
Sagittarius A* (Sgr A*) is a compact radio source projected toward the center of the Galaxy (Balick & Brown, 1974). The apparent proper motion of Sgr A*, measured against extragalactic radio sources, is consistent with it being at the dynamical center of the Galaxy (Reid, Readhead, Vermeulen & Treuhaft, 1999; Backer & Sramek, 1999). A dense cluster of stars surrounds Sgr A*, and the relative proper motions of these stars increases dramatically with decreasing projected distance from Sgr A* (Eckart & Genzel, 1996; Ghez, Klein, Morris & Becklin, 1998). These stellar motions exceed km s-1 at a projected distance of pc from Sgr A*. Using the radio–infrared alignment presented in this paper, one star, S2, was found to travel on an elliptical orbit with Sgr A* at its focus (Schödel et al., 2002). This star was moving at km s-1 at a distance of 124 AU at pericenter passage, implying an enclosed mass of M⊙. The very small peculiar motion of km s-1 for Sgr A* is in stark contrast to the high stellar motions and indicates that Sgr A* must contain at least to M⊙ (Reid, Readhead, Vermeulen & Treuhaft, 1999; Chatterjee, Hernquist, & Loeb, 2002); this mass is directly associated with the compact radio source which is AU in size (Bower & Backer, 1998; Krichbaum et al., 1998). Together, all of these findings provide compelling evidence that Sgr A* is a super-massive black hole at the dynamical center of the Galaxy.
While Sgr A* is a very bright radio source, it is a very dim infrared source. Locating Sgr A* on infrared images is complicated by the high projected density of stars at the Galactic Center and by the absence of any obvious infrared counterpart for Sgr A*. Fortunately, the Galactic Center stellar cluster contains red giant stars that are both strong radio sources (from circumstellar SiO maser emission) and bright infrared sources. Because these stars are visible at both radio and infrared wavelengths, one can use their radio positions, measured with respect to Sgr A*, to determine accurate “plate” scales and rotations for infrared images and transfer the position of Sgr A* to these infrared images. In Menten et al. (1997) (hereafter Paper I), we developed this technique and determined the position of Sgr A* on a diffraction-limited 2.2 m image of the Galactic Center region made with the MPE SHARP camera on the ESO 3.5-m New Technology Telescope in Chile. We located Sgr A* with a 95% () confidence of 60 mas and found no infrared emission above a level of 9 mJy (de-reddened) toward its position. This upper limit strongly constrains models for the emission from the immediate vicinity of a super-massive black hole.
Locating Sgr A* on infrared images is important for reasons other than determining its emission. Recently it has become possible to observe gravitational acceleration directly, via orbital curvature in the motions of stars (Ghez et al., 2000; Eckart, Genzel, Ott, & Schödel, 2002). Uncertainty in the position of the dynamical center, presumably Sgr A*, limits estimates of the enclosed mass determined from observed accelerations. Approximately two-thirds of a complete orbit has now been observed for one star, S2 (Schödel et al., 2002), and calculating orbital parameters is enhanced by precise knowledge of the dynamical center. Ultimately, verification that the dynamical center coincides with the position of Sgr A* would link the radiative source, Sgr A*, directly with the gravitational source.
In the five years since Paper I was published, there have been significant advances in both the radio astrometry and infrared imaging of the Galactic Center region, and it was time to update the infrared positioning of Sgr A*. This paper reports VLA and VLBA observations with greatly improved positions and, for the first time, proper motions of stars with circumstellar SiO masers in the Galactic Center region. In addition, deep (K mag), large-field images of the Galactic Center region at infrared wavelengths were obtained with new instrumentation on one of the 8.2-m VLT telescopes. Combining the new radio and infrared observations has yielded a significant improvement in the location of Sgr A* in the infrared, helped verify that the radio source Sgr A* is at the focus of a stellar orbit, and placed the proper motions of stars in the central cluster in a reference frame tied to Sgr A*.
2 Radio Observations
SiO masers in the extended atmospheres of late type giants and supergiants are strongly variable over time scales of y, and care must be taken to minimize the effects of maser variability on proper motion measurements. For a typical Mira variable, SiO maser emission occurs at a radius of about 8 AU, which corresponds to about 1 mas at the 8 kpc distance of the Galactic Center (Reid, 1993). Since individual maser features generally persist over most of a stellar period, but not among different cycles, there are two approaches to dealing with variability. One can observe with high angular resolution, e.g., using VLBI techniques, and make measurements only within one cycle, by tracking individual maser features within the masing shell. Alternatively, one can observe with lower angular resolution, e.g., using connected-element interferometers, and make measurements over a time-span much longer than the stellar cycle. With this approach one does not attempt to track individual maser features and accepts an intrinsic stellar position uncertainty of about 1 mas owing to variations across the maser shell. We employed both techniques.
Over the period 1995 to 2000 we searched for and mapped SiO masers associated with late-type stars that are projected near Sgr A*. We used the NRAO111NRAO is a facility of the National Science Foundation operated under cooperative agreement by Associated Universities, Inc. VLBA and VLA to measure accurately the relative positions of SiO maser stars and Sgr A*. Typically, we obtained positions, accurate to mas, and proper motions, accurate to mas y-1, for a number of maser stars.
2.1 VLBA Observations
The VLBA observations were conducted on four epochs, spaced approximately at monthly intervals, on 1996 April 25, May 12, June 15, and July 13. Strong interstellar scattering toward Sgr A*, our phase-reference source, broadens the apparent image of Sgr A* to about 0.7 mas at 43 GHz (Krichbaum et al., 1998). This limits interferometer baselines that can be effectively used at this observing frequency to km length. We chose to use only the inner 5 antennas of the VLBA (PT, LA, KP, FD, OV), which form interferometer baselines shorter than this length over the entire track on Sgr A*.
We observed with four 8-MHz bands centered on velocities of and km s-1 with respect to the local standard of rest (LSR), assuming a rest-line frequency of 43122.08 MHz for the transition of SiO. The VLBA correlator generated 128 spectral channels, spaced by 62.5 kHz or 0.435 km s-1.
The primary beam pattern of a single VLBA antenna at 43 GHz has a half-width at half-maximum of . Thus, SiO maser stars within about 15′′ of Sgr A* can be observed while pointing at Sgr A* with little degradation. (We were able to detect strong SiO maser stars out to 42′′ with some loss of sensitivity.) We pointed the VLBA antennas at Sgr A* and cross-correlated the data only at the position of Sgr A*. We later shifted the phase center of the interferometer data, using special software, to positions where SiO masers were known from our earlier VLA observations. In order to allow for this, the correlator integration time was limited to 0.4 s, yielding a field-of-view that avoids strong “fringe-rate smearing” with a radius of .
Calibration was performed in the standard manner outlined in the NRAO Astronomical Image Processing System (AIPS) documentation for spectral-line VLBA observations. Amplitude calibration employed on-line measurements of system temperature and standard gain-curves provided by NRAO. Initial delay and electronic phase calibration was accomplished with observations of NRAO 530 at approximately 2-hour intervals. This allowed the four 8-MHz bands to be combined for the Sgr A* observations and interferometer phases to be measured every 10 seconds. Rapid interferometer phase changes are caused predominantly by fluctuations in the water vapor content of the atmosphere along the lines of sight of the antennas. By measuring them on Sgr A*, we could remove their effects from the data.
Calibrated interferometric data for Sgr A* observations were then copied and the interferometer phase-center was re-calculated to allow for the angular offset of an SiO maser star from Sgr A*. This could not be accomplished accurately enough with standard AIPS tasks (eg, CLCOR), and we used a special AIPS task (PHREF) written by A. Beasley. This task calculated the difference of the full interferometer delay and phase for the Sgr A* and the SiO maser position. The data were corrected for these delay and phase differences, effectively yielding a calibrated copy of the data as if it were correlated at the SiO maser position. Such data sets were generated for the SiO masers known at the time of observation that were within about 12′′ of Sgr A*: IRS 9, IRS 7, IRS 12N, IRS 10EE, and IRS 15NE. We also generated such a data set for Sgr A* as a software control.
Spectral-line image cubes were then made using the AIPS task IMAGR with maps of pixels of size of 0.2 mas, yielding a field-of-view of about 100 mas. This was more than sufficient to allow for uncertainties in the maser positions, which came from the 1995 VLA observations and were typically 20 mas. Noise levels in individual channel maps were mJy. We searched these map cubes for SiO maser emission and were able to detect three stars: IRS 12N, IRS 10EE, and IRS 15NE.
Fig. 1 shows spectra and maps of these sources for the first and last epoch of our VLBA observations. The spectra were constructed by summing the emission over a region on the sky, typically about 3 mas, that enclosed all of the maser emission. The maps were obtained by assigning the maximum brightness over the spectral range of the maser emission for each pixel. This method better displays multiple spectral components with different strengths than simply summing the emission. One can clearly see motions of the three stars over the 79 days between the observations. Also, one can see that the SiO emission peaks from IRS 10EE subtend an angle of about 1.8 mas on the sky. Were this star to be at a distance from the Sun of Ceti ( pc), instead of near 8 kpc, the SiO emission would subtend an angle of about 130 mas. This is a bit larger than, but comparable to, the observed diameter of the SiO emission from Ceti of about 90 mas (Reid & Menten, 2002). Thus, IRS 10EE, and IRS 12N and IRS 15NE which have more compact SiO emission, appear to be Mira-like variable stars.

While one could obtain a crude estimate of the proper motions of the SiO maser stars by analyzing Fig. 1, we did the following to obtain optimum estimates of the position and motion for each star:
-
1) We fit a 2-dimensional Gaussian brightness distribution to each spectral channel with detectable SiO emission.
-
2) On a channel by channel basis, we fit a straight line to the east-west and north-south positions as a function of time.
-
3) The channel motions were then averaged, using both variance and uniform weighting. We adopted the mean of the two methods.
-
4) Proper motion uncertainties were estimated by taking larger of the two formal errors (i.e., from the uniform-weighted solutions), and these were increased by in order to account roughly for the effects of blending of maser spots.
-
5) The formal uncertainties for the mean positions were quite small, since we averaged positions of many spectral channels. However, the measured SiO shell size appears to be up to 1 mas in radius, and we adopt a position uncertainty of 0.5 mas at the reference epoch.
The proper motion solutions for the three stars detected with the VLBA are listed in Table 1.
| Star | Epoch | |||||
|---|---|---|---|---|---|---|
| ( km s-1) | (arcsec) | (arcsec) | (mas y-1) | (mas y-1) | (y) | |
| IRS 12N …. | 1996.41 | |||||
| IRS 10EE … | 1996.41 | |||||
| IRS 15NE … | 1996.41 |
Note. — VLBI position uncertainties reflect the mas SiO maser shell radius. and are angular offsets, and and are proper motions, relative to Sgr A* toward the east and north, respectively, in the J2000 coordinate system.
2.2 VLA Observations
The VLA observations were conducted in the A-configuration in 1998 May and 2000 October/November. Near the Galactic Center, SiO masers are likely detectable over a very wide range of velocities, probably exceeding 700 km s-1. However, wide-band observations at the VLA are currently limited by the correlator and, in order to obtain adequate spectral resolution, we chose to observe in 6.25 MHz bandwidths (each covering 42 km s-1). With 64 spectral channels per band, this resulted in a spectral resolution of about 98 kHz or 0.67 km s-1.
In 1998, the VLA had 12 antennas operating with 43 GHz receivers. These antennas were sited so as to cover, somewhat sparsely, the entire range of A-configuration spacings, and the synthesized full-width at half-power beamwidth toward Sgr A* was about mas elongated in the north-south direction. We observed with two different equipment setups on different days. On May 20 and 25, we covered a wide velocity range ( km s-1), searching for new SiO maser stars. We used twelve frequency settings, each with two 6.25 MHz bands, and observed in one polarization, for a total of about 25 minutes per setting. Typical noise levels in a single spectral channel were 15 mJy. On May 27 and 31, we concentrated on four 6.25 MHz bands centered at km s-1, which included five SiO maser stars known at that time. By restricting the velocity range, we were able to observe longer and in a dual-circularly polarized configuration in order to increase sensitivity and, thus, positional accuracy for these stars. Although the weather conditions were somewhat worse on these days, typical noise levels in a single spectral channel were about 10 mJy.
In 2000, observations were conducted on Oct. 28 & 30 and Nov. 13 & 16. The VLA had all 27 antennas operating with 43 GHz receivers, and the synthesized beam toward Sgr A* was about mas elongated in the north-south direction. We observed by cycling among seven 6.25 MHz bands centered at LSR velocities of and km s-1; the latter six bands covered the LSR velocity range km s-1 with only two small gaps. This setup allowed the deepest integrations possible for the nine known, or suspected, SiO maser stars at that time. We observed in both right and left circular polarization for each band and obtained 64 spectral channels per band as for the 1998 observations. The synthesized maps typically had single spectral channel noise levels of about 5 mJy.
Initial calibration of all VLA data was done in a standard manner recommended by the AIPS documentation. The flux density scale was based on observations of 3C 286, assumed to be 1.49 Jy for interferometer baselines shorter than 300 k. Bandpass calibration was accomplished with observations of NRAO 530, which had a flux density of 3.6 Jy during the 1998 observations and 3.3 Jy during the 2000 observations. The data were then self-calibrated (amplitude and phase) on Sgr A*.
When searching for masers with the 1998 data, we made very large images, covering about 80′′, or most of the primary beam of an individual VLA antenna at 43 GHz. Three new SiO maser stars were discovered within 15′′ of Sgr A*. We searched for masers with the 2000 data within a more restricted 40′′ region centered on Sgr A*. Typical rms noise levels in these images were 5 mJy, allowing detections of 30 mJy. One new SiO maser star, offset from Sgr A* by (E,N), was discovered. Including the three SiO masers in Paper I, these discoveries brought the number of detected SiO maser stars within 15′′ of Sgr A* to seven.
Once the approximate location of a maser was known, either from previous observations or from the large images, we mapped each band with up to four small sub-images centered on the known masers with emission in that band. We always included a sub-image for Sgr A* at the phase center of the interferometric data. By simultaneously imaging the stellar SiO masers and the continuum emission from Sgr A*, the strong continuum emission from Sgr A* did not degrade the detections of relatively weak SiO masers far from Sgr A*.
We obtained a single position for each star at each observing epoch in the following manner:
-
1) We fit a 2-dimensional Gaussian brightness distribution to each spectral channel with detectable SiO emission.
-
2) The fitted positions from each observing season were then averaged, using variance weighting, to obtain a best stellar position and estimated uncertainty.
-
3) Since the correlator model for the VLA neglects terms for annual aberration (Fomalont et al., 1992), we calculated the effect this had on the relative position of a star and Sgr A*, and corrected the stellar positions. For stars within about 15 ′′ of Sgr A*, these corrections were less mas.
We list the positions of the SiO maser stars, relative to Sgr A*, in Table 2. In addition to the 1998 and 2000 VLA observations reported here, this table includes the 1995 VLA observations reported in Paper I and a single position for the 1996 VLBA observations (see §2.1) determined for an epoch near the center of those observations. Since stellar SiO masers are variable in strength over the period of the stellar pulsation ( y) and the sensitivity of each epoch’s data differed somewhat, only the strongest masers were detected at all epochs.
| Star | Epoch | Telescope | |||
|---|---|---|---|---|---|
| ( km s-1) | (arcsec) | (arcsec) | (y) | ||
| IRS 9 ….. | 1998.39 | VLA | |||
| 1998.41 | VLA | ||||
| 2000.85 | VLA | ||||
| IRS 7 ….. | 1995.49 | VLA | |||
| 1998.39 | VLA | ||||
| 1998.41 | VLA | ||||
| 2000.85 | VLA | ||||
| IRS 12N …. | 1996.41 | VLBA | |||
| 1998.39 | VLA | ||||
| 1998.41 | VLA | ||||
| 2000.85 | VLA | ||||
| IRS 28 ….. | 1998.41 | VLA | |||
| 2000.85 | VLA | ||||
| IRS 10EE … | 1995.49 | VLA | |||
| 1996.41 | VLBA | ||||
| 1998.39 | VLA | ||||
| 1998.41 | VLA | ||||
| 2000.85 | VLA | ||||
| IRS 15NE … | 1995.49 | VLA | |||
| 1996.41 | VLBA | ||||
| 1998.39 | VLA | ||||
| 1998.41 | VLA | ||||
| 2000.85 | VLA | ||||
| SiO–6 ….. | 1995.49 | VLA | |||
| 1998.39 | VLA | ||||
| 2000.85 | VLA | ||||
| SiO–11 …. | 1995.49 | VLA | |||
| 1998.39 | VLA | ||||
| 2000.85 | VLA | ||||
| IRS 17 ….. | 2000.85 | VLA | |||
| SiO–12 …. | 1995.49 | VLA | |||
| 2000.85 | VLA |
Note. — VLBA positions are reported at a single reference epoch. VLA data have been corrected for missing annual aberration terms. and are angular offsets, and and are proper motions, relative to Sgr A* toward the east and north, respectively, in the J2000 coordinate system.
We constructed spectra at the pixel of peak brightness for SiO masers detected in the 1998 and 2000 VLA observations. These spectra are displayed in Fig. 2. Most of these SiO spectra are close to those expected from Mira variables located at the distance of the the Galactic Center. They show emission covering a velocity range of km s-1 and strong variability over timescales of years.
The most unusual SiO maser source in the Galactic Center region is IRS 7. It has a supergiant luminosity and SiO maser features spread over km s-1. The peak strength of the maser emission from IRS 7 seems to have decreased since our first detection at 1995.49 of 0.4 Jy (see Paper I) to 0.1 Jy at 1998.40 and 0.05 Jy at 2000.85. Also, the velocity of the peak maser feature changed significantly from about km s-1 at 1995.49 and 1998.40 to about km s-1 at 2000.85. If IRS 7 is similar to the nearby supergiant star VY CMa, it may have an SiO maser shell that is much larger than typical Miras. VY CMa has SiO masers spread over about 100 mas, with the strongest features contained within a region of about 50 mas (Reid & Menten, in preparation, ). Since VY CMa is at a distance of about 1.5 kpc (Lada & Reid, 1978), were it at the distance of the Galactic Center (8 kpc), the strongest maser features would span about 10 mas on the sky. Thus, the positions determined from a single SiO maser feature in IRS 7 may not indicate the stellar position to better than about 5 mas.

2.3 Combined VLA & VLBA SiO Maser Proper Motions
We determined stellar proper motions by fitting a straight line to the positions as a function of time from all of the available data compiled in Table 2. These proper motion fits are given in Table 3, and those from more than two epochs are displayed graphically in Fig. 3. The reference epoch for the proper motion solution was chosen as the variance-weighted mean epoch for each star, in order to obtain uncorrelated position and motion estimates. However, since the estimated uncertainties for individual east-west and north-south positions were neither identical, nor exactly linearly related, we chose a single, average reference epoch for each star (instead of a separate reference epoch for the east-west and north-south directions), which resulted in slight parameter correlations.
It is interesting to compare the three stars with proper motion estimates from both the VLBA observations (spanning 79 d) and the combined VLA/VLBA positions (spanning 5 years). These motion estimates are essentially independent, since they use different telescopes arrays, angular resolutions, interferometer correlators, and correlator models. The inclusion of the single VLBA position with the VLA positions does not correlate the two motion estimates and provides a valuable cross-check on the relative position measurements of the two telescope arrays. Note that there is no indication of a relative position offset between the VLA and the VLBA measurements. The east-west and north-south motions (in Tables 1 & 3) for IRS 12N, IRS 10EE, and IRS 15NE differ typically by about their joint uncertainties. Only one component motion difference is greater than : mas y-1 for the east-west motion difference of IRS 10EE, which is not unreasonably large.
Assuming a distance of 8.0 kpc to the Galactic Center, the proper motions can be converted from angular to linear velocities. Since the line-of-sight velocity component is also known to within about 5 km s-1 for each star from its SiO maser (LSR) velocity, we can also calculate the full 3-dimensional speed, , of these stars, which are given in Table 4. The estimated 3-dimensional speeds assume that Sgr A* has a zero velocity with respect to the LSR. Since no spectral lines have been detected from Sgr A*, there is no direct evidence supporting this assumption. However, strong indirect evidence comes from upper limits to the intrinsic proper motion of Sgr A* itself, with respect to extragalactic sources (Reid, Readhead, Vermeulen & Treuhaft, 1999; Backer & Sramek, 1999). After removing the best estimates of the effects of the Sun’s orbit (i.e., the motion of the LSR and the peculiar motion of the Sun) from the apparent proper motion of Sgr A*, Sgr A* appears stationary at the Galactic Center to within about 20 km s-1 (Reid, Readhead, Vermeulen & Treuhaft, 1999). Thus, Sgr A* seems to be at rest at the dynamical center of the Galaxy, and it is highly unlikely that Sgr A* has a significant non-zero LSR velocity. Thus, the 3-dimensional speeds of the nine SiO maser stars in Table 4 are almost surely properly referenced to Sgr A*.

| Star | Epoch | Number | |||||
|---|---|---|---|---|---|---|---|
| ( km s-1) | (arcsec) | (arcsec) | (mas y-1) | (mas y-1) | (y) | Epochs | |
| IRS 9 | 1999.24 | 2 | |||||
| IRS 7 ….. | 1999.55 | 3 | |||||
| IRS 12N …. | 1997.77 | 3 | |||||
| IRS 28 ….. | 2000.44 | 2 | |||||
| IRS 10EE … | 1998.52 | 4 | |||||
| IRS 15NE … | 1997.54 | 4 | |||||
| SiO–6 ….. | 2000.73 | 3 | |||||
| SiO–11 …. | 2000.51 | 3 | |||||
| IRS 17 ….. | … | … | 2000.85 | 1 | |||
| SiO–12 …. | 2000.77 | 2 |
Note. — For sources with VLBA detections, only a single position was used when fitting for proper motions. VLA data have been corrected for missing annual aberration terms in the correlator model (Fomalont et al., 1992). and are angular offsets, and and are proper motions, relative to Sgr A* toward the east and north, respectively, in the J2000 coordinate system.
| Star | Rproj | Mencl | |||||||
|---|---|---|---|---|---|---|---|---|---|
| ( km s-1) | ( km s-1) | ( km s-1) | ( km s-1) | ( km s-1) | (pc) | (M⊙) | |||
| IRS 9 …… | 0.33 | ||||||||
| IRS 7 ….. | 0.22 | ||||||||
| IRS 12N …. | 0.30 | ||||||||
| IRS 28 ….. | 0.47 | ||||||||
| IRS 10EE … | 0.34 | ||||||||
| IRS 15NE … | 0.44 | ||||||||
| SiO–6 ….. | 1.82 | ||||||||
| SiO–11 …. | 1.57 | ||||||||
| SiO–12 …. | 1.81 |
Note. — and are proper motions speeds toward the East and North, respectively. is the total speed of the stars relative to Sgr A*. is the minimum total speed, calculated by subtracting for each velocity component, before calculating the speed. Proper motions, projected distances, total velocities and enclosed mass limits assume a distance to the Galactic Center of 8.0 kpc.
3 Infrared Observations
Infrared images at Ks-band (2.18m wavelength) were obtained on 2002 April 02 and May 02 on the UT4 (Yepun) 8.2-m telescope of the European Southern Observatories’ VLT in Chile. The CONICA/NAOS adaptive optics assisted imager yielded stellar images with up to 50% of the flux density contained within a full-width at half-maximum diffraction-limited core of mas. This large-format camera produced images with an instantaneous field of view of about a ′′ with 27 mas pixel size. Even though weather conditions were not optimum and integration times were limited, we achieved a limiting magnitude near K mag ().
The April 02 data came from a very short integration and the bright red-giant stars used for the radio–infrared alignment were not saturated on the shift-and-add image. However, this image was not well suited to detect the weak stars within a few-tenths of an arcsec of Sgr A*. The May 02 image is shown in Fig. 4. This image used longer integration times and went much deeper than the April 02 image, and the weak stars near Sgr A*, such as the fast moving stars S1 and S2, are easily detected (see Fig. 5). The bright red-giants, with SiO maser emission, were somewhat saturated on this image. However, this only slightly degraded the positions determined for these stars and did not markedly affect the radio–infrared alignment.
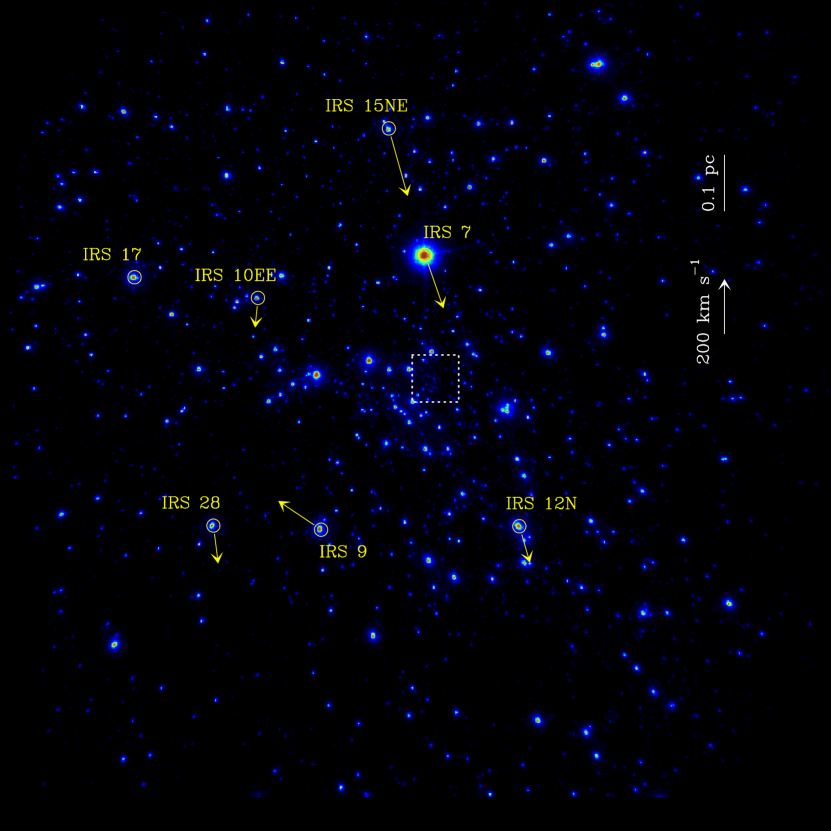
All seven red giant stars with SiO maser emission, listed in Table 3, located within the CONICA images were easily detected on both the April 02 and May 02 images. These stars are identified in Fig. 4. In order to determine the positions of the SiO maser stars on the infrared images, we fit an elliptical Gaussian brightness distribution to the diffraction-limited cores of the shift-and-add stellar images. For the April 02 and May 02 images, % and %, respectively, of the flux density of the star was contained in these cores. Residuals to the fits indicated that the cores of the stellar images were somewhat more peaked than a Gaussian function, but they showed no asymmetries. Thus, the Gaussian fits should not give biased results for the stellar positions.
Formal uncertainties in the fitted positions of these bright stars were less than 0.5 mas. However, given the non-Gaussian brightness distributions of the saturated stellar images and the possibility of anisoplanatic effects across the image, one would expect that the true position uncertainties would exceed the formal values. An upper limit on the combined effects of non-Gaussian distributions, anisoplanatic effects, and other distortions can be obtained by comparing the infrared to the more precise radio positions. As discussed in §4.1, the rms deviation of the May 02 infrared positions, after alignment with the radio positions, was about 5 mas. Since the alignment procedure involved 14 coordinate positions (for seven stars) and five free parameters, the intrinsic position uncertainty is likely to be 6 mas. Thus, we conclude that distortions of the infrared image typically are mas, and that this value serves as a realistic estimate of the infrared position uncertainties.
4 Radio & Infrared Frame Alignments
We have measured radio positions and proper motions, relative to Sgr A*, for seven bright stars within 15′′ of Sgr A*. The position and proper motion accuracies currently are mas and mas y-1, respectively. This allows us to align the radio and infrared frames, both in position and in proper motion. Thus, not only can the location of Sgr A* can be accurately determined on infrared images, but also stellar proper motions from infrared data can be referenced directly to Sgr A*, without assumptions of isotropy or homogeneity of the stellar motions.
4.1 Position Alignment for 2002 Images
The infrared position fits (in pixel units) were compared to the radio positions (J2000 east and north offsets from Sgr A*), corrected for proper motions to the epoch of the infrared observations. Five parameters were used to transform the infrared positions to best match the radio positions: two infrared image scales (in the east and north directions), an image rotation, and a final east and north translation. These parameters were adjusted so as to minimize the difference between the radio and transformed infrared positions in a least-squares sense. A uniform joint-uncertainty of 6 mas was assigned to the difference between the infrared and radio positions in each coordinate; this resulted in a post-fit per degree of freedom near unity.
The least-squares fits for both infrared images produced excellent results. Infrared image scales were measured with formal uncertainties of 0.05% and the east-west and north-south scales differed by less than 0.2%. Infrared image rotations were measured with formal uncertainties of 0.015 degrees. The translation parameters, which ultimately align the infrared image with the radio positions, had formal uncertainties of 6 and 8 mas for the April 02 and May 02 images, respectively. These translation uncertainties are a direct indication of the formal accuracy of the radio–infrared alignment.
| Star | |||||||||
|---|---|---|---|---|---|---|---|---|---|
| ( km s-1) | (arcsec) | (arcsec) | (arcsec) | (arcsec) | (arcsec) | (arcsec) | |||
| IRS 9 ….. | |||||||||
| IRS 7 ….. | |||||||||
| IRS 12N …. | |||||||||
| IRS 28 ….. | 10.4767 | ||||||||
| IRS 10EE … | |||||||||
| IRS 15NE … | |||||||||
| IRS 17 … |
Note. — Radio positions are corrected for proper motions to 2002 May 02. and are angular offsets from Sgr A* toward the east and north, respectively, in the J2000 system. Differenced positions (radio minus infrared) are indicated with the superscript “Dif”.
Table 5 summarizes the radio and transformed infrared positions for the May 02 image. The differences between the radio and infrared positions of the seven stars listed in Table 5 have a root-sum-square deviation of only 5 mas. The largest difference is 11 mas for the notherly position offset of IRS 7. As discussed in §2.2, this star is the lone supergiant in our sample, and it is likely to have an SiO maser shell size of mas. This alone could cause the position of IRS 7, which was measured from the peak brightness of a single SiO emission feature, to be in error by mas. Also, IRS 7 is the brightest infrared source in the field and thus was heavily saturated on the deep image needed to detect weak emission near Sgr A*. Thus, it is not surprising that the biggest difference between the radio and infrared positions should be for IRS 7.
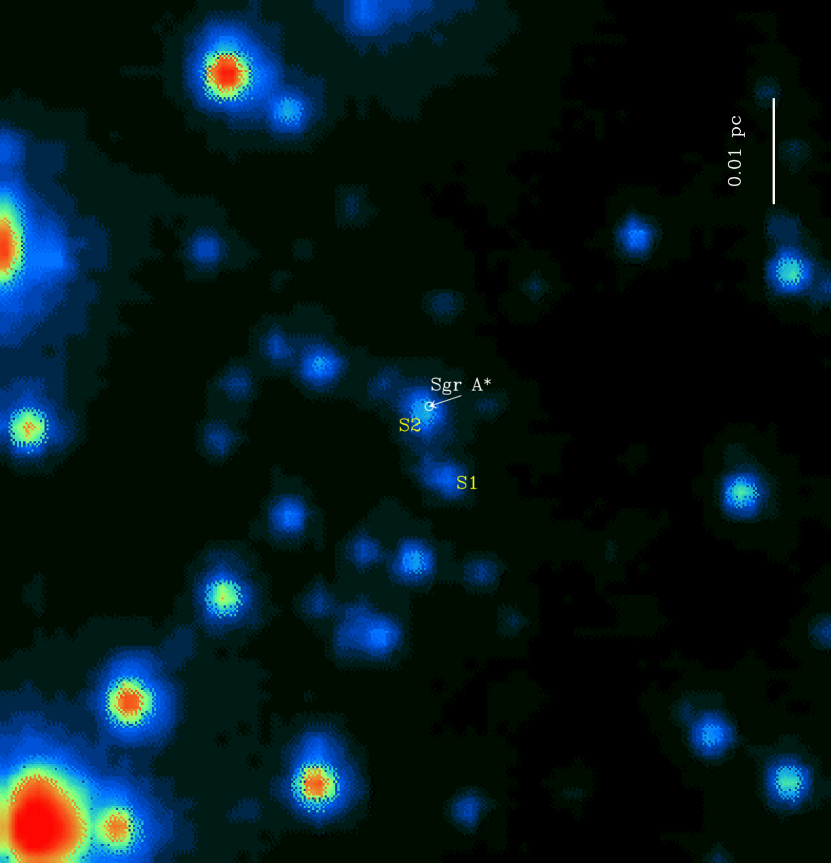
The position of Sgr A* on the 2002 May 02 image is indicated on Fig. 5, which is an expanded section of Fig. 4 showing the inner 2′′ of the Galactic Center. Based primarily on the small differences between the radio and fitted infrared positions, we estimate that the Sgr A* infrared position has a uncertainty of mas. Note that the well studied star S2 moved within about 16 mas of the position of Sgr A* on this date (Schödel et al., 2002). Thus, the emission detected near the Sgr A* position is not that of Sgr A* itself (see §5 for further discussion).
Our new position for Sgr A*, determined from the radio/infrared alignment, can be compared to the position of the central mass responsible for the accelerations of stars. Stellar accelerations measured by Ghez et al. (2000) and Eckart, Genzel, Ott, & Schödel (2002), place Sgr A* about mas east and mas south of the position determined by Menten et al. (1997). As discussed in §4.2, our improved infrared position for Sgr A* resulted in a shift of approximately 50 mas east and 0 mas south, placing it well within the uncertainty of the position estimate for the gravitational mass. Finally, the stellar orbit determined for star S2 by Schödel et al. (2002) also locates the gravitational mass to within about 10 mas of the radio/infrared position.
4.2 Position Alignment for 1995 Images
The radio–infrared alignment procedure of Paper I relied primarily on two maser sources, IRS 7 and IRS 10EE, because of the small field of view of the SHARP camera ( in comparison to for CONICA). (A third maser source, IRS 15NE, appeared in a mosaiced image and was only used as a control to help evaluate accuracy.) Owing to this limitation, only four parameters (a single pixel scale, a plate rotation, and a translation) could be solved for and second order distortions could not be easily evaluated. Among the last ten years of SHARP imaging data, a small number of (un-mosaiced) images can be found that cover a section 10′′ north and 5′′ east of the IRS 16 cluster. These images contain three maser sources, IRS 7, IRS 10EE and IRS 15NE, and thus allow a check on the influence of second-order image distortions. We found deviations of the pixel scale and rotation angle across the SHARP field of view can account for positioning errors which sometimes exceed 30 mas. The 1995 July data used in Paper I had larger than average distortions.
In order to account for second-order distortions in the SHARP images, the following procedure was used:
-
1) A reference image is chosen and the “reference” positions of all stars are measured. We chose a 2002 CONICA image since it has very small distortions and a wide field of view.
-
2) For any given epoch, preliminary positions are measured for all stars on the (distorted) image.
-
3) A model position for each star, , is generated from the reference positions, , and parameterized image transformation equations, which account for plate scale, rotation, distortion (to second order) and translation (Eckart & Genzel, 1997). The transformation equations are as follows:
The parameters, and , are adjusted to minimize the differences between the preliminary and model positions in a least-squares sense. Since the number of parameters for a given image is much smaller than the number of stars, this can work very well.
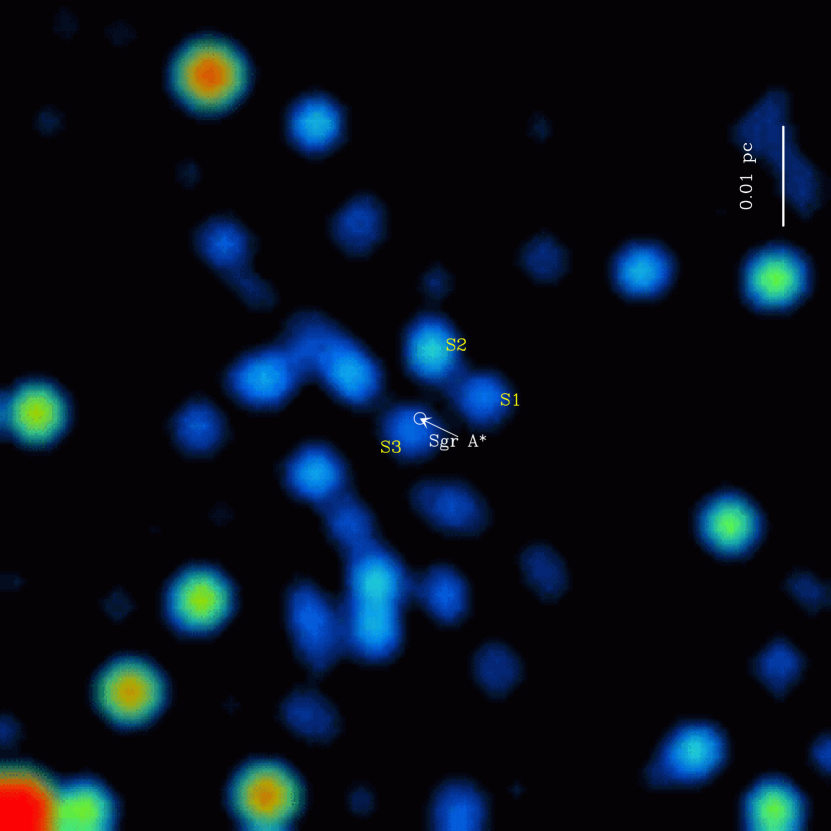
After correcting SHARP data for second-order distortions, a new alignment of the radio and the infrared reference frames results in a position for Sgr A* on the 1995 July SHARP image that is about 50 mas east of the location determined in Paper I. This position still lies within the error circle of 60 mas estimated in Paper I. Only a small fraction of this change is the result of improved radio positions. Most of this change comes from correcting for second-order distortions across the SHARP image. We estimate that the uncertainty in the location of Sgr A* is 15 mas for this image. Note that the position of source S3 now appears offset from that of Sgr A*.
Ghez et al. (2000) and Eckart, Genzel, Ott, & Schödel (2002) used acceleration measurements of stars close to Sgr A* in order to locate the massive black hole candidate. Both groups found an offset of mas to the east of the nominal radio position of Paper I. With the new alignment of the radio and IR frames, there is now good agreement between the radio–infrared position of Sgr A* and its position inferred from stellar accelerations.
4.3 Proper Motion Reference Frame
The proper motions of stars in the Galactic Center cluster, measured from infrared images, are relative motions only. One can add an arbitrary constant vector to all of the stellar proper motions without violating observational constraints. Until now, the “zero points” of the motions have been determined by assuming isotropy and removing the average motion of the entire sample. Since the radio proper motions are inherently in a reference frame tied directly to Sgr A*, one can use any one of the SiO stars, or the mean motion of a group of them, to place the infrared proper motions in Sgr A*’s frame.
Radio and infrared proper motions have been measured for the four stars located within a projected distance of 10′′ on the sky of Sgr A*: IRS 9, IRS 7, IRS 12N, and IRS 10EE. These motions are listed in Table 6, along with the differences of the radio and infrared motions. The four stars have unweighted mean differences (and standard error of the means) of mas y-1 toward the east, and mas y-1 toward the north. One star, IRS 12N, has a significant discrepancy between the radio and infrared motions in the both coordinates. Possibly the infrared motion of this star suffers from blending of multiple stars (within the VLT resolution). If this source is removed, the unweighted mean differences become mas y-1 toward the east, and mas y-1 toward the north. Using the results from either four or three stars, the infrared motions, corrected to zero mean motions, are consistent with being in a reference frame tied to Sgr A*, within uncertainties of mas y-1 or km s-1. We conclude that, on average, the stars in the Galactic Center cluster have no net motion with respect to Sgr A* at the km s-1 level per coordinate axis or km s-1 for a 3-dimensional speed.
| Star | ||||||||
|---|---|---|---|---|---|---|---|---|
| (mas y-1) | (mas y-1) | (mas y-1) | (mas y-1) | (mas y-1) | (mas y-1) | |||
| IRS 9 ….. | ||||||||
| IRS 7 ….. | ||||||||
| IRS 12N …. | ||||||||
| IRS 10EE … |
Note. — and are proper motions relative to Sgr A* toward the east and north, respectively. Differenced motions (radio minus infrared) are indicated with the superscript “Dif”. Radio motions are in a reference frame tied to Sgr A*; infrared motions are relative motions, with the average removed. The un-weighted mean motion difference is mas y-1 toward the east, and mas y-1 toward the north.
5 Infrared Emission of Sgr A*
As mentioned in §4.1, the well-studied star S2 moved within 16 mas of Sgr A* near pericenter passage early in 2002 (Schödel et al., 2002). While S2 was just beginning to move away from Sgr A* by 2002 May 02, when the CONICA image shown in Fig. 5 was taken, it was still well within the diffraction-limited beam of the VLT telescope. Thus, even though Sgr A*’s position is known to 10 mas accuracy at this time, one cannot use this data to determine the infrared emission of Sgr A*. Later in 2002, or more likely in 2003, when S2 has moved sufficiently far away from Sgr A*, it should be possible to do this. Currently the best limit for steady infrared emission from Sgr A* is 2 mJy (Hornstein et al., 2002).
6 Enclosed Mass versus Radius from Sgr A*
Previous estimates of the enclosed mass versus projected radius from Sgr A*, based on infrared stellar motions, rely on relative motions not tied directly to Sgr A*. Since, the proper motions of the SiO masers in this paper are directly tied to Sgr A*, they provide a valuable check on the enclosed mass within a projected radius of 0.2 to 2 pc of Sgr A*.
We now estimate a lower limit to the enclosed mass at the projected radius of each star, assuming the stellar motions reflect gravitational orbits dominated by a central point mass. Given the 3-dimensional speed, , and projected distance from Sgr A*, , for each star, one can determine a strict lower limit to the mass enclosed, , within the true radius, , of that star from Sgr A*. For a given mass and semi-major axis, the greatest orbital speed occurs at pericenter and is given by the well known equation
where is the gravitational constant, is the orbital semi-major axis, and is the orbital eccentricity. The pericenter distance is given by and, for any orbit, the projected pericenter distance cannot exceed the true distance: . Finally, since , Eq. (1) yields
This inequality is maintained by setting , and Eq. (2) yields a strict lower limit to the central mass:
This lower limit approaches an equality only when , the star is near pericenter, and it has an eccentricity near 1.
We evaluate the lower limit to using Eq. (3) and adopting the smallest total velocity allowed by our measurement uncertainties. These mass limits, given in Table 4, are mostly consistent with the enclosed mass versus projected distance from Sgr A* given by Genzel, Eckart, Ott, & Eisenhauer (1997) and Ghez, Klein, Morris & Becklin (1998). For many of the stars, the lower mass limits are well below the estimated enclosed mass curves, as expected given the conservative nature of the calculated limits. However, since about 40% of the time (for random distributions), we would expect to have some significant mass limits from a sample of 9 stars. Indeed, IRS 9, IRS 15NE, and SiO–6 have lower limits to the enclosed mass that are close to the values estimated from infrared stellar motions.
Our most significant lower mass limit is from IRS 9: M⊙ at a projected radius of 0.33 pc from Sgr A*. This mass exceeds by 50% the currently favored model of a M⊙ black hole, plus a M⊙ contribution from the central stellar cluster at this radius (Genzel, Eckart, Ott, & Eisenhauer, 1997; Ghez, Klein, Morris & Becklin, 1998). As pointed out above, this is an extremely conservative limit, since it assumes 1) an orbital eccentricity near 1.0, 2) the star is currently near pericenter (where it spends little time), 3) , and 4) the 3-dimensional speed is over-estimated by its uncertainties. Thus, either IRS 9 is not bound to Sgr A*, or current models underestimate the enclosed mass at a radius of about 0.3 pc from Sgr A*.
References
- Alexander & Loeb (2001) Alexander, T. & Loeb, A. 2001, ApJ, 551, 223
- Backer & Sramek (1999) Backer, D. C. & Sramek, R. A. 1999, ApJ, 524, 805
- Balick & Brown (1974) Balick, B. & Brown, R. L. 1974, ApJ, 194, 265
- Bower & Backer (1998) Bower, G. C. & Backer, D. C. 1998, ApJ, 496, L97
- Chatterjee, Hernquist, & Loeb (2002) Chatterjee, P., Hernquist, L., & Loeb, A. 2002, ApJ, 572, 371
- Eckart & Genzel (1996) Eckart, A. & Genzel, R. 1996, Nature, 383, 415
- Eckart & Genzel (1997) Eckart, A. & Genzel, R. 1997, MNRAS, 284, 576
- Eckart, Genzel, Ott, & Schödel (2002) Eckart, A., Genzel, R., Ott, T., & Schödel, R. 2002, MNRAS, 331, 917
- Fomalont et al. (1992) Fomalont, E. B., Goss, W. M., Lyne, A. G., Manchester, R. N., & Justtanont, K. 1992, MNRAS, 258, 497
- Genzel, Eckart, Ott, & Eisenhauer (1997) Genzel, R., Eckart, A., Ott, T., & Eisenhauer, F. 1997, MNRAS, 291, 219
- Genzel et al. (2000) Genzel, R., Pichon, C., Eckart, A., Gerhard, O. E., & Ott, T. 2000, MNRAS, 317, 348
- Ghez, Klein, Morris & Becklin (1998) Ghez, A. M., Klein, B. L., Morris, M., & Becklin, E. E. 1998, ApJ, 509, 678
- Ghez et al. (2000) Ghez, A. M., Morris, M., Becklin, E. E., Tanner, A., & Kremenek, T. 2000, Nature, 407, 349
- Hornstein et al. (2002) Hornstein, S. D., Ghez, A. M., Tanner, A., Morris, M., Becklin, E. E., & Wizinowich, P. 2002, ApJ, 577, L9
- Krichbaum et al. (1998) Krichbaum, T. P. et al.1998, A&A, 335, L106
- Lada & Reid (1978) Lada, C. J. & Reid, M. J. 1978, ApJ, 219, 95
- Menten et al. (1997) Menten, K. M., Reid, M. J., Eckart, A.& Genzel, R. 1997, ApJ, 475, L111
- Reid (1993) Reid, M. J. 1993, ARA&A, 31, 345
- Reid & Menten (1997) Reid, M. J. & Menten, K. M. 1997, ApJ, 476, 327
- Reid, Readhead, Vermeulen & Treuhaft (1999) Reid, M. J., Readhead, A. C. S., Vermeulen, R. C. & Treuhaft, R. N. 1999, ApJ, 524, 816
- Reid & Menten (2002) Reid, M. J. & Menten, K. M. 2002, in Pulsating Stars Workshop, Sendai, Japan
- (22) Reid, M. J. & Menten, K. M. (in preparation)
- Schödel et al. (2002) Schödel, R. et al. 2002, Nature, 419, 694
- Wardle & Yusef-Zadeh (1992) Wardle, M. & Yusef-Zadeh, F. 1992, ApJ, 387, L65