CNO Abundances in Dwarf and Spiral Galaxies
Abstract
CNO abundances in galaxies bear on issues of galactic evolution as well as stellar evolution and nucleosynthesis. Knowledge about them in dwarf and spiral galaxies depends mainly on emission lines from H ii regions, with information from stars and supernova remnants available for galaxies in the Local Group.
Oxygen abundances can be related to both local and global properties of the parent galaxies In H ii regions they range from 1/30th solar (using the new calibration) to slightly above solar. C/O is a more or less smoothly increasing function of O/H, flat at low metallicities and rising above 12+log(O/H) = 8.0 with a 45∘ slope. N/O behaves quite similarly in the traditional ‘primary followed by secondary’ style, but with a substantial scatter at least around O-abundance 8.0. C/N ratios show no clear trend with metallicity.
keywords:
carbon, nitrogen, oxygen, galaxies, stars, H ii regions1 Introduction
CNO abundances test stellar yields — C and N from a wide range of stellar masses, and oxygen mainly from massive stars above 10. As predicted by André Maeder (1992) and discussed recently by Henry et al. (2000), carbon yields increase with metallicity somewhat like a traditional ‘secondary’ element because of stellar mass loss and nitrogen perhaps even more steeply as a secondary product of the CNO cycle on carbon, although there is also a ‘primary’ component at low metallicities. Oxygen yields decrease with metallicity, at least to some extent, again because of stellar mass loss.
Apart from the implications for stellar evolution and nucleosynthesis, oxygen is the standard element for defining ‘metallicity’ in gas-rich galaxies and so is used also as a test of galactic chemical evolution and as a standard against which to judge abundances of other elements such as iron in stars and C and N in H ii regions.
How well do we know CNO abundances in external galaxies? Most data come from H ii regions and (in the Local Group) supernova remnants. For H ii regions of sufficient surface brightness and not too large metallicity, the standard method is to deduce the electron temperature in the O++ zone from the line ratio 4363/5007, use models to find that in the O+ zone and add the resulting abundances of O+ and O++ relative to H+. This is a lower limit, because of (Peimbert 1967). Recombination lines are insensitive to temperature (Esteban et al. 2002), but they are weak and the interpretation not completely straightforward (Tsamis et al. 2002). In most cases the effect appears to be small, probably under 0.1 dex, but there is another correction for oxygen locked on grains, which again might approach 0.1 dex.
When 4363 is too weak to measure, as is normally the case when metallicity approaches or exceeds solar, uncertainties multiply. Searle (1971) had the fundamental insight that the spectral changes exhibited by giant H ii regions across Scd galaxies (Aller 1942) were due to a radial abundance gradient, and thus inspired various ‘empirical’ methods of abundance estimation based on strong nebular lines alone. The most widely used is the notorious method (Pagel et al. 1979, 1980), calibrated against a model for S5 in M 101 by Shields & Searle (1978). Investigations since then have shown that the oxygen in S5 was overestimated (Kinkel & Rosa 1994), as it has been in some other regions (Castellanos et al. 2002), so that our calibrations have overestimated oxygen abundances near solar, and attempted recalibrations by McCall et al. (1985), Evans & Dopita (1985) and McGaugh (1991) have various weaknesses of their own, quite apart from the inevitable non-uniqueness of the relationship (cf. Pilyugin 2000). There is some promise in newly developed strong-line indices like S23 (Díaz & Perez-Montero 2000), S234 (Oey & Shields 2000) and especially in refinements of the method by Pilyugin (2000, 2001a) in which the relative strengths of [O ii] and [O iii] lines are taken into account in an empirical manner, reducing the scatter. Until more of these refinements have been applied, however, abundances near and above solar have to be taken with a grain of salt.
After oxygen, the next step is usually to estimate the N/O ratio. A common assumption, supported by many models at least at low metallicities, is that nitrogen is ionized to the same degree as oxygen (e.g. Garnett 1990), so that N/O = N+/O+. This can actually be checked from infra-red data when available, e.g. in 30 Doradus (Lester et al. 1987). Carbon lacks prominent emission lines in the visible or near IR, so one has to use UV observations, usually of the intercombination lines C iii] 1909 and C ii] 2326.
CNO abundances are also now being measured in stars, mostly B stars and supergiants, in the nearest galaxies. As in the Milky Way, comparisons between stellar and nebular abundances provide a useful check. Here one has to be rather careful for two reasons.
-
1.
Stellar abundances are often expressed differentially relative to the Sun, but the solar goalposts are shifting, at least in the cases of C and O (Holweger 2001; Allende Prieto et al. 2001, 2002) and this has caused some confusion.
-
2.
In some hot main-sequence stars and supergiants, especially if rotating, the atmospheres have undergone some CNO processing, so to that extent it is the differences between stars and H ii regions that are of interest; but oxygen is usually unaffected.
2 The Local Group
| Object | C | N | O | Reference |
| Local Galaxy: | ||||
| Sun | 8.4 | (7.8?) | 8.7 | All. Pr. et al 01,02 |
| ” | 8.6 | 7.9 | 8.7 | Holweger 01 |
| Orion nebula | 8.5 | 7.8 | 8.7 | Esteban et al 98 |
| diffuse ISM | 8.6 to 8.7 | Meyer et al 98 | ||
| cepheids | 8.0/8.6 | 8.3/8.9 | Luck et al 98 | |
| M 31: | ||||
| H ii reg. | 7.0/8.2 | 8.5/9.2 | Dennef. & Kunth 81 | |
| SNR | 7.4/8.0 | 8.3/8.7 | Blair et al 82 | |
| 4 AF supergi | 8.3 | 8.8 | Venn et al. 00 | |
| M 33: | ||||
| H ii reg. | 7.9 | 9.0 | Vílchez et al 88 | |
| SNR | 7.8 | 8.8 | Blair et al 85 | |
| B,A supergi | 9.0 | Monteverde et al 97 | ||
| LMC: | ||||
| H ii reg., SNR | 7.9 | 6.9 | 8.4 | Garnett 99 |
| cepheids | 7.7/8.3 | 8.0/8.8 | Luck et al 98 | |
| PS 34-16 (early B) | 7.1 | 7.5 | 8.4 | Rolleston |
| LH 104-24 (””) | 7.5 | 7.7 | 8.5 | et al 96 |
| NGC 1818/D1 | 7.8 | 7.4 | 8.5 | Korn et al 02 |
| N2004 (4 early B) | 8.1 | 7.0 | 8.4 | ” ” |
| 4 F supergi | 8.1 | Russell & Bessell 89 | ||
| SMC: | ||||
| H ii reg., SNR | 7.5 | 6.6 | 8.1 | Kurt et al 98 |
| cepheids | 7.4/7.8 | 8.0/8.3 | Luck et al 98 | |
| 10 A supergi | / | 6.8/7.7 | 8.1 | Venn 99 |
| 3 F supergi | 7.7 | 8.1 | Spite et al 89 | |
| 2 F supergi | 7.8 | Russell & Bessell 89 | ||
| NGC 6822: | ||||
| H ii reg. | 6.6 | 8.3 | Pagel et al 80 | |
| ” ” | 8.4 | Pilyugin 01c | ||
| 2 A supergi | 8.4 | Venn et al 01 |
A selection of recent data is given in Table 1. Several points emerge from this table.
-
1.
There is excellent agreement between the oxygen abundances measured in stars and H ii regions, brought about in the case of the Sun and Orion by a combination of downward revision in the Sun and the use of recombination lines in Orion. There is equally good agreement between gas and young stars in the Magellanic Clouds. This is an improvement on the situation 10 years ago when the systematic uncertainties were such that one had to resort to the expedient of comparing like with like — B stars with B stars, supergiants with supergiants, H ii regions with H ii regions etc (Russell & Dopita 1992; Pagel 1993).
-
2.
While some of the B stars and supergiants in both Clouds show evidence of CN processing, others do not and these show excellent agreement with H ii regions also in C and N.
-
3.
The two Clouds have similar C/O and N/O ratios, the latter being distinctly lower than in the Sun and Orion. We shall see later that there are other gas-rich dwarf galaxies in the same range of oxygen abundance showing a wide range in N/O.
Relevant data are also accumulating for older objects in the LMC, at least for oxygen — from giants in globular clusters (Hill et al. 2000) and from planetary nebulae (Dopita et al. 1997) — with quite good overall agreement. Oxygen, like iron, shows a fairly clean age-metallicity relation, unlike the case for the solar neighbourhood (Hill et al. Fig 4).
3 Irregular and blue compact galaxies
Irregular and blue compact galaxies are gas-rich objects, mostly of low luminosity but having appreciable star formation rates leading to bright H ii regions that have been intensively studied in recent years, not least in the search for primordial helium. Some stellar data are now available for NGC 6822 giving good agreement with H ii regions (Table 1) and a slight hint of an abundance gradient.
However, some points are still controversial.
-
1.
Luminosity-metallicity (i.e. O-abundance) relation. First noted by Lequeux et al. (1979) in the form of a mass-metallicity relation, and discussed further by Skillman et al. (1989a) and Richer & McCall (1995), the relationship for d Irr has been challenged (e.g. Hidalgo-Gámez & Olofsson 1998; Hunter & Hoffman 1990), but there are uncertainties in measuring the the weak 4363 line and Pilyugin (2001c) using a more robust strong-line method finds it to hold pretty well. Blue compact galaxies do not fit, but if metallicity is plotted against velocity dispersion — a measure of the total mass — the scatter is much reduced (Kobulnicky & Zaritsky 1999). This relation is very important from the point of view of galactic chemical evolution and is suggestive of increasing loss of enriched gas from shallower potential wells, but there are also other reasons, notably the gas fraction (cf. van Zee et al. 1997; Pilyugin & Ferrini 2000; Larsen et al. 2001; Garnett 2002). Tidal dwarf galaxies lie above the usual relation (Duc & Mirabel 1998); there may also be a modest upward shift for galaxies in a dense environment, but this is not certain (Vílchez 1995).
-
2.
Uniformity of abundances. How uniform are abundances across a galaxy or even one giant H ii region? Does the neutral gas have the same metallicity as the H ii regions or are they self-enriched (cf. Kunth & Sargent 1986)? For oxygen, the evidence mostly favours uniformity; the most famous case in which it was challenged was that of I Zw 18 (see Kunth et al. 1994; Pettini & Lipman 1995; van Zee et al. 1998c; Levshakov et al. 2001). Thuan et al. (1997) found a very low upper limit to oxygen abundance in the H i gas of the BCG SBS 0335 052, but until the Doppler width is directly measured as in I Zw 18, the significance of this limit remains in doubt.
-
3.
For nitrogen, the existence of intrinsic scatter is indisputable (e.g. Kobulnicky & Skillman 1996, 1998; Kobulnicky et al. 1997), but the meaning of this scatter is unclear. In NGC 5253 and II Zw 40, large variations occur in N/H over small spatial intervals even within what looks like one giant H ii region, unaccompanied by noticeable variations in any other element (Walsh & Roy 1989, 1993), whereas in others like NGC 4214 there is an anti-correlation between N/O and O/H such as might be expected to occur if shortly after a burst of star formation oxygen were enhanced but nitrogen had not yet had time to catch up (Garnett 1990; Marconi, Matteucci & Tosi 1994; Pilyugin 1993, 1999; Larsen et al. 2001). However, according to Izotov & Thuan (1999), below an oxygen abundance of about 7.7, all the scatter that appeared in previous diagrams of H ii galaxies is spurious; N/O is remarkably constant and free from scatter at 1/40, compared to solar 1/7. That figure also appears to be a well-defined lower limiting plateau for all known H ii regions and possibly representative of all irregular and BCG’s not affected by whatever is causing the scatter around an oxygen abundance of 8.0, since it still applies to NGC 6822 at an oxygen abundance of 8.3 (cf Skillman et al. 1989b).
The location of the scatter raises a problem for the point of view conventionally put forward for explaining it, based on a time delay for especially primary nitrogen (e.g. Edmunds & Pagel 1978), since that theory requires the scatter to be greatest at the lowest metallicities, just the opposite of what is seen, and so IT argue that the primary nitrogen comes from massive stars and is produced in lockstep with oxygen, the scatter at higher metallicities coming then from secondary nitrogen, as was suggested by Pagel et al. (1986), although the association with strong WR features that we suggested then has not been supported by later work. Bursts, time lags and IMS could still be involved, however, if the lowest-metallicity galaxies are exceptionally slow evolvers rather than just very young, so that the effects of all past bursts have had time to be evened out, and there are some indications of scatter in N/O among the DLA clouds. It could then be the regions with an oxygen abundance around 8.0, e.g. SMC and NGC 4214, that show the greatest influence of bursts — involving both primary and secondary nitrogen — compared to still more metal-rich regions in spiral galaxies. I think the issue of how much massive stars contribute to primary nitrogen is still open (cf. Meynet & Maeder 2002ab).
-
4.
Carbon abundances show a plateau followed by a rising trend as a function of metallicity, with C/O increasing from about 1/5 in I Zw 18 to about 1/3 in the LMC (Garnett et al. 1997; Izotov & Thuan 1999); see Fig 1. There is some dispute as to the smoothness of the trend, but the differences for objects in common never exceed 0.1 dex. The rise in C/O with O/H probably results from increasing carbon and decreasing oxygen yields from massive stars (Maeder 1992; Henry, Edmunds & Köppen 2000).
4 Spiral galaxies
4.1 Oxygen
Oxygen abundance gradients vary quite widely (e.g. Zaritsky et al. 1994; van Zee et al. 1998b): in late-type spirals like M 33 and M 101 (see Torres-Peimbert et al. 1989; Pilyugin 2001b), the variation is from more or less solar near the centre to about an order of magnitude lower at the isophotal radius, while in early-type spirals high abundances extend to greater radial distances. Also at the other end of the Hubble sequence, Sd and Sdm spirals and low surface brightness galaxies (de Blok & van der Hulst 1998) have shallower gradients again, with a lower abundance overall. McCall (1982), Edmunds & Pagel (1984) and Vila-Costas & Edmunds (1992) studied correlations with local properties at the appropriate galactocentric distance, i.e. the surface brightness and the gas fraction, while Zaritsky et al. stress the importance of global galaxy properties: the luminosity and the rotation speed (representing mass). Probably the global properties plus any accidental interactions are the main driver, leading to the formation of exponential disks in which the correlations with local properties then arise.
O-abundance correlates with local surface brightness and gas fraction, with some segregation between morphological types, and the mean abundance increases with the parent galaxy’s luminosity or mass as indicated by the rotational velocity. A further variable is the environment, e.g. in inner parts of the Virgo cluster there are gas-stripped galaxies with higher abundances at a fixed fraction of the isophotal radius than normal galaxies of the same type, but such cases can also be found among field galaxies (Pilyugin et al. 2001).
4.2 Nitrogen
N/O ratios in spiral galaxy H ii regions start distinctly above the Magellanic Cloud plateau value; e.g. at O=8.4, outer parts of spirals typically have log (N/O)= compared to the LMC value of (Thurston et al. 1996; van Zee et al. 1998a; Pilyugin et al. 2001. ) There is some intrinsic scatter with early spirals having a slightly larger N/O at given O/H than late spirals (Pilyugin et al. 2002), but with the new calibrations the Sun and Orion fit in perfectly. We can see secondary nitrogen production taking over from primary at an oxygen abundance of about 8.5.
4.3 Carbon
Garnett et al. (1999) have used HST to measure carbon abundances in selected H ii regions of M 101 and NGC 2403 and compared the results with irregular galaxies, Galactic H ii regions and the Sun. Disregarding the scatter, which may be spurious, C/O behaves remarkably like N/O and C/N is nearly constant throughout the abundance range.
5 Putting it all together
A comprehensive discussion of CNO in irregular and spiral galaxies has been given by Henry et al. (HEK 2000). They collected data from both stars and nebulae, so that there is a great mixture of ages there, but within the uncertainties the stars and the nebulae agree pretty well. Consequently, the nebulae convey the same message as the stars about carbon and oxygen, already discussed previously by Prantzos et al. (1994) and by Gustafsson et al. (1999). Intermediate-mass stars are inadequate for the task of making carbon and one needs large metallicity-dependent yields from massive stars, as originally proposed by our birthday boy in 1992. Since massive stars are involved in both cases, the C/O ratio is largely a function of the stellar yields and insensitive to some galactic phenomena like the star formation rate.
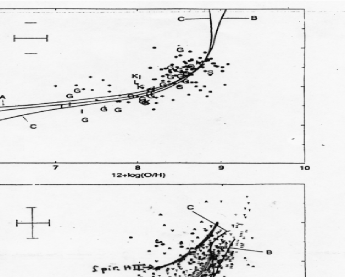
The case of nitrogen is more complicated because of time delays of up to years associated with the evolution of IMS, which produce enough primary nitrogen to account for the plateau at low metallicities (van den Hoek & Groenewegen 1997; Meynet & Maeder 2002ab). The secondary component comes from the high-mass stars, again as predicted by Maeder (1992), but this time there is more sensitivity to galactic parameters such as the star formation rate (see Fig 1). Looking at the GCE model computations by HEK, one might expect the stars to lie along evolutionary tracks, but the H ii regions could equally be along isochrones, or some mixture of the two. In fact the objects with log (N/O) (from I Zw 18 to NGC 6822) lie pretty much along HEK’s 0.5 Gyr isochrone (the exact age would be a function of the adopted star formation law), although HEK themselves preferred to consider them as lying along an evolutionary track. The isochrone interpretation is essentially the one suggested by Edmunds & Pagel (1978). The 2 Gyr isochrone has a shape not very different from the Pilyugin et al. observational track for spirals, but is a factor of 2 or so too low, so it may be that one has to invoke inflow or some other effect not included in their models, and probably higher nitrogen yields from low-mass stars.
References
- [1] Allende Prieto, C., Lambert, D.L. & Asplund, M. 2001, ApJL, 556, L63
- [2] Allende Prieto, C., Lambert, D.L. & Asplund, M. 2002, astro-ph/0206089
- [3] Aller, L.H. 1942, ApJ, 95, 52
- [4] Blair, W.P., Kirshner, R.P. & Chevalier, R.A. 1982, ApJ, 254, 50
- [5] Blair, W.P., Kirshner, R.P. & Chevalier, R.A. 1985, ApJ, 289, 582
- [6] Castellanos, M., Díaz, A. & Terlevich, E. 2002, MNRAS, 329, 315
- [7] de Blok, W.J.G. & van der Hulst, J.M. 1998, AA, 335, 421
- [8] Dennefeld, M. & Kunth, D. 1981, AJ, 86, 989
- [9] Díaz, A.I. & Perez-Montero, E. 2000, MNRAS, 312, 130
- [10] Dopita, M.A., Vassiliadis, E., Wood, P.R. et al. 1997, ApJ, 474, 188
- [11] Duc, P.-A. & Mirabel, I.F. 1998, AA, 333, 813
- [12] Edmunds, M.G. & Pagel, B.E.J. 1978, MNRAS, 185, 77
- [13] Edmunds, M.G. & Pagel, B.E.J. 1984, MNRAS, 211, 507
- [14] Esteban, C., Peimbert, M., Torres-Peimbert, S. & Escalante, V. 1998, MNRAS, 295, 401
- [15] Esteban, C., Peimbert, M., Torres-Peimbert, S. & Rodriguez, M. 2002, ApJ, in press, astro-ph/0208313
- [16] Evans, I.N. & Dopita, M.A. 1985, ApJS, 58, 125
- [17] Garnett, D.R. 1990, ApJ, 363, 142
- [18] Garnett, D.R. 1999, in Y.-H. Chu, N.B. Suntzeff, J.E. Hesser & D.A. Bohlender (eds), New Views of the Magellanic Clouds, IAU Symp. Series Vol. 190, Kluwer, Dordrecht, p. 266
- [19] Garnett, D.R. 2002, ApJ, astro-ph/0209012
- [20] Garnett, D.R., Shields, G.A., Skillman, E.D., Sagan, S.P. & Dufour, R.J. 1997, ApJ, 489, 63
- [21] Garnett, D.R. et al. 1999, ApJ, 513, 168
- [22] Garnett, D.R., Skillman, E.D., Dufour, R.J. & Shields, G. 1997, ApJ, 481, 174
- [23] Gustafsson, B., Karlsson, T., Olsson, E., Edvardsson, B. & Ryde, N. 1999, AA, 342, 426
- [24] Henry, R.B.C., Edmunds, M.G. & Köppen, J. 2000, ApJ, 541, 660
- [25] Hidalgo-Gámez, A.M. & Olofsson, K. 1998, AA, 334, 45
- [26] Hill, V., François, P., Primas, F. & Spite, F. 2000, AA, 364, L19
- [27] Holweger, H. 2001, in R.F. Wimmer-Schweingruber (ed), Solar and Galactic Composition, AIP Conf. Proc., astro-ph/0107426
- [28] Hunter, D.A. & Hoffman, L. 1999, AJ, 117, 2789
- [29] Izotov, Y. & Thuan, T.X. 1999, ApJ, 511, 639
- [30] Kinkel, U., & Rosa, M. 1994, AA, 282, 37
- [31] Kobulnicky, H.A. & Skillman, E.D. 1996, ApJ, 471, 211
- [32] Kobulnicky, H.A. & Skillman, E.D. 1998, ApJ, 497, 601
- [33] Kobulnicky, H.A., Skillman, E.D., Roy, J.-R., Walsh, J.R. & Rosa, M.R. 1997, ApJ, 477, 679
- [34] Kobulnicky, H.A. & Zaritsky, D. 1999, ApJ, 511, 118
- [35] Korn, A.J., Keller, S.C., Kaufer, A. et al. 2002, astro-ph/ 0201453
- [36] Kunth, D., Lequeux, J., Sargent, W.L.W. & Viallefond, F. 1994, AA, 282, 709
- [37] Kunth, D. & Sargent, W.L.W. 1986, ApJ, 300, 496
- [38] Kurt, C.M., Dufour, R.J., Garnett, D.R. et al. 1998, preprint
- [39] Larsen, T.I., Sommer-Larsen, J. & Pagel, B.E.J. 2001, MNRAS, 323, 555
- [40] Lequeux, J., Peimbert, M., Rayo, J.F., Serrano, A. & Torres-Peimbert, S. 1979, AA, 80, 155
- [41] Lester, D.F., Dinerstein, H.L., Werner, M.W. et al. 1987, ApJ, 320, 573
- [42] Levshakov, S.A., Kegel, W.H. & Agafonova, I.I. 2001, AA, 373, 836
- [43] Luck, R.E., Moffett, T.J., Barnes, T.G. & Gieren, W.P. 1998, AJ, 115, 605
- [44] McCall, M.L. 1982, Thesis, Univ. Texas, Austin
- [45] McCall, M.L., Rybski, P.M. & Shields, G.A. 1985, ApJS, 57, 1
- [46] McGaugh, S.S. 1991, ApJ, 380, 140
- [47] Maeder, A. 1992, AA, 264, 105
- [48] Marconi, A., Matteucci, F. & Tosi, M. 1994, MNRAS, 270, 35
- [49] Meyer, D.M., Jura, M. & Cardelli, J.A. 1998, ApJ, 493, 222
- [50] Meynet, G. & Maeder, A. 2002a, AA, 381, L25; astro-ph/0111187
- [51] Meynet, G. & Maeder, A. 2002b, astro-ph/0205370
- [52] Monteverde, M.I., Herrero, A., Lennon, D.J. & Kudritzki, R.-P. 1997, ApJ, 474, L107
- [53] Oey, M.S. & Shields, J.C. 2000, ApJ, 539, 687
- [54] Pagel, B.E.J. 1993, in B. Baschek, G. Klare, & J. Lequeux (eds.), New Aspects of Magellanic Cloud Research, Springer-Verlag, p. 330.
- [55] Pagel, B.E.J., Edmunds, M.G., Blackwell, D.E., Chun, M.S. & Smith, G. 1979, MNRAS, 189, 95
- [56] Pagel, B.E.J., Edmunds, M.G. & Smith, G. 1980, MNRAS, 193, 219
- [57] Pagel, B.E.J., Terlevich, R.J. & Melnick, J. 1986, PASP, 98, 1005
- [58] Peimbert, M. 1967, Ap. J., 150, 825
- [59] Pettini, M. & Lipman, K. 1995, AA, 297, L63
- [60] Pilyugin, L. S. 1993, AA, 277, 42
- [61] Pilyugin, L. S. 1999, AA, 346, 428
- [62] Pilyugin, L. 2000, AA, 362, 325
- [63] Pilyugin, L. S. 2001a, AA, 369, 594
- [64] Pilyugin, L. S. 2001b, AA, astro-ph/0105103
- [65] Pilyugin, L. S. 2001c, AA, 374, 412, astro-ph/0105360
- [66] Pilyugin, L. & Ferrini, F. 2000, AA, 358, 72
- [67] Pilyugin, L. S., Mollá, M., Ferrini, F. & Vílchez, J.M. 2001, astro-ph/0112128
- [68] Pilyugin, L.S., Thuan, T.X. & Vilchez, J.M. 2002, AA, astro-ph/0210225
- [69] Prantzos, N., Vangioni-Flam, E. & Chauveau, S. 1994, AA, 285, 132
- [70] Richer, M.G. & McCall, M.L. 1995, ApJ, 445, 642
- [71] Rolleston, W.R.J., Brown, P.J.F., Dufton, P.L. & Howarth, I.D. 1996, AA, 315, 95
- [72] Russell, S.C. & Bessell, M.S. 1989, ApJS, 70, 865
- [73] Russell, S.C. & Dopita, M.S. 1992, ApJ, 384, 508
- [74] Searle, L. 1971, ApJ, 168, 327
- [75] Shields, G. & Searle, L. 1978, ApJ, 222, 821
- [76] Skillman, E.D., Kennicutt, R. & Hodge, P.W. 1989a, ApJ, 347, 875
- [77] Skillman, E.D., Terlevich, R. & Melnick, J. 1989b, MNRAS, 240, 563
- [78] Spite, M., Barbuy, B. & Spite, F. 1989, AA, 222, 35
- [79] Thuan, T.X., Izotov, Y.I. & Lipovetsky, V.A. 1997, ApJ, 477, 661
- [80] Thurston, T.R., Edmunds, M.G. & Henry, R.B.C. 1996, MNRAS, 283, 990
- [81] Torres-Peimbert, S., Peimbert, M. & Fierro, J. 1989, ApJ, 345, 186
- [82] Tsamis, Y.G., Barlow, M.J., Liu, X.-W., Danziger, I.J. & Storey, P.J. 2002, MNRAS, in press, astro-ph/0209534
- [83] van den Hoek, L.B. & Groenevegen, M.A.T. 1997, AAS, 123, 305
- [84] van Zee, L., Haynes, M.P. & Salzer, J.J. 1997, AJ, 114, 2497
- [85] van Zee, L., Salzer, J.J. & Haynes, M.P. 1998a, ApJ, 497, L1
- [86] van Zee, L., Salzer, J.J., Haynes, M.P., O’Donoghue, A.A, & Balonek, T.J. 1998b, AJ, 116, 2805
- [87] van Zee, L., Westpfahl, D., Haynes, M.P. & Salzer, J.J. 1998c, AJ, 115, 1000
- [88] Venn, K.A., 1999, ApJ, 518, 405
- [89] Venn, K.A., McCarthy, J.K. Lennon, D.J., Przybilla, N. Kudritzki, R.P. & Lemke, M. 2000, ApJ, 541, 610
- [90] Venn, K.A., Lennon, D.J., Kaufer, A., McCarthy, J.K., Przybilla, N., Kudritzki, R.P, Lemke, M, Skillman, E.D. & Smartt, S.J. 2001, ApJ, 547, 765
- [91] Vílchez, J.M. 1995, AJ, 110, 1090
- [92] Vílchez, J.M., Pagel, B.E.J., Díaz, A.I., Terlevich, E. & Edmunds, M.G. 1988, MNRAS, 235, 633
- [93] Vila-Costas, M.B. & Edmunds, M.G. 1992, MNRAS, 259, 121
- [94] Walsh, J.R. & Roy, J.-R. 1989, MNRAS, 239, 297
- [95] Walsh, J.R. & Roy, J.-R. 1993, MNRAS, 262, 27
- [96] Zaritsky, D., Kennicutt, R.C. Jr & Huchra, J.P. 1994, ApJ, 420, 87