Optical and Near–Infrared Spectroscopy of a High–Redshift, Hard X–ray Emitting Spiral Galaxy11affiliation: Based on observations made at the W.M. Keck Observatory, which is operated as a scientific partnership among the California Institute of Technology, the University of California and the National Aeronautics and Space Administration. The Observatory was made possible by the generous financial support of the W.M. Keck Foundation.
Abstract
We present optical and near–infrared Keck spectroscopy of CXOHDFN J123635.6621424 (hereafter HDFX28), a hard X–ray source at a redshift of in the flanking fields of the Hubble Deep Field–North (HDF–N). HDFX28 is a red source () with extended steep–spectrum () microjansky radio emission and significant emission (441 Jy) at 15 m. Accordingly, initial investigations prompted the interpretation that HDFX28 is powered by star formation. Subsequent Chandra imaging, however, revealed hard () X–ray emission indicative of absorbed AGN activity, implying that HDFX28 is an obscured, Type II AGN. The optical and near–infrared spectra presented herein corroborate this result; the near–infrared emission lines cannot be powered by star formation alone, and the optical emission lines indicate a buried AGN. HDFX28 is identified with a face–on, moderately late–type spiral galaxy. Multi–wavelength morphological studies of the HDF–N have heretofore revealed no galaxies with any kind of recognizable spiral structure beyond . We present a quantitative analysis of the morphology of HDFX28, and we find the measures of central concentration and asymmetry to be indeed consistent with those expected for a rare high–redshift spiral galaxy.
1 Introduction
The origin of the X–ray background (XRB) remains an enduring puzzle for X–ray astronomy. Great progress has been made during the last four years: ROSAT surveys successfully resolved 80% of the soft XRB (0.5–2 keV) into discrete sources (e.g. Hasinger et al. 1998) and current work with the Chandra X–ray Observatory (hereafter, Chandra) has successfully resolved a similar fraction of the hard XRB (2–8 keV; Brandt et al. 2001; Giacconi et al. 2001, 2002; Hornschemeier et al. 2001; Rosati et al. 2002). Nonetheless, a coherent understanding of the physical and evolutionary properties of the sources which comprise the XRB is only just now emerging. Although much of this population appears to be the nuclei of otherwise normal bright galaxies () or typical active galactic nuclei (AGNs), a significant fraction of the discrete sources is optically faint (), and therefore not easily identified (e.g. Alexander et al. 2001; Barger et al. 2002). Type II quasars, for instance, are thought to be AGNs viewed edge–on through an obscuring torus (Antonucci 1993) and are deemed an essential component of the XRB–producing population (Moran et al. 2001). However, few well–studied examples of such systems are known at high redshift, and owing in part to their lack of relativistic brightening, they are not easily identified in shallow, large–area surveys (Norman et al. 2002; Stern et al. 2002a).
Type II quasars represent just one of several diverse classes of objects emerging in follow–up work to deep Chandra fields (e.g. Hornschemeier et al. 2001; Schreier et al. 2001; Stern et al. 2002b). On the extra–galactic side, we find X-ray–loud composite galaxies typified by starburst or early–type optical spectra which bear no signature of their buried AGN (e.g. Moran et al. 1996; Levenson et al. 2001; Stern et al. 2002b). Additionally, we find X–ray sources whose optical counterparts belong to the class of faint, extremely red objects (EROs), the nature of which has remained uncertain owing to the difficulty in spectroscopic follow–up (e.g. Alexander et al. 2002; Elston et al. 1988, 1989; Hu & Ridgway 1994; Graham & Dey 1996; Liu et al. 2000; Hornschemeier et al. 2001; Stern et al. 2002b). On the Galactic side, we find late–type dwarfs emitting soft X–rays originating in chromospheric activity (e.g. Hornschemeier et al. 2001), and very low mass binary systems emitting hard X–rays driven by accretion (e.g. Stern et al. 2002b). Amidst the emergence of this menagerie of objects, optical and near–infrared spectroscopic follow–up has become increasingly vital not only to identifying the source population of the XRB, but also to elucidating the physics of X–ray sources in general, and to delineating their evolution with redshift.
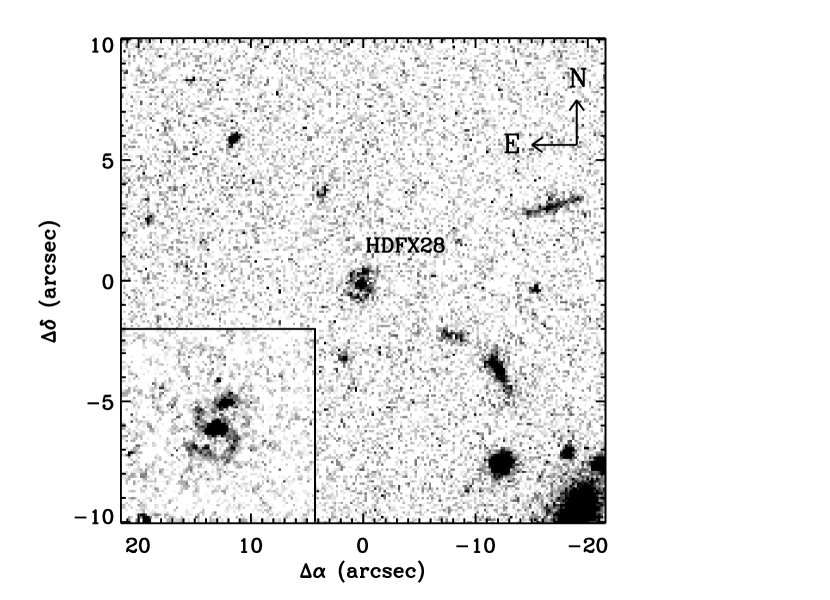
One critical facet of this endeavor is simply to distinguish between objects powered by mass accretion onto supermassive black holes (quasars and other AGNs) and those powered by nuclear fusion in stars (normal and starburst galaxies). To this end, we present optical and near–infrared spectra of CXOHDFN J123635.6621424 (hereafter HDFX28), a hard X–ray source identified with a face–on spiral galaxy at redshift (Figure 1). HDFX28 is fortuitously located in the Hubble Deep Field–North inner west (HDF–N IW) flanking field, and was therefore subject to a vast array of follow–up imaging. As such, HDFX28 was initially identified as an extended microjansky radio source with a comparatively steep spectral index (; ). Together with its detection by the Infrared Space Observatory Camera (ISOCAM) and its pronounced optical spatial extent (), the radio data for HDFX28 prompted an initial interpretation as a galaxy powered by star formation (e.g. Richards 2000). However, as we discuss below, the detection of HDFX28 as a hard X–ray source in the deep Chandra survey of the HDF–N (Hornschemeier et al. 2001; Brandt et al. 2001), corroborated by the spectroscopy presented herein, demonstrates that this galaxy in fact harbors an obscured, Type II AGN.
In addition to confirming its AGN status, the spectroscopy of HDFX28 indicates a surprisingly high redshift for an object with identifiable spiral structure. Dickinson (2000) summarizes the results of morphological studies of the HDF–N by reporting a total lack of even plausible candidates for spiral galaxies at . Prompted by this lack of precedent for high–redshift spirals, we present a quantitative study of central concentration and asymmetry in HDFX28 based on the scheme devised by Abraham et al. (1996) for the analysis of large CCD imaging surveys. With the application of a modest morphological –correction, we find HDFX28 to have morphological parameters consistent with those derived from catalogs of both artificially redshifted nearby spirals, as well as catalogs of HST imaging of spirals out to (Abraham et al. 1996).
In short, HDFX28 is intriguing both for its membership in the emerging class of X–ray–selected Type II AGN, and for possessing a morphology which is unprecedented at its redshift. We describe the optical and near–infrared spectroscopy of HDFX28 in section §2, and we present the results of the spectroscopy and the classification of the source as an obscured, Type II AGN in §3. We report on our quantitative analysis of its morphology in §4, and we summarize our results in §5. Throughout this paper we adopt the currently favored –cosmology of and , with km s-1 Mpc-1 (e.g. Riess et al. 2001). At , such a universe is 3.22 Gyr old, the lookback time is 76.9% of the total age of the Universe, and an angular size of 10 corresponds to 8.66 kpc.
2 Spectroscopic Observations
2.1 Optical Spectroscopy
We obtained the optical spectrum of HDFX28 on UT 2001 February 23 as part of an observing campaign of photometrically–selected high–redshift candidates in the HDF–N and its environs (Dawson et al. 2001). The data were taken with the Low Resolution Imaging Spectrometer (LRIS; Oke et al. 1995) at the Cassegrain focus on the 10m Keck I telescope, after the advent of the LRIS–B spectrograph channel (McCarthy et al. 1998). The red–sensitive LRIS–R camera uses a Tek 20482 CCD detector with a pixel scale of 0212 pixel-1; the blue–sensitive LRIS–B camera is nearly identical. The data were taken with slitmasks designed to obtain spectra for targets simultaneously through 15 wide slits. For this observation, we used the 400 lines mm-1 grating blazed at 8500 Å (1.86 Å pix-1 dispersion) in the red channel, and a 300 lines mm-1 grism blazed at 5000 Å (2.64 Å pix-1 dispersion) in the blue channel. To split the red and blue channels, we used a dichroic with a cutoff at 6800 Å. With this setup, the combined spectrograph channels afforded a spectral coverage of roughly 3200 Å to 1 m, covering the entire optical window. The total exposure time of 2.75 hours was broken into three exposures of 1500 seconds and three exposures of 1800 seconds; we performed spatial offsets between exposures to facilitate the removal of fringing at long wavelengths. The airmass never exceeded 1.75 during the observations.
We used the IRAF111IRAF is distributed by the National Optical Astronomy Observatories, which are operated by the Association of Universities for Research in Astronomy, Inc., under cooperative agreement with the National Science Foundation. package (Tody 1993) to process the slitmask data, following, where possible, standard slit spectroscopy procedures. One deviation from standard spectroscopic data reduction was that the blue–channel spectrum was not divided by a flatfield exposure. This omission is a consequence of the fact that the existing internal halogen lamp produces no light shortward of 3800 Å, and also appears to contain prominent UV emission lines. Our experience with attempts at flatfielding LRIS–B in a variety of spectroscopic set–ups indicates that the pixel–to–pixel variations corrected by flatfielding are typically %, and that they have little systematic variation across the CCD; as such, we expect that our flux–calibrated spectra are little affected by this treatment. Remaining aspects of treating the slitmask data were facilitated by a home–grown software package, BOGUS222BOGUS is available online at http://zwolfkinder.jpl.nasa.gov/stern/homepage/bogus.html., created by D. Stern, A.J. Bunker, and S.A. Stanford.
We extracted the blue–channel and red–channel spectra using the optimal extraction algorithm described in Horne (1986). Wavelength calibrations were performed in the standard fashion using Hg, Ne, Ar, and Kr arc lamps; we employed telluric sky lines to adjust the wavelength zero–point. We performed flux calibrations with longslit observations of standard stars from Massey & Gronwall (1990) taken with the instrument in the same configuration as the multislit observation. However, it should be noted that owing to the constraints of observing with a slitmask, the data were taken at a position angle of 163.1∘, not at the parallactic angle. The final extracted blue–channel optical spectrum is shown in Figure 2; the final extracted red–channel optical spectrum is shown in Figure 3.
2.2 Near–Infrared Spectroscopy
We obtained the near–infrared spectrum of HDFX28 with the 10m Keck II telescope on UT 2001 April 13, using the facility near–infrared spectrometer NIRSPEC (McLean et al. 1998). We employed a 057 42″ slit to achieve low resolution () spectra in the wavelength range 1.75–2.17 m. We obtained four 600 second integrations, with spatial offsets between exposure. The data were dark subtracted, flat–fielded and corrected for cosmic rays and bad pixels in the standard fashion. We sky–subtracted by pairwise subtraction of successive nods along the slit. The curved spectral order was then rectified onto a slit–position/wavelength grid based on a wavelength solution from arc lamp emission lines. As data from the second slit position had significantly lower signal-to-noise, likely the result of temporary seeing degradation or misalignment of the slit, they were rejected. The total integration time for the near–infrared spectrum is thus 1800 seconds.
The galaxy spectrum was extracted using a Gaussian weighting function which was matched to the wavelength–integrated profile. To correct for atmospheric absorption, we divided the galaxy spectrum by the spectrum of an A0V calibration star, HD 99966. Both the galaxy and the star were observed at an airmass of . The resulting spectrum is shown in Figure 4.
3 HDFX28 as a Type II AGN
3.1 Results from the Optical Spectrum
The optical spectrum of HDFX28 shows resolved, moderate–width, high–ionization emission lines typical of AGNs (Figures 2 and 3). Both the permitted and forbidden lines are well–identified, allowing for unambiguous determination of the redshift. To this end, and to ascertain the fluxes and widths of the emission lines, we made a weighted, single Gaussian Levenberg–Markwardt fit to each isolated line333In the case of the unresolved Si IV doublet, we fit with two Gaussians with amplitudes constrained by the ratio of the doublet Einstein –values, 1.02:1; due to the large uncertainty in the fit, however, this line was not used in any of the following analysis., resulting in a redshift of . We note that this value deviates somewhat from that presented in a recent spectroscopic catalog of Chandra sources in the HDF–N (source 142, ; Barger et al. 2002). The emission line parameters are cataloged in Table 1.
The emission line widths in the optical spectrum present a solid case for the classification of HDFX28 in the overall taxonomy of AGN. The canonical definition of a Seyfert 1 galaxy involves a spectrum with broad permitted lines, typically km s-1 FWHM, and comparatively narrow forbidden lines, typically km s-1 FWHM (e.g. Osterbrock 1989). The definition of a Seyfert 2, by contrast, involves a spectrum showing permitted and forbidden lines of approximately the same FWHM, typically km s-1. On this account, the rough agreement between the widths of the permitted and forbidden UV lines in HDFX28 calls for classification as a Type II source. Moreover, though the permitted line widths of km s-1 slightly exceed those expected for a prototypical Seyfert 2, they still fall far short of permitted line widths observed in Type I sources, or in the broad line regions of Type II sources seen in polarized light (e.g. Vernet et al. 2001). In particular, the width of the He II 1640 line compares favorably with the nine high–redshift radio galaxies (HzRGs) presented in Vernet et al. (2001); HzRGs are perhaps the best–studied class of obscured, Type II AGN at the redshift of HDFX28 (e.g. McCarthy 1993; Eales & Rawlings 1993, 1996; Evans 1998). Furthermore, the line widths of HDFX28 compare favorably with those reported for Type II AGN elsewhere in the literature: e.g. km s-1 for the infrared–selected Type II quasar IRAS 091044109 (Kleinmann et al. 1988); km s-1 for the Type II quasar in the Chandra Deep Field South, CDF–S 202 (Norman et al. 2002); and km s-1 for the Type II quasar in the deep Chandra Lynx field, CXO52 (Stern et al. 2002a).
The emission line flux ratios for HDFX28, however, may somewhat weaken the case for classification as a straight Type II source. We tabulate the flux ratios for HDFX28 along with those of two other high–redshift Type II AGNs in Table 2, and we plot the sources in the N V 1240 / He II 1640 vs. N V 1240 / C IV 1549 plane in Figure 5. Both these ratios are comparatively strong in HDFX28, placing it intermediate between models for the narrow emission lines of HzRGs and models for QSO broad–line regions (BLRs), though closer to the QSO BLRs. Moreover, though the location of HDFX28 in Figure 5 compares favorably to that of CDF–S 202, HDFX28 is far stronger in both flux ratios than CXO52. Of course, the N V 1240 emission in CXO52 was noted as exceptionally weak; Stern et al. (2002a) report that its N V 1240 / C IV 1549 ratio is approximately half of what is seen in composite HzRG spectra (e.g. McCarthy 1993; Stern et al. 1999). Nonetheless, the comparative strength of N V 1240 in HDFX28 may point to a classification intermediate between Type I and Type II AGN.
The C IV 1549 / He II 1640 ratio for HDFX28 indicates a similar conclusion. Typical values of C IV 1549 / He II 1640 for unobscured, Type I objects are in composite UV spectra of Seyfert 1 galaxies (Heckman et al. 1995), and 7–50 in composite quasar spectra (Boyle 1990; Francis et al. 1991; Vanden Berk et al. 2001). Typical values for obscured, Type II objects are in composite UV spectra of Seyfert 2 galaxies (Heckman et al. 1995), and in composite spectra of HzRGs (McCarthy 1993; Stern et al. 1999). On this account, HDFX28 is again intermediate between the Type I and Type II sources, though it is worth noting that the other two high–redshift objects in Table 2 somewhat echo this trend, and both are nevertheless classified as Type II AGN. Still, particularly in anticipation of the weak, broad H emission described below (§3.2), we conclude that the optical spectrum of HDFX28 favors classification somewhere on the continuum between Type I and Type II sources, rather than as prototypically Type II.
On a separate note, the Ly line of HDFX28 is exceptionally weak both in equivalent width and in relative flux. For comparison, McCarthy (1993) offers a mean rest–frame equivalent width for HzRGs at of Å, and Stern et al. (1999) give a mean rest–frame equivalent width for 17 HzRGs spanning of Å. Whereas the high–ionization state emission lines of HDFX28 have equivalent widths similar to those reported elsewhere (e.g. – Å for CXO52; Stern et al. 2002a), we find for HDFX28 a meager Å. The weakness of Ly in HDFX28 in relative flux is dramatic both observationally and theoretically. Relative to C IV 1549 and N V 1240, Ly emission in both CDF–S 202 and CXO52 exceeds that in HDFX28 by factors ranging from to 10. Furthermore, Ferland & Osterbrock (1986) predict an unreddened Ly / H ratio of 16 from a model spectrum of a classical Seyfert 2 galaxy. Anticipating our near–infrared results (below), we report a Ly / H ratio for HDFX28 of just .
With towards the HDF–N (Williams et al. 1996), Galactic extinction is unviable as a culprit for the diminished Ly flux in HDFX28. Rather, as has been deduced from weak Ly in several HzRGs (e.g. Eales & Rawlings 1993; Dey et al. 1995), it is likely that dust in HDFX28 is preferentially extinguishing Ly photons. Since Ly is a resonant line, Ly photons are multiply scattered by neutral hydrogen as they traverse the system, resulting in a long path length for dust absorption. Hence, it is possible for Ly emission to become substantially depressed even if there is little dust in the system, so long as there is sufficient neutral hydrogen.
3.2 Results from the Near–Infrared Spectrum
The near–infrared spectrum of HDFX28 shows weak continuum emission and a resolved emission line complex near 1.98 m identified as H plus [N II] Å. As is common in the spectra of Seyfert galaxies, the H emission consists of two components: a strong narrow line superposed upon a weak, broad line (e.g. Osterbrock 1989). We therefore fit the emission complex with four Gaussians subject to the following constraints: (1) the ratio of amplitudes of the [N II] doublet lines must be 2.96:1 as prescribed by the ratio of their Einstein –values, (2) the [N II] lines must have the same redshift as the narrow H component, and (3) the two [N II] lines must have identical FWHMs. Again, we made a Levenberg–Markwardt fit to the spectrum, weighting according to the uncertainty of each pixel. The resulting fit is overlaid on the spectrum in Figure 4, and the corresponding emission line parameters are cataloged along with the results from the optical spectroscopy in Table 1.
Like the optical spectrum discussed above, the near–infrared spectrum indicates a somewhat mixed result for the AGN classification of HDFX28. The widths of the [N II] doublet lines and of the narrow component of the H emission are comparable to the narrow lines of a classic Seyfert 2 (e.g. Osterbrock 1989), and they compare favorably with both the forbidden and permitted optical line widths reported for CXO52 in Stern et al. (2002a). However, these results must be mitigated by the presence of weak, broad H emission. We find a FWHM of km s-1 for this broad H component, and a ratio of broad–to–narrow emission of . For comparison, the broad component to the H emission in HDFX28 is far weaker than that of the HzRG MRC 2025–218 (Larkin et al. 2000), with its H(b) FWHM of km s-1 and broad–to–narrow flux ratio of . Stern et al. (2002a) point out that, though the spectrum of MRC 2025–218 over the range from Ly to [O III] 5007 is very similar to classic obscured, Type II AGN observed by other groups (e.g. Eales & Rawlings 1993, 1996; Evans 1998), the presence of broad H may indicate that MRC 2025–218 is actually the high–luminosity analog to a Seyfert 1.8, rather than a Seyfert 2. In keeping with the results of the optical spectroscopy, the same claim may therefore be made for HDFX28.
One further diagnostic offered by the near–infrared spectrum of HDFX28 is the ratio of its [N II] 6583 flux to its H(n) flux. Veilleux & Osterbrock (1987) and Osterbrock (1989) present a classification scheme employing these and other optical features to discriminate the narrow lines of AGNs from those of starburst galaxies. The physical distinction exploited in this case is the differing strengths of low–ionization lines such as [N II] 6583 in each class of source. In the narrow line region of an AGN, these low–ionization lines arise preferentially in an extended zone of partly photoionized hydrogen which results from an ionizing spectrum containing a large fraction of high–energy photons. These photons are absent in the spectrum of OB stars; hence, the strength of the low–ionization lines is diminished in starburst galaxies (e.g. Baldwin et al. 1981; Veilleux & Osterbrock 1987; Osterbrock 1989). Typically, starbursts and H II region–like galaxies occupy , while AGN occupy With reference to Table 2, we find HDFX28 to fall definitively within the regime of AGNs.
This result is corroborrated by the rest–frame equivalent width of the near–infrared emission complex. Based on an average continuum level of Jy, the total equivalent width of the (H + [N II]) feature is Å. By contrast, surveys of normal (i.e. non–AGN) galaxies find an average width in the range of just 20–30 Å (e.g. Kennicutt & Kent 1983), and surveys of starburst galaxies find only Å (e.g. Ravindranath & Prabhu 2001).
3.3 Results from the Multi–Wavelength Photometry
The aim of the Hubble Space Telescope (HST) observations of the HDF–N was to image an otherwise undistinguished field as deeply as reasonably possible (Williams et al. 1996). Indeed, the HDF–N represents the deepest optical images ever taken, providing detections and photometry of stars and field galaxies to with 01 resolution, and reaching source densities of deg-2 (for a review, see Ferguson et al. 2000). One caveat is that the HST images of the HDF–N are rather small, covering only arcmin2. Hence, to facilitate ground–based follow–up observations, the deep imaging program was augmented with short, 1–2 orbit images of eight fields immediately adjacent to the primary field. These flanking field observations were made exclusively with the WFPC2 filter (Williams et al. 1996, Table 2).
HDFX28 is located 1.6′ west and 1.4′ north of the pointing center of the primary HDF–N in the inner west flanking field. Its optical counterpart gives the impression of a moderately late–type face–on spiral galaxy measuring roughly 16 (14 kpc) in diameter (Figure 1). For their program of associating Infrared Space Observatory (ISO) detections with optical sources in and adjacent to the HDF–N, Mann et al. (1997) constructed an catalog of the flanking fields; they give for HDFX28.
Owing to its location in the HDF–N flanking fields, HDFX28 has been inadvertantly subject to a panoply of follow–up imaging (see Table Optical and Near–Infrared Spectroscopy of a High–Redshift, Hard X–ray Emitting Spiral Galaxy11affiliation: Based on observations made at the W.M. Keck Observatory, which is operated as a scientific partnership among the California Institute of Technology, the University of California and the National Aeronautics and Space Administration. The Observatory was made possible by the generous financial support of the W.M. Keck Foundation.). The galaxy was first reported as a weak radio source (8.15 Jy at 8.5 GHz; 87.8 Jy at 1.4 GHz) in the sensitive radio surveys of Richards et al. (1998) and Richards (2000), respectively. These results yield a comparatively steep radio spectral index (; ), with radio emission extending across 28. In general, microjansky radio emission from disk galaxies can result from either star formation (e.g. from free–free emission originating in H II regions) or from AGN activity connected with a central engine. Richards (2000) argued that (1) in the case of a central AGN powering a weak ( W Hz-1) radio source, the bulk of the radio emission is confined to the nuclear region and is therefore characterized by sub–arcsecond angular scales, and (2) such small scales result in a high opacity to synchrotron self–absorption, yielding flat or inverted spectral indices typically in the range . HDFX28 is indeed a weak radio source, with W Hz-1. Operating under the assumption that HDFX28 has a redshift in the range (as was inferred from the spatial extent of HDFX28 in the flanking field image, and was consistent with the bulk of the microjansky radio sources in deep VLA surveys), Richards (2000) would have estimated even less radio power. Hence, the origin of the radio emission in HDFX28 was taken to be extended star–forming regions.
This conclusion was ostensibly borne out by the ISOCAM detection of HDFX28 (Aussel et al. 1999). If HDFX28 were a starburst galaxy at moderate–to–low redshift, then the ISOCAM 15 m filter (LW3) would sample rest wavelengths from roughly 6 m to 12 m. The mid–infrared emission could therefore be plausibly attributed to the unidentified infrared bands (UIB) and to the hot, 200 K dust which typically dominates the spectral energy distribution of starbursts over those wavelengths (Aussel et al. 1999). Together, the radio and mid–infrared data therefore appeared to paint a coherent picture of HDFX28 as a source with star formation in its disk as its underlying emission mechanism. This conclusion was consistent with the general observation from deep VLA surveys that the bulk of the radio population at the microjansky level consists of starforming disks, with fewer than 20% of the radio sources associated with early–type galaxies or quasars (Fomalont 1996; Richards et al. 1998).
Subsequent ground–based optical and near–infrared imaging found HDFX28 to be comparatively red, falling just short of the conventional definition of EROs (e.g. ; Hornschemeier et al. 2001, and ; Stern et al. 2002b). Hogg et al. (2000) give for HDFX28, and Barger et al. (2000) add . In contrast to the conclusion drawn from the radio and IR imaging discussed above, and in anticipation of the X–ray data discussed below, it is notable that HDFX28 corroborates the trend that X–ray sources at modest band magnitudes tend to be redder than typical field galaxies, and that in the X–ray population there appears to be an excess of sources with (see Hornschemeier et al. 2001, Figure 7). It is yet more notable that Hasinger (1999) reports that all X–ray counterparts with in the ROSAT Ultra Deep HRI Survey are either members of high–redshift clusters or are obscured AGNs.
On that note, the 1 Ms Chandra survey of the HDF–N and its environs yielded a soft X–ray flux of ergs cm-2 s-1 and a hard X–ray flux of ergs cm-2 s-1 for HDFX28 (Brandt et al. 2001). Together with the optical imaging, these results correspond to an X–ray to optical flux ratio444 Hornschemeier et al. (2001) use the Kron–Cousins filter transmission function to derive the X–ray to optical flux ratio: . of in the soft band and in the hard band. As noted by Hornschemeier et al. (2001) and Stern et al. (2002b), the majority of X–ray sources in shallow surveys fall within , as this range is typical of local AGN. In particular, these values compare very favorably to the Type II QSO CDF–S 202 (Norman et al. 2002), with its soft band ratio of and its hard band ratio of .
The X–ray data indicate that HDFX28 is a comparatively hard source. Following the nomenclature of Stern et al. (2002b), the hardness ratio for HDFX28 is , comparing favorably to for the Type II quasar CXO52. Brandt et al. (2001) report an X–ray band ratio for HDFX28 of and a corresponding estimate of the photon index555The photon index is derived from a power law model for the X–ray spectrum: , where is the number of photons s-1 cm-2 keV-1 and is a normalization constant (e.g. Hornschemeier et al. 2001). of . These results show HDFX28 to be distinctly hard for its soft band count rate compared to the total samples in both the Chandra survey of the HDF–N (Brandt et al. 2001) and the Chandra survey of the Lynx field (Stern et al. 2002b). Moreover, this photon index is quite unlike the steep – indices typical of unobscured AGNs (e.g. Nandra & Pounds 1994). By assuming that HDFX28 has an intrinsic power law spectrum with such that the observed band ratio is due to obscuration at the source, and by adopting a Galactic absorption column density in the direction of the HDF–N of cm-2 (Williams et al. 1996), we estimate the hydrogen column density at the source to be cm-2. This value places HDFX28 very near to the median of the sample of 73 nearby Seyfert II galaxies compiled by Bassani et al. (1999), and it implies an unobscured full band rest–frame luminosity of erg s-1, which is well within the quasar regime. In short, each of these results point to significant soft X–ray absorption by intervening material within HDFX28. Hence, as first suggested by Hornschemeier et al. (2001) and as confirmed by the optical and near–infrared spectroscopy presented herein, the X–ray data show HDFX28 to be an obscured, Type II AGN.
4 HDFX28 as a High–Redshift Spiral Galaxy
It is surprising to find identifiable spiral structure at the early time indicated by the redshift of HDFX28. Careful, multi–wavelength morphological studies of the HDF–N reveal no galaxies with any kind of recognizable spiral structure at (Dickinson 2000). To wit, the redshift distribution of a sample of 52 late–type spiral and irregular galaxies complete to shows a dramatic cut–off at , with only two galaxies in the sample exceeding this limit (Rodighiero et al. 2000). Similarly, a combined photometric redshift / morphological data set complete to shows a sharp drop in the spiral galaxy distribution at (Driver et al. 1998). Specifically, in the magnitude bin, there are no spiral galaxies beyond ; in the magnitude bin, there is only one.
Abraham et al. (1994, 1996) cautioned that visual morphological classifications of late–type galaxies fainter than are somewhat subjective, particularly for distant systems with small image sizes. This difficulty is most pernicious for very late spirals (morphological type ), and for merging systems and peculiar galaxies. Nonetheless, especially when combined with the lack of precedent for spiral galaxies at the redshift of HDFX28, this caveat prompted us to bolster our qualitative, visual classification with a quantitative, objective classification.
To this end, we employed a morphological classification scheme devised by Abraham et al. (1996) for analysis of the current generation of large CCD imaging surveys, and modified by Kuchinski et al. (2001) for patchy, low signal–to–noise data. The classification scheme is a two–part system which uses quantitative measurements of the galaxy central concentration and asymmetry to distinguish three morphological bins: E/S0 galaxies, spiral galaxies, and irregular or peculiar systems. The concentration index () is the ratio of the light emitted from a central region of the galaxy (usually , where is the radius of an elliptical aperture centered on the galaxy) to the light emitted from the galaxy as a whole. The asymmetry index () is a measure of the rotational symmetry of the galaxy, measured by rotating the galaxy image about the central pixel and subtracting the rotated image from the original image. In essence, galaxies with high degrees of central concentration and symmetry have regular, ordered appearances, roughly corresponding to early to mid–Hubble types. Galaxies with low central concentration and large asymmetry have irregular or peculiar morphologies, corresponding to late to irregular Hubble types.
We calculated and for HDFX28 using the definitions given by equations (1) and (3) in Kuchinski et al. (2001). It has been shown that these indices are sensitive to the definition of the center of the galaxy image and to the aperture in which the indices are measured (Kuchinski et al. 2001, and references therein). As such, we determined the central pixel by first smoothing the galaxy image with a Gaussian kernel of pixel and then taking the location of the maximum pixel as the galaxy center. We defined the aperture by setting a threshold at and then defining an ellipse based on the intensity–weighted moments of the resulting image. Both these methods have their precedent in a significant body of similar work (e.g. Abraham et al. 1996; Teplitz et al. 1998); we effected the aperture definition with the source extraction software package SExtractor (Bertin & Arnouts 1996). For the concentration index, we found ; for the asymmetry index, we found . As we discuss below, these objective results are indeed consistent with our qualitative classification of HDFX28 as a spiral galaxy.
We estimate the uncertainty in and by considering two independent sources of error: the statistical error due to Poisson noise entering into the calculations (), and the variance introduced by calculating and in apertures extending to different limiting surface brightnesses (). For , the uncertainty due to noise was determined by propagating the Poisson noise per pixel through the calculation in the standard fashion; we found . The uncertainty inherent in using apertures defined to different limiting surface brightnesses was quantified by calculating for 11 apertures of decreasing size determined by running SExtractor with detection thresholds spanning to . The standard deviation of these measurements was . Adding these uncertainties in quadrature yielded our total uncertainty estimate of .
To calculate , the absolute value is taken of the difference between the original image and the rotated image, resulting in sky noise which systematically contributes only positive values. As in Abraham et al. (1996), we corrected for this effect by subtracting from the measured asymmetry of many () blank patches of sky with apertures equal to that enclosing the galaxy. At the same time, we estimated the Poisson error by measuring the distribution of the asymmetry indices of these sky–only apertures. This process yielded . The uncertainty due to using apertures defined by different limits was determined for exactly as it was determined for with the result . Together, these considerations yielded a total estimated error of .
To interpret our results in terms of Hubble types, we compare HDFX28 to two large reference samples for which the concentration and asymmetry indices have been calculated: (1) the Frei et al. (1996) catalog of nearby galaxies artificially redshifted to , 0.5, and 0.7 (Abraham et al. 1996, figure 2), and (2) the catalog of galaxies imaged in the HST Medium Deep Survey (MDS), which are expected to have a redshift distribution spanning with a peak at (Abraham et al. 1996, figures 5 and 6). Our initial impression is that the central concentration index of HDFX28 is very typical of spiral galaxies, but that the asymmetry index straddles the border in between the spirals (low ) and the peculiars (high ). However, as HDFX28 is at a higher redshift than the most distant objects in either of these samples, proper interpretation of its morphological indices requires that we first consider the effects of cosmological distances on morphology.
Three effects complicate the issue of morphology for galaxies at high–redshift: bandshifting, surface brightness dimming, and the loss of spatial resolution. Based on a careful study of in situ ultraviolet and optical imaging of 32 local galaxies, Kuchinski et al. (2001) report that bandshifting is the dominant effect. As such, the general trend is for to decrease and to increase as one proceeds to higher redshifts. Among other effects, at shorter rest wavelengths apparent morphology becomes dominated by localized star formation, thereby diminishing the effect of an optical bulge (if any) on and increasing the patchiness measured by . As for HDFX28, we note that the effect of bandshifting on is less pronounced in later spiral galaxies that lack dominant bulges to begin with; the Sbc–Sd spirals in the Kuchinski et al. (2001) sample show an average move of , where . Hence, we would expect little change in if we were able to observe HDFX28 closer to its rest–frame optical, or if it were located at the modest redshifts of the catalogs described above.
The opposite is true of . Star formation in the disk of a spiral is UV bright, producing large measures of asymmetry in the UV even though the galaxy may appear symmetric in the optical. Kuchinski et al. (2001) found that between UV images and optical images of a galaxy can be as large as (again in the sense of ), though is more typical of later spirals with moderate values of (Kuchinski et al. 2001, figure 4).
As for surface brightness dimming and the loss of spatial resolution, Kuchinski et al. (2001) report that is in most cases robust to both effects out to (), while the effect on is simply to increase its scatter (). Consequently, while we interpret bandshifting as resulting in a systematic shift in and , we interpret the scatter introduced by surface brightness dimming and the loss of spatial resolution as an increase in their error bars. Hence, the morphological –correction necessary to properly compare HDFX28 to the artificially redshifted Frei catalog and to the galaxies of the MDS amounts to an increase of in concentration index to , with a corresponding increase in error bar to . Similarly, the asymmetry index must be shifted down by to , with a corresponding increase in error bar to . Once applied, these consideration show HDFX28 to fall definitively within the spiral galaxies in the – distribution of both samples (Abraham et al. 1996). Therefore, we judge the morphology of HDFX28 to be consistent with that of a rare, high–redshift spiral.
The inapplicability of the classical Hubble tuning fork to the galaxy population at has been well–documented, and recent morphological studies have shown the dearth of spirals at high redshift to be a genuine change in the galaxy population — not merely a function cosmological distance effects on morphological classification (e.g. van den Bergh et al. 2002). Possible scenarios posited to explain this effect include the destruction of early–time disks from without by mergers or from within by strong, starburst–driven galactic winds, or perhaps stellar feedback in early disks suppresses the cooling of gas before , preventing global dynamical instabilities from initiating the formation of spiral structure (van den Bergh 2002). In any case, this single detection of an object at a redshift for which spirals are not expected is certainly not a challenge to widely–accepted hierarchical evolutionary scenarios, which have otherwise been successful at predicting the results of deep galaxy surveys (e.g. Kauffmann et al. 1993; Baugh et al. 1998). It may be the case that HDFX28 is simply a rare example of an early–time disk which escaped destruction, for instance, by a merger event.
5 Conclusion
We have reported on two aspects of the high–redshift, hard X–ray emitting spiral galaxy HDFX28: (1) its classification as a Type II AGN, a population recently attracting renewed interest due to deep X–ray surveys, and for which few HST images are available, and (2) its unprecedented redshift for a galaxy with spiral morphology. As for HDFX28 as a Type II AGN, the canonical wisdom regarding weak, extended radio sources with spectral indices steeper than dictates that such sources are driven by star formation. Nonetheless, the combined weight of evidence from X–ray, optical, and near–infrared observations of HDFX28 indicates the presence of obscured AGN activity. It is instructive to note that when re–interpreted in light of the spectroscopic redshift, even the mid–infrared data for HDFX28 corroborates this result. At , the ISOCAM LW3 filter samples rest wavelengths spanning only 4 m to 5 m. Here, the contribution to the mid–IR spectral energy distribution made by UIB emission and by dust at 200 K is severely attenuated (see Aussel et al. 1999, Figure 1). Hence, the ISOCAM detection of this source is far more plausibly explained by the hot, K dust found in the central region of an AGN (e.g. see Aussel et al. 1998) than it is by star formation alone.
As to the precise nature of the central engine in HDFX28, we conclude from the comparatively narrow emission lines in the spectroscopy and from the heavy obscuration evident in the X–ray data that HDFX28 is far more like an obscured Type II system than an unobscured Type I system. Though this conclusion is slightly at odds with the presence of weak, broad H emission, all remaining aspects of the source are entirely consonant with observations of other Type II AGN at moderate–to–high redshifts (e.g. Kleinmann et al. 1988; Norman et al. 2002; Stern et al. 2002a) and with HzRGs (e.g. Larkin et al. 2000; McCarthy 1993; Stern et al. 1999; Vernet et al. 2001). Norman et al. (2002) describe a very similar situation in which their source CDF–S 202 shows both the narrow ( km s-1) emission lines in its optical spectrum and the heavy obscuration in its X–ray emission typical of a Type II system, but also shows emission line flux ratios intermediate between Type I and Type II systems. As noted by Stern et al. (2002a), it is conceivable that longer–wavelength spectra of CDF–S 202 and other sources like it would also reveal broad H, though they in every other way give evidence of the heavy obscuration considered to be emblematic of Type II AGN.
Separately, the spectroscopy presented herein shows HDFX28 to be at an unprecedented redshift for a galaxy with identifiably spiral structure. Nevertheless, with the application of a modest morphological –correction, our quantitative analysis of its central concentration and asymmetry is consistent with the interpretation that HDFX28 is a rare example of a high–redshift spiral galaxy. Owing to its proximity to the HDF–N, HDFX28 will be subject to deep, space–based , , , and imaging with the Advanced Camera for Surveys as part of the upcoming GOODS HST Treasury Program (M. Giavalisco, PI), as well as to infrared imaging at m with the Infrared Array Camera as part of the GOODS SIRTF Legacy project (M. Dickinson, PI). At a minimum, the availability of multi–wavelength imaging will provide a powerful additional lever arm on the issue of the morphology of HDFX28 (e.g. Conselice 1997; Conselice et al. 2000). As such, we eagerly look forward to these expansive datasets.
References
- Abraham et al. (1994) Abraham, R. G., Valdes, F., Yee, H. K. C., & van den Bergh, S. 1994, ApJ, 432, 75
- Abraham et al. (1996) Abraham, R. G., van den Bergh, S., Glazebrook, K., Ellis, R. S., Santiago, B. X., Surma, P., & Griffiths, R. E. 1996, ApJS, 107, 1
- Alexander et al. (2001) Alexander, D. M., Brandt, W. N., Hornschemeier, A. E., Garmire, G. P., Schneider, D. P., Bauer, F. E., & Griffiths, R. E. 2001, AJ, 122, 2156
- Alexander et al. (2002) Alexander, D. M., Vignali, C., Bauer, F. E., Brandt, W. N., Hornschemeier, A. E., Garmire, G. P., & Schneider, D. P. 2002, AJ, 123, 1149
- Antonucci (1993) Antonucci, R. 1993, ARA&A, 31, 473
- Aussel et al. (1999) Aussel, H., Cesarsky, C. J., Elbaz, D., & Starck, J. L. 1999, A&A, 342, 313
- Aussel et al. (1998) Aussel, H., Gerin, M., Boulanger, F., Desert, F. X., Casoli, F., Cutri, R. M., & Signore, M. 1998, A&A, 334, L73
- Baldwin et al. (1981) Baldwin, J. A., Phillips, M. M., & Terlevich, R. 1981, PASP, 93, 5
- Barger et al. (2002) Barger, A. J., Cowie, L. L., Brandt, W. N., Capak, P., Garmire, G. P., Hornschemeier, A. E., Steffen, A. T., & Wehner, E. H 2002, AJ, 124, 1886
- Barger et al. (2000) Barger, A. J., Cowie, L. L., & Richards, E. A. 2000, AJ, 119, 2092
- Barger et al. (1999) Barger, A. J., Cowie, L. L., Trentham, N., Fulton, E., Hu, E. M., Songaila, A., & Hall, D. 1999, AJ, 117, 102
- Bassani et al. (1999) Bassani, L., Dadina, M., Maiolino, R., Salvati, M., Risaliti, G., della Ceca, R., Matt, G., & Zamorani, G. 1999, ApJS, 121, 473
- Baugh et al. (1998) Baugh, C. M., Cole, S., Frenk, C. S., & Lacey, C. G. 1998, ApJ, 498, 504
- Bertin & Arnouts (1996) Bertin, E. & Arnouts, S. 1996, A&AS, 117, 393
- Boyle (1990) Boyle, B. J. 1990, MNRAS, 243, 231
- Brandt et al. (2001) Brandt, W. N. et al. 2001, AJ, 122, 2810
- Conselice (1997) Conselice, C. J. 1997, PASP, 109, 1251
- Conselice et al. (2000) Conselice, C. J., Bershady, M. A., & Jangren, A. 2000, ApJ, 529, 886
- Dawson et al. (2001) Dawson, S., Stern, D., Bunker, A. J., Spinrad, H., & Dey, A. 2001, AJ, 122, 598
- Dey et al. (1995) Dey, A., Spinrad, H., & Dickinson, M. 1995, ApJ, 440, 515
- Dickinson (2000) Dickinson, M. 2000, Philos. Trans. R. Soc. London, A, 358, 2001 (astro–ph/0004028)
- Dickinson & Giavalisco (2002) Dickinson, M. & Giavalisco, M. 2002, to appear in the proceedings of the ESO/USM Workshop “The Mass of Galaxies at Low and High Redshift” (Venice, Italy, October 2001), eds. R. Bender and A. Renzini (astro–ph/0204213)
- Driver et al. (1998) Driver, S. P., Fernandez-Soto, A., Couch, W. J., Odewahn, S. C., Windhorst, R. A., Phillips, S., Lanzetta, K., & Yahil, A. 1998, ApJ, 496, L93
- Eales & Rawlings (1993) Eales, S. A. & Rawlings, S. 1993, ApJ, 411, 67
- Eales & Rawlings (1996) —. 1996, ApJ, 460, 68
- Elston et al. (1988) Elston, R., Rieke, G. H., & Rieke, M. J. 1988, ApJ, 331, L77
- Elston et al. (1989) Elston, R., Rieke, M. J., & Rieke, G. H. 1989, ApJ, 341, 80
- Evans (1998) Evans, A. S. 1998, ApJ, 498, 553
- Ferguson et al. (2000) Ferguson, H. C., Dickinson, M., & Williams, R. 2000, ARA&A, 38, 667
- Ferland & Osterbrock (1986) Ferland, G. J. & Osterbrock, D. E. 1986, ApJ, 300, 658
- Fomalont (1996) Fomalont, E. B. 1996, in IAU Symp. 175: Extragalactic Radio Sources, ed. R. D. Ekers, C. Fanti, & L. Padrielli (New York: Kluwer Academic Publishers), 555
- Francis et al. (1991) Francis, P. J., Hewett, P. C., Foltz, C. B., Chaffee, F. H., Weymann, R. J., & Morris, S. L. 1991, ApJ, 373, 465
- Frei et al. (1996) Frei, Z., Guhathakurta, P., Gunn, J. E., & Tyson, J. A. 1996, AJ, 111, 174
- Giacconi et al. (2001) Giacconi, R. et al. 2001, ApJ, 551, 624
- Giacconi et al. (2002) Giacconi, R. et al. 2002, ApJS, 139, 369
- Graham & Dey (1996) Graham, J. R. & Dey, A. 1996, ApJ, 471, 720
- Hamann & Ferland (1993) Hamann, F. & Ferland, G. 1993, ApJ, 418, 11
- Hasinger (1999) Hasinger, G. 1999, in MPR Rep. 272, Highlights in X–ray Astronomy, ed. B. Aschenbach & M. Freyberg (Garching: Max–Planck Institute fur extraterretrische Physik), 199
- Hasinger et al. (1998) Hasinger, G., Burg, R., Giacconi, R., Schmidt, M., Trumper, J., & Zamorani, G. 1998, A&A, 329, 482
- Heckman et al. (1995) Heckman, T., Krolik, J., Meurer, G., Calzetti, D., Kinney, A., Koratkar, A., Leitherer, C., Robert, C., & Wilson, A. 1995, ApJ, 452, 549
- Hogg et al. (2000) Hogg, D. W. et al. 2000, ApJS, 127, 1
- Horne (1986) Horne, K. 1986, PASP, 98, 609
- Hornschemeier et al. (2001) Hornschemeier, A. E. et al. 2001, ApJ, 554, 742
- Hu & Ridgway (1994) Hu, E. M. & Ridgway, S. E. 1994, AJ, 107, 1303
- Kauffmann et al. (1993) Kauffmann, G., White, S. D. M., & Guiderdoni, B. 1993, MNRAS, 264, 201
- Kennicutt & Kent (1983) Kennicutt, R. C. & Kent, S. M. 1983, AJ, 88, 1094
- Kleinmann et al. (1988) Kleinmann, S. G., Hamilton, D., Keel, W. C., Wynn-Williams, C. G., Eales, S. A., Becklin, E. E., & Kuntz, K. D. 1988, ApJ, 328, 161
- Kuchinski et al. (2001) Kuchinski, L. E., Madore, B. F., Freedman, W. L., & Trewhella, M. 2001, AJ, 122, 729
- Larkin et al. (2000) Larkin, J. E., McLean, I. S., Graham, J. R., Becklin, E. E., Figer, D. F., Gilbert, A. M., Levenson, N. A., Teplitz, H. I., Wilcox, M. K., & Glassman, T. M. 2000, ApJ, 533, L61
- Levenson et al. (2001) Levenson, N. A., Fernandes, R. C. J., Weaver, K. A., Heckman, T. M., & Storchi–Bergmann, T. 2001, ApJ, 557, 54
- Liu et al. (2000) Liu, M. C., Dey, A., Graham, J. R., Bundy, K. A., Steidel, C. C., Adelberger, K., & Dickinson, M. E. 2000, AJ, 119, 2556
- Mann et al. (1997) Mann, R. G. et al. 1997, MNRAS, 289, 482
- Massey & Gronwall (1990) Massey, P. & Gronwall, C. 1990, ApJ, 358, 344
- McCarthy et al. (1998) McCarthy, J. K. et al. 1998, in Proc. SPIE Vol. 3355, Optical Astronomical Instrumentation, ed. S. D’Odorico (Bellingham: SPIE), 81
- McCarthy (1993) McCarthy, P. J. 1993, ARA&A, 31, 639
- McLean et al. (1998) McLean, I. S. et al. 1998, in Proc. SPIE Vol. 3354, Infrared Astronomical Instrumentation, ed. A. M. Fowler (Bellingham: SPIE), 566
- Moran et al. (1996) Moran, E. C., Halpern, J. P., & Helfand, D. J. 1996, ApJS, 106, 341
- Moran et al. (2001) Moran, E. C., Kay, L. E., Davis, M., Filippenko, A. V., & Barth, A. J. 2001, ApJ, 556, L75
- Nandra & Pounds (1994) Nandra, K. & Pounds, K. A. 1994, MNRAS, 268, 405
- Norman et al. (2002) Norman, C., Hasinger, G., Giacconi, R., Gilli, R., Kewley, L., Nonino, M., Rosati, P., Szokoly, G., Tozzi, P., Wang, J., Zheng, W., Zirm, A., Bergeron, J., Gilmozzi, R., Grogin, N., Koekemoer, A., & Schreier, E. 2002, ApJ, 571, 218
- Oke et al. (1995) Oke, J. B. et al. 1995, PASP, 107, 375
- Osterbrock (1989) Osterbrock, D. E. 1989, The Astrophysics of Gaseous Nebulae and Active Galactic Nuclei (Mill Valley: University Science)
- Pavlovsky et al. (2001) Pavlovsky, C. et al. 2001, “ACS Instrument Handbook”, Version 2.1, (Baltimore: STScI)
- Ravindranath & Prabhu (2001) Ravindranath, S. & Prabhu, T. P. 2001, Ap&SS, 276, 593
- Richards (2000) Richards, E. A. 2000, ApJ, 533, 611
- Richards et al. (1998) Richards, E. A., Kellermann, K. I., Fomalont, E. B., Windhorst, R. A., & Partridge, R. B. 1998, AJ, 116, 1039
- Riess et al. (2001) Riess, A. G. et al. 2001, ApJ, 560, 49
- Rodighiero et al. (2000) Rodighiero, G., Granato, G. L., Franceschini, A., Fasano, G., & Silva, L. 2000, A&A, 364, 517
- Rosati et al. (2002) Rosati, P. et al. 2002, ApJ, 556, 667
- Schreier et al. (2001) Schreier, E. J. et al. 2001, ApJ, 560, 127
- Stern et al. (1999) Stern, D., Dey, A., Spinrad, H., Maxfield, L., Dickinson, M., Schlegel, D., & González, R. A. 1999, AJ, 117, 1122
- Stern et al. (2002a) Stern, D. et al. 2002a, ApJ, 568, 71
- Stern et al. (2002b) —. 2002b, AJ, 123, 2223
- Teplitz et al. (1998) Teplitz, H. I., Gardner, J. P., Malumuth, E. M., & Heap, S. R. 1998, ApJ, 507, L17
- Tody (1993) Tody, D. 1993, in ASP Conf. Ser. 52, Astronomical Data Analysis Software and Systems II, ed. R. Hanisch, R. Brissenden, & J. Barnes (San Francisco: ASP), 173
- van den Bergh (2002) van den Bergh, S. 2002, PASP, 114, 797
- van den Bergh et al. (2002) van den Bergh, S., Abraham, R. G., Whyte, L. F., Merrifield, M. R., Eskridge, P. B., Frogel, J. A., & Pogge, R. 2002, AJ, 123, 2913
- Vanden Berk et al. (2001) Vanden Berk, D. E. et al. 2001, AJ, 122, 549
- Veilleux & Osterbrock (1987) Veilleux, S. & Osterbrock, D. E. 1987, ApJS, 63, 295
- Vernet et al. (2001) Vernet, J., Fosbury, R. A. E., Villar-Martín, M., Cohen, M. H., Cimatti, A., di Serego Alighieri, S., & Goodrich, R. W. 2001, A&A, 366, 7
- Williams et al. (1996) Williams, R. E. et al. 1996, AJ, 112, 1335


| Line | Redshift | Flux | FWHM††The line widths have been deconvolved according to the relation , where FWHM(obs) is the observed line width, FWHM(instr) is the instrumental resolution, and FWHM(inher) is the inherent line width. | Comment | ||
|---|---|---|---|---|---|---|
| (Å) | ( ergs cm-2 s-1) | (km s-1) | (Å) | |||
| Ly | LRIS–B | |||||
| N V 1240 | LRIS–B | |||||
| C IV 1549 | LRIS–B | |||||
| He II 1640 | LRIS–B | |||||
| C III] 1909 | LRIS–B | |||||
| [Ne IV] 2424 | LRIS–R | |||||
| [N II] 6548 | NIRSPEC | |||||
| H(n) | NIRSPEC | |||||
| H(b) | NIRSPEC | |||||
| [N II] 6583 | NIRSPEC |
Note. — The uncertainties quoted in this table are dominated by four sources of error: the statistical error due to Poisson noise in the spectrum, the readnoise due to the detector, a systematic error introduced by sky subtraction during the data processing, and the uncertainties derived for the fit parameters. All of these errors are easily characterized except for the systematic error introduced by sky subtraction. Consequently, we assumed that this additional error is at least as large as the statistical error, and we added it in quadrature to form the total uncertainty.
| Diagnostic | Flux Ratio | ||
|---|---|---|---|
| HDFX28 | CDF–S 20211Source: Norman et al. (2002). | CXO5222Source: Stern et al. (2002a). | |
| Ly / C IV 1549 | 1.66 | ||
| Ly / H(n) | |||
| N V 1240 / Ly | 0.36 | 0.03: | |
| N V 1240 / C IV 1549 | 0.60 | 0.2: | |
| N V 1240 / He II 1640 | 2.11 | 0.4: | |
| C IV 1549 / He II 1640 | 3.54 | ||
| [N II] 6583 / H(n) | |||
| Observed | Rest frame | Observed | Flux Density | Detector/ | Reference |
|---|---|---|---|---|---|
| Bandpass | Central | Magnitude††All magnitudes are normalized to Vega, except the magnitude, which is AB. The conversion between Vega–based –band magnitudes and is . | (Jy) | Instrument | |
| 2–8 keV | 18.1 keV | ‡‡X–ray flux densities were estimated from the Chandra/ACIS hard and soft band fluxes by assuming an X–ray spectral index of (where ), based on the hardness ratio described in § 3.3. | Chandra/ACIS | 1 | |
| 0.5–2 keV | 3.8 keV | ‡‡X–ray flux densities were estimated from the Chandra/ACIS hard and soft band fluxes by assuming an X–ray spectral index of (where ), based on the hardness ratio described in § 3.3. | Chandra/ACIS | 1 | |
| Harris | 1200 Å | 24.40 | 0.33 | KPNO 4m/MOSAIC | 2 |
| 1450 Å | 24.05 | 1.02 | Keck/LRIS | 3 | |
| 1600 Å | 24.37 | 0.69 | Palomar 200–inch/COSMIC | 4 | |
| Kron–Cousins | 1830 Å | 23.89 | 1.01 | CFHT/Hawaii 8K CCD Mosaic | 5 |
| Kron–Cousins | 2160 Å | 23.5 | 1.2 | Keck/LRIS | 3 |
| 2300 Å | 23.75 | 0.87 | Palomar 200–inch/COSMIC | 4 | |
| Kron–Cousins | 2660 Å | 22.9 | 1.8 | CFHT/Hawaii 8K CCD Mosaic | 3 |
| (AB) | 2700 Å | 23.46 | 1.43 | HST/WFPC2 | 6 |
| 5980 Å | 19.3 | 9.7 | UH 2.2m/QUIRC | 5 | |
| 7140 Å | 19.01 | 17.62 | Palomar 200–inch/COSMIC | 4 | |
| 15 m | 5.0 m | 441 | ISO/ISOCAM | 7 | |
| 8.5 GHz | 25.6 GHz | 8.15 | VLA | 8 | |
| 1.4 GHz | 4.2 GHz | 87.8 | VLA | 9 |