THE FORMATION OF THE SEYFERT X-RAY CONTINUUM
1 Introduction and generalities
1.1 The UV-X- spectrum of Seyfert galaxies
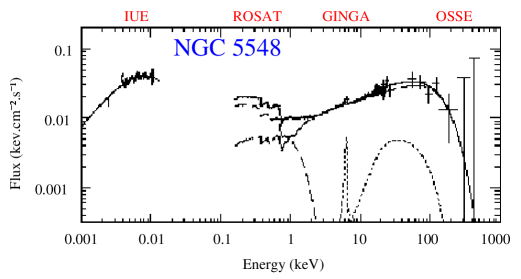
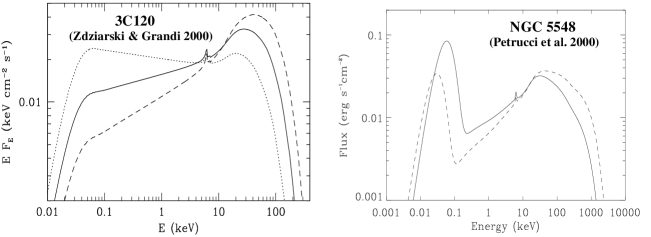
The typical broad band UV-X- ray spectrum of a Seyfert galaxy, here NGC 5548 has been reported in Fig. 1 This spectrum has been obtained from quasi simultaneous observations of different satellites indicated on the Figure . We clearly see different components:
-
•
A strong emission in the UV, the UV bump, generally interpreted as the thermal emission of an accretion disc.
-
•
A strong emission in the X-ray band which can be generally fitted by a cut-off power law shape with a power law photon index and a cut-off energy near 200-300 keV
-
•
A neutral fluorescence FeKα line near 6.4 keV
-
•
A bump peaking near 30 keV
-
•
A soft component below 2 keV, in excess to the extrapolation of the high energy power law, called the soft excess
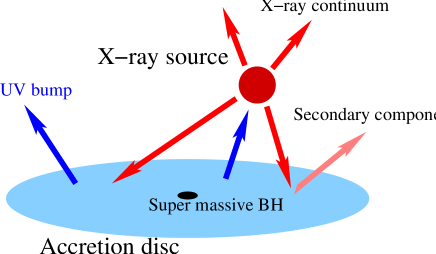
These different components are generally interpreted in the reprocessing/upscattering model framework. The scheme of this model is reported in Fig. 2. It supposes the presence of 2 phases, a cold one, the accretion disc, which produces the UV emission, and a hot one, the corona, a plasma of energetic particles, supposed to radiate X-rays by Compton upscattering the UV photons coming from the disc. Inversely, part of the X-ray emission of the corona is absorbed by the cold material and reprocessed in X-ray. Finally, part of the X-ray emission ( 10%) is Compton reflected on the disc surface and give birth to the fluorescent Iron line and the reflection bump. The origin of the soft excess is still unclear, it may be the hard tail of the disc emission.
The nature of the high energy source(s), the geometry of the disc-corona configuration and the origin of the variability, which is important in Seyfert galaxies, are still unknown. The presence of a high energy cut-off in most of the Seyfert (Matt 2000) and the lack of any annihilation line have favored a thermal nature for the corona even if it does not rule out the non-thermal hypothesis . Recent results on spectral variability (cf. section 3) appear to be more conclusive in agreement with the thermal interpretation. We will thus focus below on the thermal solution.
1.2 The thermal Comptonization spectrum
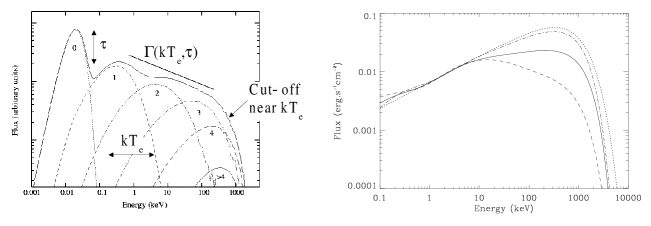
As said previously, the X-ray emission in Seyfert is believed to be produce by Compton process of UV seed photons on a thermal population of electrons. For a given geometry, the thermal Comptonization spectral shape depends on few parameters i.e. the temperature and optical depth of the corona, and , and the temperature of the soft photon field .
It generally has a cut-off power law shape (cf. Fig. 3a) and it is often approximate by a spectral function of the type . This may be however a very crude approximation especially in the case of anisotropic geometries. Indeed, the Compton process is relatively sensible to the anisotropy of the seed photon field and the X-ray emission may also be strongly anisotropic. In the case of a slab geometry for example, the X-ray photons of the first Compton scattering order are preferentially emitted backward toward the disk than toward the observer. It thus produces a break (the anisotropy break) in the observed X-ray spectrum as shown in Fig. 3b. In this case, the use of a cut-off power-law shape may lead to erroneous parameter values and to wrong physical interpretations .
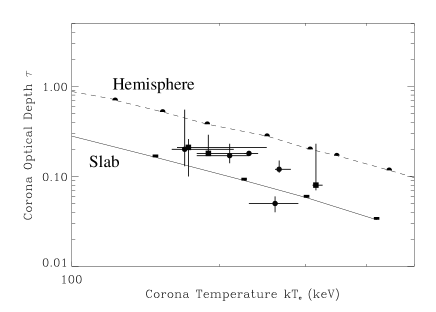
It is interesting to note that in the case of radiative equilibrium between the UV (i.e. the cooling) and the X-ray (i.e. the heating) sources, the temperature and optical depth of the corona follow an univocal relationship, which depends however on the geometry of the disc-corona configuration . This relationship roughly corresponds to a constant Compton parameter .
2 Geometry of the corona
Geometries more “photon-starved” than the simple slab corona are clearly required by the data .
Fitting BeppoSAX observations of a sample of Seyfert galaxies with a realistic Comptonization model in slab geometry, we were able to constrain the temperature and optical depth of the corona. The corresponding values have been reported in Fig. 4 together with the theoretical relationship expected in the case of a slab (solid line) and hemispherical (dashed line) geometry in radiative equilibrium (cf. Sect. 1.2). The data points tend to fall preferentially in between the two line, indicating that the real configuration is more complex than these two ideal case.
3 High energy variability
3.1 Long time scale variability
There is growing observational evidence, at least on long (i.e. ) time scale, that the X-ray spectrum of Seyfert softens (i.e. the photon index increases) as the 2-10 keV flux increases . We also generally observed larger amplitude variability in the soft X-ray band than in the hard X-ray band . These different results indicate that the continuum is mainly pivoting at high energy as indeed observed in some cases (cf. Fig. 5).
This support the idea that the X-ray spectral variability (at least on long time scale) is most likely due to a change of the cooling i.e. the X-ray spectral variability is driven by the UV seed photons, as expected in the upscattering model interpretation.
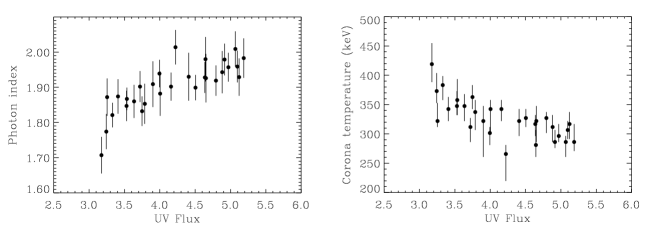
Recent results from the analysis of the IUE/XTE observation of NGC 7469 strongly agree with this conclusion. NGC 7469 has indeed been observed simultaneously by these 2 satellites during 30 days. Nandra et al. (2000), fitting the XTE data with a simple power law for the continuum, found a clear correlation between and the UV flux (cf. Fig. 6). A re-analyze of these data with a realistic Comptonization model shows that the increase of the UV flux goes with a decrease of the corona temperature (cf. Fig. 6), supporting a thermal nature for the corona.
3.2 Short time scale variability
The rapid variations of the X-ray flux (on time scale of a few hours or less) are generally not present in UV (cf e.g. Nandra et al. 1998 in the case of NGC 7469). This clearly indicates that there is an X-ray variability process distinct from the one occuring on longer time scale. If on the latter case, the variability precursor appears to be the UV source, on smaller time scale it has certainly something to do with the process that heats the corona, for instance reconnection instability in a magnetically dominated corona .
Nandra & Papadakis (2001) have recently shown that the power density spectrum (hereafter PSD) of NGC 7469 hardens for higher energy, i.e. the slope of the PSD computed in the 2-4 keV band was larger than the one in the 10-15 keV band. Moreover these differences between the PSD are in the sense that the high frequency ( Hz) power spectrum shows more power at high energies (the opposite is true however at low frequency in agreement with the upscattering model expectations when the seed photon source is variable). This result also indicates that there is a mechanism unrelated to the seed photons that dominates variability on small time scale. As already proposed above, the corona may consist of magnetic flares. The hardening of the PSD could then be explained by the presence of hotter flares in the inner regions of the disc since they would mainly account for the high-energy photons and be also more rapidly variable due to their smaller size scale.
4 Variability and correlation with spectral properties between objects
In general, more luminous objects are less variable in X-ray and this effect is even stronger for smaller time scale . It indicates that the variability characteristics between objects differ mainly by their time scale rather than by their amplitude. A natural way to explain this behavior would be that more luminous object have larger black hole mass that is larger length scale and thus less rapid variability.
However, some type of Seyfert galaxies, the Narrow Line Seyfert, show, for a given luminosity, a larger variability than a standard Seyfert galaxy . According to our previous remark, the larger variability of these objects suggests that they possess a central black hole with a relatively small mass. Consequently, they have to possess a larger accretion rate to explain their luminosity.
This thus suggest that Seyferts follow a classification in the sense that the Broad line Seyferts may have small and the Narrow line Seyferts may have large . Many of the details are unclear however. For instance, the more variable objects have in general a softer spectra which clearly show that the Comptonizing corona have different physical characteristics between objects.
5 Corona formation
Different models have tried to explain the formation of the corona and to reproduce the observations and the different correlation described above. The corona may then be produced by disk evaporation and/or particles may be accelerated trough magnetic reconnection like in the solar corona . Such models manage to reproduce the main characteristics of the high energy emission discussed above like the correlation between and the X-ray flux, the temperature gradient in the inner regions of the corona, and the dependence of the spectral properties with from the existence or not (depending on ) of a radiation pressure dominated area in the central region of the accretion disk. For more details the reader can refer to the references given above.
Acknowledgments
I would like to thanks the organizing comitee for having invited me to present this talk and for the great interest of this meeting.
References
References
- [1] Bianchi, S. et al. 2001, A&A, 376, 77
- [2] Boller, T., Brandt, W. N., & Fink, H. 1996, A&A, 305, 53
- [3] De Rosa, A. et al. A&A, 387, 838
- [4] Di Matteo, T. 1998, MNRAS, 299, L15
- [5] Georgantopoulos, I. & Papadakis, I. E. 2001, MNRAS, 322, 218
- [6] Green, A. R., McHardy, I. M., & Lehto, H. J. 1993, MNRAS, 265, 664
- [7] Haardt, F. & Maraschi, L. 1993, ApJ, 413, 507
- [8] Haardt, F. 1994, PhD dissertation, SISSA, Trieste (H94)
- [9] Lamer, G., Uttley, P., & McHardy, I. M. 2000, MNRAS, 319, 949
- [10] Lee, J. C. et al. 1999, MNRAS, 310, 973
- [11] Leighly, K. M. 1999, ApJS, 125, 297
- [12] Liu, B. F. et al. 2002, ApJ, 575, 117
- [13] Magdziarz, P. et al. 1998, MNRAS, 301, 179
- [14] Markowitz, A. & Edelson, R. 2001, ApJ, 547, 684
- [15] Matt, G., Proceeding of the conference “X-ray Astronomy ’999. Stellar Endpoints, AGN and the Diffuse Background”, September 6-10, Bologna, Italy. To appear in Astrophysical Letters and Communications
- [16] Meyer, F., Liu, B. F., & Meyer-Hofmeister, E. 2000, A&A, 361, 175
- [17] Merloni, A. & Fabian, A. C. 2001, MNRAS, 321, 549
- [18] Merloni, A. & Fabian, A. C. 2002, MNRAS, 332, 165
- [19] Nandra, K. & Pounds, K. A. 1994, MNRAS, 268, 405
- [20] Nandra, K. et al. 1997, ApJ, 477, 602
- [21] Nandra, K. & Papadakis, I. E. 2001, ApJ, 554, 710
- [22] Nandra, K. et al. 1998, ApJ, 505, 594
- [23] Nandra, K. et al. 2000, ApJ, 544, 734
- [24] Page, K. L. et al. 2002, MNRAS, 330, L1
- [25] Perola, G. C. et al. 1986, ApJ, 306, 508
- [26] Perola, G. C. et al. 2002, A&A, 389, 802
- [27] Petrucci, P. O. et al. 2000, ApJ, 540, 131
- [28] Petrucci, P. O., Henri, G., & Pelletier, G. 2001, A&A, 374, 719
- [29] Petrucci, P. O. et al. 2002, A&A,
- [30] Pounds, K. A. et al. 1990, Nature, 344, 132
- [31] Pounds, K. A., Done, C., & Osborne, J. P. 1995, MNRAS, 277, L5
- [32] Stern, B. E. et al. 1995, ApJL, 449, L13
- [33] Turner, T. J. & Pounds, K. A. 1989, MNRAS, 240, 833
- [34] Turner, T. J. et al. 1999, ApJ, 524, 667
- [35] Vaughan, S. & Edelson, R. 2001, ApJ, 548, 694
- [36] Yaqoob, T. et al. 1993, MNRAS, 262, 435
- [37] Zdziarski, A. A. & Grandi, P. 2001, ApJ, 551, 186