Origin of the 6.85 m Band near Young Stellar Objects: The Ammonium Ion () Revisited ††thanks: Based on observations with ISO, an ESA project with instruments funded by ESA Member States (especially the PI countries: France, Germany, the Netherlands and the United Kingdom) and with the participation of ISAS and NASA
We have investigated whether the feature of is a viable candidate for the 6.85 m absorption band seen towards embedded young stellar objects. To produce astrophysical ice analogs consisting of , , and were UV photolysed. The IR spectra reveal peaks that are identified with the NH, NO, NO and HCO ions. It is shown that the matches two absorption features that are observed towards embedded young stellar objects, i.e., the strong 6.85 m feature and the 3.26 m feature. The characteristic redshift with temperature of the interstellar 6.85 m feature is well reproduced. The abundance of in interstellar ices would be typically 10 % relative to . The experiments show that the counterions produce little distinct spectral signature but rather a pseudo-continuum if a variety of them is present in a dominated environment. The anions could therefore go undetected in IR spectra of interstellar ice. In the ISM, where additional mechanisms such as surface chemistry and additional elements such as sulfur are available many acids and an even wider variety of anions could be produced. These components may be detectable once the ices sublime, e.g, in hot cores.
Key Words.:
Methods: laboratory – Stars: individual: W33A – Stars: individual: MonR2:IRS3 –ISM: abundances – ISM: molecules – Infrared: ISM: lines and bands1 Introduction
The nature of the 6.85 m absorption feature towards embedded Young Stellar Objects (YSO’s) has remained an enigma since its discovery 25 years ago (Russell et al. 1977). While the first high resolution observations of this band were recently obtained by the Short Wavelength Spectrometer (SWS) on board the Infrared Space Observatory (ISO; Schutte et al. 1996, Dartois et al. 1999a; Keane et al. 2001), this did not yet help to clarify its origin. A number of candidates, such as carbonates, and the CH deformation modes in organic molecules like methanol, could be excluded based on the feature’s spectral properties and the absence of strong additional bands. One possibility, however, the mode of the ammonium ion (), first proposed by Grim et al. (1989b), could not be excluded. is produced in astrophysical ice analogs by acid-base reactions. This is achieved either by deposition and warm-up of together with acids such as HNCO or HCOOH (Novozamsky et al. 2001, Schutte et al. 1999), or by photolysis of ice mixtures containing (e.g., /; Grim et al. 1989a) where the acids are produced by the photochemistry. Recently, the good spectral correspondence between the feature of and the interstellar 6.85 m absorption as seen by ISO/SWS was again demonstrated (Demyk et al. 1998). Nevertheless, this assignment faces a fundamental problem, since it requires a large abundance of of 10 % in the ices near YSO’s. An equal amount of negative charge would need to be present. Although the ions (also referred to as NCO- in the chemistry literature) and (probably) have been identified, their abundance falls far short of what is needed for the balance (Schutte et al. 1996a; Gibb et al. 2000; Keane et al. 2001; 2002). No sign of other negative solid state species has shown up in the ISO data.
This paper revisits the possibility that is responsible for the interstellar 6.85 m band. We investigate in the laboratory whether a variety of anions can supply the required countercharge, and that such a combination of species is either lacking in outstanding IR features, or fall below current detection limits. Taking the cosmic abundances of the elements into consideration, the counterions would have to consist of H, O, C, N and S in order to make a significant contribution. If we furthermore constrain the acid precursors to species with at most 1 carbon atom, possibilities would still include a variety of thermodynamically stable species, i.e., OH-, CN-, OCN-, HCOO-, , , NO, NO, , HSO, and . In principle an astrophysical ice analog containing and a mixture of such negative ions could be prepared by depositing together with a variety of acids. However, experimental limitations compel us to produce the ions in situ with UV photolysis. To this end, we processed mixtures of // / to produce acids such as (carbonic acid), (nitric acid) and (nitrous acid). These acids react with forming and a mixture of counterions, as desired. Earlier work on similar mixtures indeed showed the formation of such species (Moore & Khanna 1991; Gerakines et al. 2000; Grim et al. 1989b). Of course, this experimental method of producing the ions may be different from what happens in the ISM. For example, the high abundance of in our samples, necessary to stimulate the photochemical production of oxygen rich acids, may considerably exceed the abundance in interstellar ices (Vandenbussche et al. 1999). In space acids are possibly produced by other mechanisms such as surface chemistry (e.g., Keane & Tielens 2002, in preparation).
To verify whether is a plausible candidate for the identification of the 6.85 m band a number of crucial issues need to be adressed. First of all, detailed spectroscopy of the mode is needed to investigate its behaviour as a function of ice composition and temperature. Next, the issue whether other infrared features of could be present in interstellar ice spectra must be adressed. Subsequently, the counterions that are produced in the experiments should be identified to assess their astrophysical relevance. Finally, the spectral signature of the counterions under various conditions is studied, where the prime question is whether conditions exist at which their infrared signatures become inconspicuous.
The paper is organized as follows. In Sect. 2 we review the experimental techniques. Sect. 3 summarizes the results. is created by UV photolysis of astrophysical ice analogs. We describe the spectral properties of under such conditions. Furthermore we establish which counterions are formed in the experiments and study their spectroscopic properties as well. In sect. 4 the obtained spectra are compared with observations of YSO’s. Besides matching the 6.85 m band, it is furthermore shown that the interstellar 3.26 m feature closely corresponds to one of the features. Also, using the experimental results, it is investigated whether the absence of features due to counterions in the observations can be reconciled with an assignment of the 6.85 m band to . In Sect. 5, the astrophysical implications of the identification are discussed. Sect. 6, finally, summarizes the conclusions of this paper.
2 Experimental
Detailed descriptions of the general procedure for creation and photolysis of ice samples and the measurement of their infrared spectra have been published earlier (Gerakines et al. 1995; 1996). In summary, the set-up consists of a high vacuum chamber ( mbar), with an IR transparent CsI substrate mounted on a cold finger which is cooled to 12 K. Samples were slowly deposited ( 3 1015 molec. /4 m hr-1) through a narrow tube controlled by a regulation valve. Photolysis by vacuum UV was subsequently performed by a hydrogen flow discharge lamp ( 5 1014 photons s-1; Ephoton 6 eV). For thorough photolysis, the thickness of the sample should be 0.2 m. To overcome this limit, in one case deposition and photolysis were performed simultaneously. In this way a photolysed sample can be produced of several microns thickness, which greatly enhances the amount of photoproducts and thus the S/N ratio of the IR spectrum. Afterwards the sample was warmed in steps. The evolution of the sample throughout the photolysis and warm-up sequence was monitored by infrared transmission spectroscopy. In addition to the photochemical experiments, we did band strength measurements for by deposition and warm-up of ices containing and HCOOH.
The reagents used in these experiments were H2O (purified by three freeze-thaw cycles), (Praxair, 99.996 purity), (Praxair, 99.99 purity), (Praxair, 99.999 purity) and HCOOH (Baker, 98 %). When ice samples containing both and or and HCOOH were prepared, the or HCOOH was deposited through a separate tube, to prevent reactions with prior to deposition. This method is described in Gerakines et al. (1995).
| Mixture | N | da | dose | dose | ||||
|---|---|---|---|---|---|---|---|---|
| H2O | CO2 | NH3 | O2 | molec. cm-2 | m | photons cm-2 | eV molec.-1d | |
| 1 | 10 | 10 | 0 | 10 | 7.2(17) | 0.37 | 9(17) | 11c |
| 2 | 10 | 5 | 7 | 10 | 4.0(17) | 0.17 | 9(17) | 20c |
| 3b | 10 | 2.2 | 1.2 | 1 | 2.5(19) | 9.5 | 2.4(19) | 8.6 |
| 4 | 10 | 2 | 1.1 | 1 | 8.5(17) | 0.32 | 6(17) | 6.4c |
| 5 | 10 | 1.2 | 0.9 | 0.9 | 4.8(17) | 0.17 | 9(16) | 1.7c |
| 6 | 0 | 1.2 | 1 | 1 | 4.4(17) | 0.23 | 9(16) | 1.8c |
| 7 | 0 | 0 | 1 | 1 | 4.5(17) | 0.18 | 9(17) | 18c |
-
a
Thickness obtained from the column density using a nominal density of 1 g cm-3.
-
b
Obtained by simultaneous deposition and photolysis.
-
c
Sample not optically thick, therefore dose is an upper limit.
-
d
Using an average photon energy of 9 eV (Jenniskens et al. 1993).
Table 1 provides a log of our experiments. Column densities and abundances of , and were directly obtained from the IR spectrum using band strengths from the literature (Gerakines et al. 1995; Kerkhof et al. 1999).
3 Results
3.1 Photolysis of /// mixtures

We photolysed a number of mixtures of /// to produce and a variety of negative ions (Table 1). Fig. 1 shows the evolution of spectrum of photolysed /// = 10/2/1.1/1 (Expt. 4; Table 1) during warm-up from 12 K to 220 K. First of all we want to verify whether is formed. Therefore, Fig. 1 also shows the spectrum of the binary mixture HNCO/ = 1/1.2, after warm-up to 120 K (no photolysis). In this sample is readily formed by proton transfer between the isocyanic acid and the ammonia (Novozamsky et al. 2001). The features fall at 3000 (broad; ), 3200 (2), 3060 (+), near 2860 () and near 1450 (), where is a lattice mode (assignments from Nakamoto 1972). The first four features blend together in a broad structure which extends from 3500 - 2400 . Directly after the photolysis of the /// mixture, the feature is already clearly present at 1500 . The H2O ice absorption in the 3400- 2800 cm-1 region obscures the other absorptions due to NH. Upon warming to 220 K, causing the ice to sublime, the other features can all be seen. Clearly, the ammonium ion is produced by the photolysis.


As discussed in Sect. 1, we want to investigate the spectral properties of the feature. To study the temperature dependence, Fig. 2 shows the 1900 - 1000 spectra of photolysed /// = 10/2/1.1/1 (expt. 4). Spectra are shown directly after photolysis at 12 K, and at a variety of temperatures up to 240 K. Some important spectral properties can be gleaned from the figure. Upon warm-up to 120 K the depth of the feature near 1460 increases by a factor 2. While this increase could result from further acid-base reactions during the warm-up, the absence of any feature attributable to acids such as or after the photolysis (Fig. 2, has bands at 1727, 1480 and 1275 ; Gerakines et al. 2000; has a strong feature at 1300 cm-1; McGraw et al. 1965) argues against this possibility. Thus, the growth of the feature during warm-up is likely caused by an increase of its intrinsic strength. Furthermore, the feature shifts strongly redward with temperature. The enhancement and the shift reflect the strong interaction of the ion with its environment. Fig. 3 plots the position of the band vs. temperature for a number of samples (expts. 2, 4 and 6 of Table 1). It can be seen that, while there is a steady redshift throughout the warm-up, the shift is particularly pronounced during sublimation between 160 and 180 K.

As discussed in Sect. 1, it is essential to identify the negative ions produced in the experiments to assess their astrophysical significance. To this end, we study the IR spectrum of the residue which remains after the ices have fully evaporated. As a basis for the interpretation of more complex samples, Fig. 4 shows the warm-up behaviour of the residue of photolysed / = 1/1 (expt. 7; Table 1). The evolution is best understood by a “hot to cold” interpretation, i.e., starting with the most refractory component at the final stages of the warm-up, and then working backwards in the sublimation sequence to see which spectral elements are sequentially lost. After warm-up to 220 K, a component remains which is stable up to 280 K. Its spectrum resembles that of ammonium nitrate (Fig. 4; ; throughout the paper we will use the standard chemical notation for salts. It must be noted however that the constituents of these compounds are ions, in this case, and ). The ion was previously identified in photolysed / ices (Grim et al. 1989b). However, while there is a general correspondence with the literature spectrum of ammonium nitrate there are some differences in the relative intensities and positions of the bands. The literature spectrum was produced from fine crystalline powder in nujol mull, while our samples consist of a mixture of salts at low temperature. Spectra of ions are generally quite sensitive to factors like temperature, matrix and degree of annealing, due to the strong interaction of the ions with the matrix (c.f. OCN- in various salt matrices; Maki & Decius 1959). This effect possibly causes the differences. During warm-up from 180 to 220 K two strong features disappear at 1270 and 1220 , together with a fraction of the 1450 , and 2400 - 3500 complex due to . The band at 1220 may correspond to the main feature of . As compared with the literature spectrum of NaNO2 (in nujol mull; Fig. 4), the band is shifted by 35 , possibly due to matrix interactions. The assignment of this component with ammonium nitrite () is supported by the identification of the ion in the photolysed ice (Grim et al. 1989b). The 1270 feature corresponds to an unidentified photoproduct.
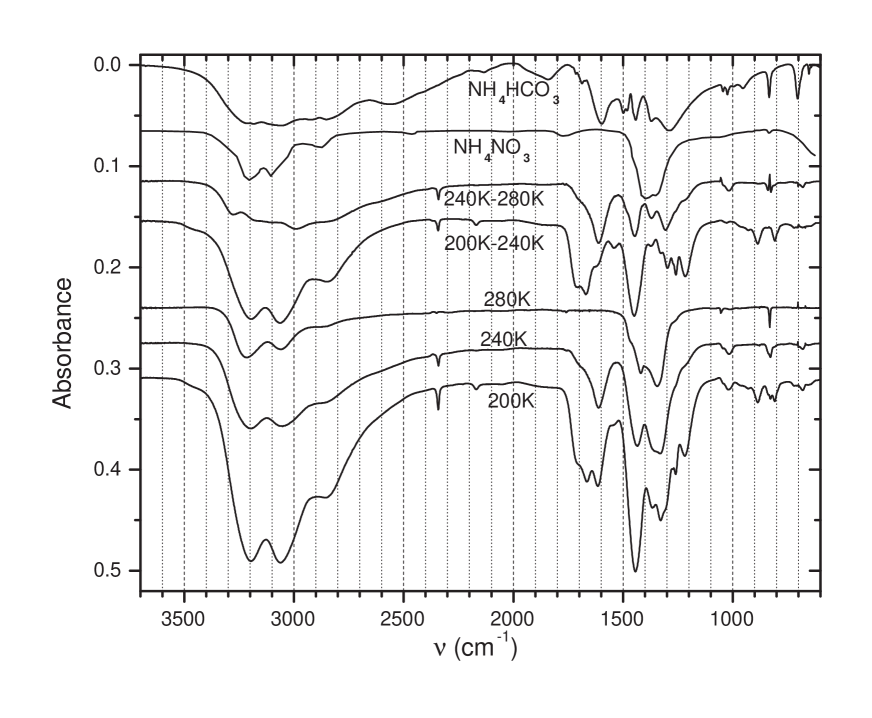
Fig. 5 shows the spectral evolution of the residue of photolysed /// = 10/2.2/1.2/1 (expt. 3). To probe the nature of the anions, we will again analyse this diagram “hot to cold”. As with the / sample, the most refractory component, remaining at 280 K after all other material has sublimed, resembles ammonium nitrate (Fig. 5). During warm-up from 240 to 280 K a component sublimes which is characterized by two strong bands at 1600 and 1300 , together with four weaker features at 1375, 1010, 830, and 690 . The disappearance of these bands is accompanied by a decrease of the features. All these features have counterparts in the spectrum of ammonium bicarbonate in a KBr pellet (; Fig. 5). Still, some differences are apparent in width and relative intensity, while furthermore some extra bands are present in the literature spectrum of which only minor indications are seen in the 240 to 280 K component. Again, we note that the spectra of ions are generally quite sensitive to such factors as temperature, matrix and degree of annealing, and it seems likely that the differences could derive from such factors.
To verify the presence of in the 240 - 280 K fraction, we photolysed the ice mixture // = 1/1/1 (Expt. 1, Table 1) to see whether its precursor, carbonic acid () is formed when is omitted from the mixture. The photolysis gave rise to features at 3040, 2840, 2627, 1727, 1480, and 1275. These bands can all be ascribed to carbonic acid (Moore & Khanna 1991; Gerakines et al. 2000).
The residue fraction subliming between 200 - 240 K is characterized by a rather complex spectrum. Features at 1605, 1375, 1300, and 1010 show that some sublimes in this temperature interval. However, the weakness of these bands shows that the contribution of bicarbonate to the total negative charge in the 200 - 240 K fraction is minor. The band at 1670 and the broad structure between 1000 and 600 likely correspond to a small quantity of which is embedded in the more refractory material (Schutte & Buys 1961; Ryskin 1974). Likewise, the 2340 feature can be ascribed to a small amount of embedded . Like for the photolysed /, the 1220 may be due to the ion (Fig. 4). However, the intensity of this band shows that accounts for only half of the countercharge of the which sublimes in the 200 - 240 K interval. The 2170 feature indicates the production of some (Hudson et al. 2001), however, it is too weak to make a substantial contribution to the countercharge. We conclude that an important fraction of this relatively volatile residue component must consist of unknown anions. No sign of such species, or of the acids from which they originate, was found in experiments with less than four initial ice components (i.e., //, /; sect. 3.1). It therefore seems probable that they are relatively complex ions whose formation pathway involves all four original components.
As outlined in Sect. 1, a prime issue for the viability of the assignment of the 6.85 m band concerns whether it is possible to produce a clear spectral signature while features of counterions are weak or absent as for the interstellar spectra. From Fig. 2 it can be seen that intense broad bands near 1320 and 1220 are present once the ices have sublimed at 180 K. As discussed above, these bands are caused by negative ions, probably , , and . Before ice sublimation, these bands are however quite inconspicuous, resulting in a smooth sloping spectrum in the 1400 - 1200 range with only minor substructure due to the 1300 and 1270 features of unidentified photoproducts.
To further investigate the influence of the matrix on the appearance of the anion bands, Fig. 6 compares the 1900 - 1000 spectra of the ice samples /// = 0/0/1/1, 1/0.5/0.7/1, 10/2/1/1.1 and 10/1.2/0.9/0.9 (Expts. 2, 7, 4 and 5) All spectra were taken after warm-up to 160 K and sublimation of , which enables a better view of the features of the photoproducts. Samples 2 and 7 show strong bands due to negative ions at 1385 and 1335 () and at 1230 (). There is hardly a sign of these or other features of anions in the dominated samples (expts. 4 and 5), even though the intensity of the band at 1475 is similar. This again shows that in the dominated samples features due to anions are inconspicuous.
3.2 Summary
The photolysis of /// ice mixtures efficiently produces . These experiments revealed the following four important spectral properties of and the negative counterions which pose important constraints for an identification of in interstellar ices:
1. During warm-up from 12 to 280 K, the feature shows a pronounced shift from 1480 to 1420 .
2. Between 12 to 120 K the feature grows smoothly by a factor 2.
3. In ice three relatively weak features of are only evident after the ice sublimation at 180 K. These are the band near 3200 , the + band near 3060 , and the band near 2860 .
4. In dominated ice, the spectral features of the counterions are only apparent after the sublimation of the ice, but are unconspicuous in the dominated ice matrix.
Concerning this last point, analysis of the spectrum of the residue shows that , , are probably present. The total abundance of these species is somewhat unsufficient for balancing the , indicating the production of additional, yet unidentified, anions.
The identifications of anions from the IR spectra are in some cases tentative, while in other cases no identification was possible at all. A positive identification of the anions and corresponding acid neutrals may help to constrain the composition of interstellar ices (see Sect. 5 below). In future, the nature of the negative species could be studied by analysis of the molecules that evaporate during the warm-up, for example, by mass spectroscopy.
3.3 Strength of the band
| mixture | T (K) | A (cm ion-1) |
|---|---|---|
| //HCOOH | ||
| 100/3.6/3.6 | 120 K | 4.4 (-17) |
| /HCOOH=4/10 | 80 K | 4.0 (-17) |
| /// | ||
| 10/1.2/0.9/0.9, + h | 150 K | 2.7 (-17) |
To obtain column densities, it is necessary to measure the intrinsic strength of the feature. This can be derived from experiments in which is formed by simple warm-up (no photolysis) of an ice containing and an acid. In this case the quantity of formed during warm-up is equal to the amount of which is lost. Since the band strength of the umbrella mode in various matrices is known (Kerkhof et al. 1999), this allows a precise determination of the band strength. We performed two experiments involving with formic acid (HCOOH; see Schutte et al. 1999 for experimental details). The results are listed in Table 2. Since the strength may depend on the composition of the matrix and nature of the counterion, the band strength of in the photolysis experiments may differ from the HCOOH/ mixtures. No direct measurement in the photolysis experiments is possible, because, besides acid-base reactions, other processes may contribute to the destruction during the photolysis. Therefore the amount of destroyed exceeds the formation of by an unknown factor and only a lower limit to the band strength can be obtained. The most constraining lower limits are derived for the experiments with -dominated ices (see Table 2). This is not surprising, since in these experiments features of N-containing photoproducts other than are small (Sect. 3.1).
We will adopt a standard band strength A(,) = 4.410-17 cm molec.-1. This is close to the value of (2.5 - 3.5)10-17 cm molec.-1 found in aqueous solution (Lowenthal & Khanna, in preparation). As discussed in Sect. 3.1, the band strength varies by a factor 2 with temperature in our photolysis experiments. It is unclear whether the standard band strength corresponds to the highest or lowest bandstrength in the photolysis experiments. We will therefore adopt a standard uncertainty of a factor 2 in this value.
4 Comparison to observations of Young Stellar Objects
| Object | N()a | b | 3.26 mc | 3.48 mc | 6.85 m | ||||
|---|---|---|---|---|---|---|---|---|---|
| () | () | d | % | ||||||
| W33A | 12 | 1.27 | 0.4 | 0.29 | 1471 | 1.1 | 0.33 | 11 | |
| NGC7538:IRS9 | 7 | 2.07 | 0.13 (0.02) | 1473 | 0.29 | 5 | |||
| GL2136 | 5.0 | 2.75 | 0.14 | 0.14 (0.02) | 1459 | 0.23 | 0.6 | 6 | |
| S140:IRS1 | 2.8 | 3.24 | 3072 | 0.036 (0.007) | 0.027 (0.007) | 1451 | 0.16 | 0.23 (0.06) | 7 |
| 3085g | 0.050g | 0.050g | 0.31 | ||||||
| W3:IRS5 | 5.8 | 4.12 | 0.13 | 1459 | 0.25 | 5 | |||
| MonR2:IRS3 | 1.6f | 4.32 | 3071 | 0.049 (0.007) | 0.036 | 1437 | 0.23 | 0.21 (0.03) | 17 |
| AFGL7009S | 12 | 1462 | 1.1 | 10 | |||||
| GL989 | 3 | 3098g | 0.069g | 0.069g | 1471 | 0.11 | 0.63 | 4 | |
| Oph Elias 29 | 3 | 0.03 | 0.089 (0.007) | 1470 | 0.07 | 0.4 | 3 | ||
| 3080g | 0.085g | 0.065g | 1.2 | ||||||
| HH100 | 2.4 | 3087 | 0.032 (0.010) | 0.041 (0.005) | 1470 | 0.15 (0.06) | 0.21 (0.09) | 8 (3) | |
| NGC7538:IRS1 | 3 | 3065 | 0.078 (0.013) | 0.052 (0.014) | 1455 | 0.32e | 0.24 (0.04) | 13 | |
-
a
Water column density obtained from the integrated depth of the 3 m band: NGC7538:IRS9/Allamandola et al. 1992; AFGL7009S/Dartois et al. 1999a (from 6 m feature); W33A/Gibb et al. 2000 (obtained by fitting the 3 m feature with laboratory analog spectra); AFGL 989/Smith et al. 1989; AFGL 2136/Schutte et al. 1996a; Elias 29/Boogert et al. 2000; S140:IRS1(or GL2884)/Willner et al. 1982; W3:IRS5/Allamandola et al. 1992; MonR2:IRS3/Smith et al. 1989; HH100(or RCra:IRS1)/Whittet et al. 1996; NGC7538:IRS1/Willner et al. 1982.
-
b
Ratio of flux at 45 and 100 m; from Keane et al. 2001
-
c
Ground-based observations (Sellgren et al. 1995, Brooke et al. 1996, Brooke et al. 1999), unless otherwise noted. Error noted in parentheses.
-
d
Keane et al. 2001; error typically 20 %, unless otherwise noted
-
e
From the ISO-SWS database
-
f
It is unclear whether the 3 m feature of MonR2:IRS3 is fully caused by ice, due to the large width of this band (Smith et al. 1989). Therefore this number should be considered an upper limit.
-
g
Observed by ISO-SWS (Bregman et al. 2001)
-
h
Boldface entries give the 3.26 m depth derived from ISO-SWS data (Bregman et al. 2001). Errors are given in parentheses.
-
i
The uncertainty, due to the error in the bandstrength, is a factor 2.
In this section we investigate a number of criteria for the identification of the interstellar 6.85 m absorption with the feature of the ammonium () ion. First of all, the feature should provide a good match to the observed band. Second, the characteristic redshift of the feature with temperature (Sect. 3.1; Fig. 3) should show up in the observational data. Third, additional bands of are sought, specifically the , , and features near 3200, 3060, and 2860 (3.12, 3.27, and 3.50 m). Fourth, there should be no spectral structure due to counter-ions that is inconsistent with the interstellar data. It will be shown that the available observational information indicates that all these criteria are satisfied. For further reference, Table 3 lists the relevant observational data for all lines of sight where high quality spectra of the 6.85 m feature (i.e., by ISO-SWS) are available. Data on the interstellar 3.26 and 3.48 m features are included because they are possibly associated with the and bands (see below). The depth of the 6.85 m band was measured from the original data. These were obtained from the ISO-SWS database (for NGC7538:IRS1) and from Keane et al. 2001 (all other objects). The depth was obtained by subtracting a linear baseline in the log(F) vs m plane. The baseline was drawn through the 5.5 and 7.5 m points.
4.1 Comparison with the interstellar 6.85 m feature
4.1.1 W33A
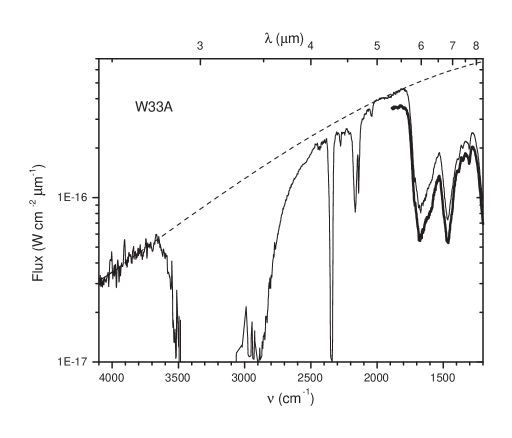


Fig. 7 shows the 4000 - 1200 (2.5 - 8.3 m) spectra of the high mass YSO W33A obtained by ISO/SWS in observation modes 1 and 6 (de Graauw et al. 1996). Spectra were adopted from Gibb et al. (2000) and Keane et al. (2001), respectively. While the SWS6 spectrum gives the highest S/N, the wide range of the SWS1 spectrum allows an accurate baseline determination. We defined the baseline over the entire 4000 - 1200 range by drawing a smooth third order polynomial through the continuum regions 4100 - 3700 , 2010 - 1980 , and 1840 - 1810 (Fig. 7). This procedure differs in some respects from the baseline definition in Keane et al. and Gibb et al. Keane et al. defined the baseline only over a limited data range (1900 - 1300 ), and included the region around 1300 , just before the onset of the silicate feature, in the baseline fit. It is however clear from Fig. 7 that, at least for W33A, there is considerable absorption in this region. Gibb et al., while also fitting the baseline over a similar broad range, included the 2500 - 2440 region in the fitting procedure. However, it is probable that both the long-wavelength shoulder of the band (Willner et al. 1982; Smith et al. 1989, see also Fig. 7) as well as the broad combination feature near 2220 (Gibb et al. 2000) extend into this region. Indeed, by excluding it we obtain a smoother baseline than Gibb et al. (i.e., third, rather than fourth order polynomial).
Although there is a slight offset between the SWS1 and SWS6 data, their overall spectral shape is quite consistent. Therefore the SWS6 data were converted to an optical depth scale by subtraction of the baseline of Fig. 7. The result is shown in Fig. 8. The small offset between the SWS1 and SWS6 data was compensated by normalizing to 0 in the 1900 - 1800 region.
The CH3 deformation feature of methanol falls near 6.85 m and will contribute a fraction of the interstellar band. The methanol column density towards W33A, as determined from the and combination bands near 3.54 and 3.9 m, respectively, equals 1.85 1018 (Dartois et al. 1999b). Fig. 8 compares the optical depth spectrum of W33A with the band of methanol scaled to this column density. This feature was measured in a mixture // = 1/1/1 (Ehrenfreund et al. 1999). This matrix should be representative of the ices in which methanol in circumstellar objects is embedded (Gerakines et al. 1999; Dartois et al. 1999a). It is clear from Fig. 8 that methanol only gives a small contribution to the observed 6.85 m band of 20 % (see also Grim et al. 1991; Schutte et al. 1996). To enable a more suitable comparison with the laboratory spectra, we have subtracted this small contribution from the W33A spectrum. The resulting curve is shown in Fig. 8. Since the correction is small, using spectra of methanol in other matrices, such as pure methanol, or a water-dominated ice, gives a very similar result.
Fig. 9 compares the 6.85 m band of W33A (after subtraction of the methanol feature) with the band of as produced in one of our water-dominated samples after photolysis and warm-up (expt. 4). To take into account the variety of dust temperatures probed by the line of sight, the laboratory spectrum is an average of the 12, 120, and 180 K (x2) spectra. We note that good overall matches can be obtained with all photolysed water-dominated ices (expts. 3, 4 and 5), since they produce little substructure in the 1400 - 1250 (7.1 - 8.0 m) range. On the other hand, the photolysed ice mixtures with less water show strong peaks in this region due to and (Sect. 3.1; Fig. 6), which have no interstellar counterparts.
Due to the superposition of ices at different temperatures along the line of sight, components of different volatility will have different average temperature. This is illustrated by the temperature averaged laboratory match of the W33A spectrum (Fig. 9). The band arises primarily in the 120 and 180 K components, since at 12 K the intensity of this feature is small (Fig. 2). On the other hand, the ice features are produced in the 12 and 120 K spectra, since at T 170 K sublimes. Thus, the average temperature of the solid in the laboratory spectrum is 66 K, while the average temperature of is 150 K. This clearly shows that temperatures derived by fitting the 6.85 m band should not be taken as representative of the temperature of more volatile components located in cooler regions along the line of sight.
4.1.2 MonR2:IRS3

MonR2:IRS3 is an extreme object in a number of ways. First, the solid abundance is exceptionally low ( 1 %; Keane et al. 2001). Second, its 6.85 m feature is the reddest of all YSO’s (Table 3). Third, the strength of the 6.85 m feature relative to the column density of is very high (Table 3). This all may indicate that the ice along the line of sight is exceptionally warm, as is also indicated by the high flux ratio F(45 m)/F(100 m) (Keane et al. 2001; Table 3). Indeed, the large relative intensity of the 6.85 m band, assuming that the carrier of this band is a relatively refractory species, suggests that ice has begun to evaporate along most of the line-of-sight. This is confirmed by the large column density of water vapor (Boonman et al. 2000). Ice sublimation should greatly enhance the visibility of features of more refractory components, making MonR2:IRS3 an excellent testing ground for the presence of and associated counterions.
Fig. 10 compares the 6.85 m band of MonR2:IRS3 with the features obtained in several of our experiments. This set of experimental data will further down be used to evaluate the presence of other interstellar bands. No correction was made for the contribution of methanol to the 6.85 m band, since no has been observed towards this source (abundance 4.5 %; Dartois et al. 1999b). The best matches are obtained for the photolysed water-rich ices (expts. 4 and 5), since the water-poor ice (expt. 2) gives strong features at 1385 and 1335 due to which are not observed. In all cases, the position of the laboratory band is somewhat blue-shifted from the MonR2:IRS3 feature. This situation could be mended by selecting laboratory spectra at higher temperatures. However, for such high temperatures a broad band near 1320 , which is caused by a superposition of features of various negative ions (Fig. 2, Sect. 3.1) shows up strongly, resulting in a decrease of the overall quality of the match. Even at the temperatures selected for Fig. 10 too much absorption appears to be present in the 1350 region. However, this difference could be caused by the original choice of baseline, which made the a priori assumption of little absorption in the 1350 region (Keane et al. 2001). As for W33A, considerable absorption may be present in this region. Thus, the position of the 6.85 m feature of MonR2:IRS3 is not fully reproduced by the experimental spectra, although the difference is small ( 3-10 ) for the three -dominated samples. In view of the strong matrix dependence of the position of this band (Fig. 3), it seems plausible that the offset may be caused by a shift associated with the composition of the interstellar matrix.
Besides the 6.85 m band, the 6 m feature of MonR2:IRS3 also has a counterpart in the laboratory spectra. Especially expt. 4 at 180 K gives a band which is quite similar (Fig. 10). At this temperature most has sublimed, and the laboratory features near 6 m are dominated by a superposition of bands from various negative ions, i.e., and one or more unidentified species (Fig. 4; Sect. 3.1). This suggests that most of the 6 m feature of MonR2:IRS3 is caused by non-volatile components rather than ice. Such a conclusion is consistent with the observations, which show that the 6 m feature of MonR2:IRS3 is 3.5 times stronger than expected at the column density derived from the 3 m band (Keane et al. 2001).
4.2 The redshift with temperature

It was shown in Sect. 3.1 that the ammonium band shifts strongly towards the red with increasing temperature. Even though the position of the band depends considerably on the starting matrix, this general trend held for all our experiments. Thus, if the ammonium ion is the carrier of the interstellar 6.85 m feature, a correlation should be found between the position of the 6.85 m feature and indicators of the dust temperature along the line of sight.
Fig. 11 plots the position of the 6.85 m band in the data set of Keane et al. (2001) against the ratio of the fluxes at 45 and 100 m as measured by ISO/LWS. This ratio is a general indicator of the dust temperature along the line of sight. It can be seen that there is a clear correlation between the position of the band and the flux ratio, in the sense that the interstellar band shows a strong redshift with increasing average dust temperature. A similar conclusion was already formulated by Keane et al., with the difference that they interpreted the change as due to a systematic variation with line of sight temperature in the contribution of two independent components of the 6.85 m feature. It must be stressed that interpretation of the temperature dependence of the band as either a variation of independent components, or a shift of a single component, is solely a matter of interpretation and cannot be decided on the basis of the interstellar band profile, since the feature does not show substructure.
The systematic redshift of the 6.85 m band with line-of-sight dust temperature is in good agreement with the trend observed for the feature of the ammonium ion. Comparing Fig. 11 and Fig. 3 of Sect. 3.2.1, it can be seen that the spectral region in which the interstellar feature is found falls well within the range spanned by the position of the band. Thus, the systematic redshift of the interstellar 6.85 m band gives strong support to its identification with the mode of .
The range of positions of the interstellar band corresponds to laboratory temperatures of 120 - 240 K. It must be noted though that the position of the feature not only depends on temperature, but also on the ice matrix (Fig. 3). Therefore, this temperature range should be taken as a rough indication. Nevertheless, it seems clear that solid is found at higher temperatures than more volatile ice components. Matching the profile of the 3 m feature typically yields 20 - 80 K (Smith et al. 1989), while matching the profile of the 15.2 m bending mode of gives 110 - 140 K (Gerakines et al. 1999). This difference in temperature is consistent with the refractory nature of , which will survive in the warmer regions close to the embedded source where the more volatile ice components have sublimed. In addition, the band strength of increases considerably above 100 K (Sect. 3.1; Fig. 2). This effect will minimize the contribution of the coldest regions to the 6.85 m band.
4.3 Additional features


Besides the feature near 6.85 m, the ammonium ion shows a number of additional features, i.e., , , and . These are centered near 3200 (3.12 m), 3060 (3.27 m), and 2860 (3.50 m), respectively (Figs. 1 & 5, Sect. 3.2.1). The optical depth of each of these bands is typically 30 % of that of the feature.
The feature would be very difficult to distinguish, since it nearly coincides with the peak of the 3 m water band (Smith et al. 1989). The two other bands, while relatively weak, may be observable as substructure on the red wing of the water band. Indeed, features have been observed towards many protostellar sources near these positions (e.g., Sellgren et al. 1995; Brooke et al. 1996; Brooke et al. 1999; summary in Table 3). For example, Fig. 12 shows the mid-IR spectrum of MonR2:IRS3 obtained by ISO-SWS (Gibb et al. 2001) and by ground-based spectroscopy (between 3.16 - 3.65 m; Sellgren et al. 1995). As already mentioned above, this source appears to be exceptionally warm and therefore should have enhanced abundances of refractory components like .
To facilitate comparison with the laboratory data, a continuum has been subtracted from the MonR2:IRS3 original flux data (Ground-based as well as ISO-SWS). This continuum was obtained using the ISO-SWS data by drawing a second order polynomial through the zero absorption regions around 3800 and 2000 . Before continuum subtraction, the ground-based data were multiplied by 0.88 to match them to the ISO-SWS spectrum.
A small excess is apparent in the ISO-SWS data relative to the ground based spectrum around 3.29 m. This excess is obviously caused by the presence of the well-known emission feature in the wide aperture ISO data (This is a common phenomenon for ISO observations towards YSO’s; Gibb et al. 2001).
As already discussed by Sellgren et al., MonR2:IRS3 shows two features at 3.26 and 3.48 m. Fig. 12 also shows the and bands as obtained in our experiments. To allow a detailed comparison, we subtracted baselines from both the laboratory and interstellar spectra, as indicated in Fig. 12. The resulting optical depth curves are shown in Fig. 13. Only the ground-based observations were used, due to the “contamination” of the ISO spectra with the 3.3 m emission feature.
The comparison in Figs. 12 and 13 indicates a good general agreement between the 3.26 and 3.48 m features of MonR2:IRS3 and the and bands. Nevertheless, no single spectrum is able to fit in detail both the position and relative intensity of the observed features. However, the variation among the laboratory spectra shows that the features are quite matrix and temperature dependent, and it therefore seems plausible that this moderate difference could derive from matrix effects. Besides the agreement in profile, the agreement between the intensity of the laboratory and the MonR2:IRS3 features lends support to an identification with .
It is clear from Fig. 12 that if the 3.26 and 3.48 m features of MonR2:IRS3 are caused by , the ion would also partially account for the overall broad absorption in the 3.1 m feature. Indeed, some 50 % of the unidentified excess absorption between 3.25 and 3.8 m (3080 - 2630 m-1), which cannot be accounted for by ice (Smith et al. 1989), could arise from the ion.
If the 3.26, 3.48, and 6.85 m features are all due to the same carrier, a tight correlation between these bands is expected. Ground based observations of the 3.26 m feature exist for four of the objects whose 6.85 m feature has been observed by the SWS. (Table 3). For these objects the data give a stable ratio (3.26)/(6.85) = 0.22 0.02. The constancy of the ratio is even somewhat better than what could be expected on the basis of the rather large uncertainty in the depth of the 3.26 m band (Table 4). Besides from telluric interference, this error derives from the baseline definition, since this shallow feature is located in a complex spectral region, where various spectral features are located, such as the broad feature of ammonia hydrate around 3.5 m (2860 ) and the 3.36 m (2980 ) feature of , as well as possibly structure caused by scattering (Dartois & d’Hendecourt 2001; Brooke et al. 1999). These features may contribute to the broad long wavelength shoulder of the 3 m band, on which the feature is superimposed.
For some of these objects ISO-SWS observations on the 3.26 m feature have also been reported (Bregman et al. 2001). Using these data, there is little or no correlation between the 3.26 and 6.85 m bands (Table 3). Indeed, the ground based and ISO data give conflicting results on the depth of the 3.26 m band, most notably in the case of Oph Elias 29, where the discrepancy is at least a factor of 3. It not quite clear what causes these differences and which dataset is most reliable. For Elias 29, Bregman et al. used a speed 3 scan in AOT SWS1. However, a higher quality SWS6 scan in this region does not show the 3.26 m feature, consistent with the ground-based observations (Boogert et al. 2000; Boogert, private communication). A general problem with the ISO data could be their wide aperture. For this reason, the 3.3 m emission feature often shows up in the SWS spectra of embedded YSO’s (Gibb et al. 2001; see also Fig. 12). Indeed, some 3.3 m emission seems consistent with the ISO spectra of S140 and GL 989 (Gibb et al. 2001). The presence of even a small amount of this feature would severely complicate a correct baseline definition and therefore introduce a large error in the depth of the shallow 3.26 m band. On the other hand, in ground-based observations the center of the 3.26 m band has an enhanced noise level due to telluric methane absorption. However, the ISO and ground-based observations also deviate for the 3.48 m band (Table 4), even though it falls in a relatively undisturbed region. This deviation therefore reinforces the concern that errors in the baseline definition caused by the 3.3 m emission feature is a major pitfall when using ISO-SWS data to study the 3.26 and 3.48 m absorption bands.
Good candidates to search the 3.26 m feature are NGC7538:IRS9 and W3:IRS5, for which we predict, from the strength of the 6.85 m band, (3.26) 0.064 and 0.055, respectively. A detection of these bands would be an important test of the assignment.
No tight correlation exists between the 3.26 m and 3.48 m features. Relative intensities vary between 0.13 (MonR2:IRS3) and 1.3 (Elias 29; see Table 3). While the relative intensity of the feature of MonR2:IRS3 is consistent with an assignment of the 3.48 m band to (Fig. 13), it is clear that in general other species must also contribute to this feature. This is not too surprising, since additional structure is present in this region. In particular, the long wavelength shoulder or wing of the 3 m band, which extends from 3.1 - 3.8 m (3200 - 2600 ; Smith et al. 1989; their Fig. 6) produces structure in this region (Smith et al. 1989; their Fig. 4). This absorption will blend in with any additional absorbers, e.g., the CH stretching mode of aliphatic hydrocarbons and the 3.5 m feature of ammonia hydrate (e.g., Dartois & d’Hendecourt 2001).
4.4 The 3.26 m feature and PAHs
Previously, an assignment of the 3.26 m feature to the CH stretching modes of polycyclic aromatic hydrocarbons has been proposed (PAHs; Sellgren et al. 1995; Bregman et al. 2000). Such an assignment would of course limit the contribution of the feature to this band (Sect. 4.3). Here we quantitatively assess the contribution of the PAH CH stretching mode to the 3.26 m feature of MonR2:IRS3.
In support of, at least, part of the 3.26 m feature deriving from the PAH CH tretching mode is the observation of a weak absorption band at 11.2 m towards MonR2:IRS3, which is ascribed to the out-of-plane bending mode of isolated CH groups on the aromatic skeleton (Bregman et al. 2000). The intensity of this band can be used to constrain the PAH contribution to the 3.26 m feature. The integrated optical depth are (11.2) = 0.81 cm-1 and (3.26) = 5.6 cm-1. The ratio of the band strength of the CH stretching mode to that of the CH bending mode for isolated CH groups equals 0.5 for gaseous, neutral PAHs. For ionized or solid state PAHs the ratio is at least 4 times smaller (Bregman et al. 2000 and references therein). Therefore the CH groups associated with the 11.2 m feature can, at most, cause an absorption of (3.26 m;PAH) = 0.4 cm-1, i.e., only 7 % of the observed intensity. Besides isolated CH groups, aromatic species will have CH groups on their periphery which have 1 or more adjacent CH groups. For these the CH bending mode falls at longer wavelength (11.6 - 13.6 m; Hony et al. 2001). Besides discrete features near 12.7 and 13.5 m, the bending modes of these groups give rise to a broad plateau between 11 - 13 m caused by overlapping absorptions. In emission, the fraction of the total emission associated with the CH bending modes (i.e., 11.2, 12.7, 13.5 m bands and the plateau) which is emitted by the 11.2 m band varies between 0.3 - 0.7 (Hony et al. 2001). Since the band strength of the CH bending mode for adjacent aromatic CH groups is two times weaker than for isolated CH groups, this implies that these groups could add = 0.4 - 1.9 cm-1 to the 3.26 m feature. This implies that 14 - 40 % of the 3.26 m band may be due to the PAH CH stretch. This fraction could actually be much lower if a large fraction of the PAHs would be frozen on the grains, causing the band strength of the CH stretching mode to drop by a factor 4 (Joblin et al. 1994). Indeed, it seems probable that in a high density environment like the circumstellar regions of a young stellar object a large fraction of highly refractory molecules such as PAHs would accrete on the dust grains. In conclusion, it seems probable that the contribution of PAHs to the 3.26 m band is rather small. This agrees with our result in Sect. 4.3, namely, that, based on the assignment of the 6.85 m band to , most of the 3.26 m feature should be caused by the band.
Contrary to our result it was concluded by Bregman et al. (2000) that PAHs may account for the entire 3.26 m absorption band. Some important differences between his calculations and ours must be pointed out. First, the integrated intensity of the 3.26 m band was approximated by depth x FWHM in this earlier paper, while we use exact numerical integration, arriving at a 1.7 times higher intensity. Second, Bregman et al. estimated that typically only 17 - 30 % of the entire emission in the CH bending region originates from the 11.2 m band. However, a thorough recent survey of this region in a wide variety of objects (Hony et al. 2001) showed that this fraction is considerably higher, i.e., 30 - 70 %.
4.5 The abundance of and the counterions
Applying the intrinsic strength of the band, the column density can be derived from the observations. With A() = 4.4 cm ion-1 (Sect. 3.3; uncertainty factor 2), we find for W33A, with an integrated optical depth of (6.85 m) = 57 (after correction for the contribution), N() = 1.3 . For W33A we adopt N() = 1.2 . This number was derived by Gibb et al. 2000 by fitting the blue wing of the 3 m band with laboratory ice bands. It must be noted that those authors adopted a slightly lower column density as their end result, based, in part, on matches of the blue wing of the 3 m band of W33A with other interstellar 3 m features. However, the correspondence of the W33A 3 m band with the other interstellar features was considerably less than the correspondence with the selected laboratory ice bands (presumably caused by source to source variations in ice composition and temperature). Therefore, we prefer to adopt here the value which is solely based on the laboratory comparison. This gives an abundance of 11 % for W33A, with an uncertainty of a factor 2 due to the bandstrength error.
From the data summarized in Table 3, it can be derived that the abundance varies from 3 % to 17 % relative to . Here we use a constant correction for the contribution of methanol to the 6.85 m band of 20 %, as for W33A. This is perhaps a bit large, since in general the methanol abundance in YSO’s is lower than for W33A (Dartois et al. 1999b). However, the correction is small anyway, and no attempt was made for a detailed source to source analysis. One exception is GL7009S, which has an exceptionally high abundance of solid methanol, for which we adopted a 30 % correction of the 6.85 m feature (Dartois et al. 1999a).
Clearly, an equal amount of negative charge should be present in the ices to balance . Recently, Gibb et al. (2000) investigated the full inventory of ice species along the line-of-sight towards the high mass YSO W33A. Their analysis showed that the negative species that have been detected towards this source, i.e., and (assuming that is the carrier of the interstellar XCN feature; Grim & Greenberg 1987; Schutte & Greenberg 1997; Demyk et al. 1998; Hudson & Moore 2000; 2001; Novozamsky et al. 2001) have abundances of 3.2 % and 0.8 %, respectively (these values are slightly lower than those of Gibb et al., due to the 10 % higher column we adopt for W33A). Since the abundance for this source is 11 %, this implies that only 30 % of the countercharge is provided by the observed negative species. Our experiments suggest that the residual charge could be provided by a combination of ions such as , , . As was shown, a mixture of these species embedded in an -dominated ice does not produce significant spectral structure. Their total abundance would be 7 % of for W33A. For other sources, the fraction of the charge balance that can be provided by the observed negative species (i.e., ) is even smaller (Gibb et al. 2000). Thus, assuming that they make up for the residual balance, the total abundance of “invisible” anions in the ices near YSO’s would be in general 70 - 100 % of , i.e., 3 - 15 %.
It has been argued that the poor correlation between the 4.62 m feature of and the 6.85 m band disagrees with an identification of this feature with (Keane et al. 2001; cf. Figs. 7 & 12. However, as pointed out above, provides only a small fraction ( 20 %) of the countercharge. In such a case, a clear correlation between the and abundances is only expected if the make-up of the anion mixture is stable between YSO’s. The lack of correlation shows that the fraction of in the total ensemble of anions strongly varies.
5 Astrophysical Implications
When the assignment was originally made (Grim et al. 1989a), the identity of the counterions was uncertain. This was widely considered a prime concern (Schutte et al. 1996a; Keane et al. 2001; Demyk et al. 1998; Tielens and Whittet 1997). Our new experiments demonstrate that in dominated ices the charge balance can be achieved without introducing spectral structure of negative ions that is inconsistent with the observations. Thus it appears that the objections to the assignment have been met. All things considered, now stands as the best assignment for the interstellar 6.85 m feature (apart form the generally small fraction caused by ; Sect. 4), based on the band’s position, shape, and width. Moreover, the ammonium ion matches both the 6.85 and 3.26 m features, and is able to reproduce the temperature-dependent redshift of the 6.85 m band. Chemical considerations also support the assignment as is easily produced by either photolysis or ion irradiation of known, or suspected, interstellar molecules, or by mild warm-up of ammonia and acids which could be present in the ice (see below). A straightforward observational test would be to probe the tight correlation between the 3.26 and the 6.85 m features which is expected if both are due to .
It is unclear whether interstellar could arise from irradiation or photolysis as in our experiments. The weakening of the 3.4 m CH stretching mode of aliphatic grain material in goig from diffuse to dense regions indicates that energetic processing could play an important role in dense regions (Muñoz Caro et al. 2001; Mennella et al. 2001). However, the processing of our samples gives rise to some weak features which have not yet been observed, most notably the band at 1038 , and the unidentified 1270 feature (Fig. 2). Neither of these bands are visible in the ISO-SWS observations of YSO’s (Fig. 9; Gibb et al. 2001). Alternatively, the formation of may not be associated with energetic processing at all. Perhaps and acids like , , , HNCO or even and can be formed by surface chemistry. Whether such relatively large species are formed by surface reactions depends on the extent at which the exothermicity of the reactions can be channeled into translational energy of the products (Brown 1990; Hasegawa et al. 1992). Acid-base reaction and ion formation could also be part of the surface reaction sequence, or be promoted by warm-up or a small amount of radiation (Novozamsky et al. 2001, van Broekhuizen et al. 2003).
While in this view the anions would be undetectable in the solid state, possibly the corresponding acids could be found in the gas phase in the hot cores of star forming regions where the ice mantles evaporate. A search for molecules like , , or in such regions seems therefore warranted.
From the limited sample of objects listed in Table 3 it is unclear whether has different abundances for low and high-mass objects. The low-mass protostar Elias 29 in the Oph cloud has an abundance of 3 %, substantially less than for the high mass sources. However, the other low mass object in our sample, HH100, gives a relatively high abundance of 8 % (albeit with a large errorbar). More observations of the 6.85 m feature of low mass protostars and background field stars are desirable to clarify which dense environments favor the formation of .
In hot core regions where elevated grain temperatures cause sublimation of the icy mantles, large gas phase abundances of ammonia have been found ((1 - 10) 10-6 relative to hydrogen; Blake et al. 1987; Heaton et al. 1989; Cesaroni et al. 1994). This considerably exceeds the abundance of in cold dense regions (/ 10-7; Federman et al. 1990), indicating that ice sublimation is an important source of . However, recent observations failed to detect the 2.21 m feature of towards W33A, indicating that the abundance in interstellar ice may be low ( 5 %; Taban et al. 2003). A high abundance of solid in interstellar ices could alleviate this dilemma, since sublimation of this compound takes place during warm-up upon a reverse acid-base reaction and the re-formation of .
can only be formed from . The presence of solid thus indicates that solid was efficiently formed during the ice accretion, presumably by hydrogenation of atomic nitrogen on the grain surface (Hiraoka et al. 1995). Whether in dense regions gaseous nitrogen will reside in its molecular or its atomic form depends on the depletion of oxygen, since reactions of atomic nitrogen with OH is an essential step towards formation (Charnley & Rodgers 2002). Thus the quantity of that is present in the ices gives important information on the gas phase conditions at the epoch of condensation. Thus probing the strength of the 6.85 m band could become an invaluable tool for studying the chemical conditions associated with the different regions in dense clouds, i.e., quiescent, as well as near embedded high mass and low mass YSO’s.
6 Conclusions
Experiments involving UV photolysis of /// ice mixtures efficiently produce ammonium () together with probably , , and . These ions are produced by acid-base reactions between the and photochemically produced acids. The mode of gives a strong feature at 6.85 m. Other features fall at 3.27 and 3.50 m. Due to strong interaction of the ion with the matrix, the band shifts strongly redward with increasing temperature. The infrared signature of the counterions is very weak for -dominated ices.
Comparison to the 6.85 m feature towards embedded young stellar objects shows that the feature obtained in our experiments provides a good match. The observed red shift of the interstellar band with increasing line-of-sight dust temperature is also consistent with this assignment. Furthermore, features are observed at 3.26 and 3.48 m towards these objects which could be (partly) due to the ammonium ion. The implied abundance of relative to is 3 - 17 %.
The two anions observed in interstellar ices, and (possibly) , are insufficiently abundant to balance the positive charge from the present. Therefore heavier negative ions of the kind formed in our experiments appear to be required. It is yet unclear whether such ions are formed by energetic processing, as in the laboratory experiments, or by grain surface chemistry.
Future laboratory studies should include analysis by mass spectroscopy to exactly define the nature of the photochemically produced acids. Sulfur could be added to the mixture to extend the number of acids that are produced. On the observational side, the assignment could be tested by probing the correlation between the 3.26 and 6.85 m bands. In addition, it would be very interesting to search for rotational emission bands of evaporating acids like , or in hot core regions.
Acknowledgements.
First of all, we thank Marla Moore and Reggie Hudson for their invaluable partnership in this project. We thank Mayo Greenberg, Ruud Grim, Guillermo Muñoz Caro, Richard Ruiterkamp, and Ewine van Dishoeck for stimulating discussions. We furthermore thank Oswin Kerkhof and Jacqueline Keane for their help with the experimental effort. Finally, we thank Erika Gibb, Kris Sellgren, Adwin Boogert and T. Brooke for making the electronic version of their data available to us. The paper greatly benefitted from the comments of an anonymous referee. Careful proofreading of the manuscript by Fleur van Broekhuizen was a great help. One of us (R.K.K.) acknowledges the support of the NASA Goddard Space Flight Center.References
- (1) Allamandola L.J., Sandford S.A., Tielens A.G.G.M., Herbst T.M., 1992, ApJ 399, 134
- (2) Blake G.A., Sutton E.C., Masson C.R., Phillips T.G. 1987, ApJ 315, 621
- (3) Boogert A.C.A., Schutte W.A., Tielens A.G.G.M., et al., 1996, AA 315, L377
- (4) Boogert A.C.A., Schutte W.A., Helmich F.P., et al., 1997, A&A 317, 929
- (5) Boogert, A.C.A., Helmich F.P., van Dishoeck E.F., et al., 1998, AA 336, 352
- (6) Boogert, A.C.A., Tielens A.G.G.M., Ceccarelli C., et al., 2000, A&A, 360, 683
- (7) Boonman A.M.S., van Dishoeck E.F., Lahuis F., Wright C.M., Doty S.D. 2000, in ISO beyond the peaks: The 2nd ISO workshop on analytical spectroscopy, Eds. A. Salama, M.F.Kessler, K. Leech, B. Schulz. (ESA-SP 456), p. 67
- (8) Bregman J.D., Hayward T.L., Sloan G.C. 2000, ApJ 544, 75
- (9) Bregman J.D., Temi P. 2001, ApJ 554, 126
- (10) Brooke T.Y., Sellgren K., Smith R.G., 1996, ApJ 459, 209
- (11) Brooke T.Y., Sellgren K., Geballe, 1999, ApJ 517, 883
- (12) Brown P.D. 1990, MNRAS 243, 65
- (13) Cesaroni R., Churchwell E., Hofner P., Walmsley C.M., Kurtz S. 1994, A&A 288, 903
- (14) Dartois E., Demyk K., d’Hendecourt L., and Ehrenfreund P., 1999a, AA 351, 1066
- (15) Dartois E., d’Hendecourt L., 2001, A&A 365, 144
- (16) Dartois E., Schutte W., Geballe T.R., et al., 1999b, A&A 342, L32
- (17) de Graauw Th., Haser L.N., Beintema D.A., et al., 1996, A&A 315, L49
- (18) Demyk K., Dartois E., D’Hendecourt L., et al., 1998, A&A 339, 553
- (19) d’Hendecourt L.B., Allamandola L.J. Greenberg J.M., 1985, AA 152, 130
- (20) Ehrenfreund P., Kerkhof O., Schutte W.A., et al., 1999, AA 350, 240
- (21) Eiroa C., Hodapp K.-W., 1989, A&A, 210, 345
- (22) Federman S.R., Huntress Jr. W.T., Prasad S.S. 1990, ApJ 479, 818
- (23) Frasco D.L., 1964, J. Chem. Phys, 44, 2134
- (24) Gerakines P.A., Schutte W.A., Greenberg J.M., van Dishoeck E.F., 1995, A&A 296, 810
- (25) Gerakines P.A., Schutte W.A., Ehrenfreund P., 1996, A&A 312, 289
- (26) Gerakines P.A., Whittet D.C.B., Ehrenfreund P., et al., 1999, ApJ 522, 357
- (27) Gerakines P.A., Moore M.H., Hudson R.L., 2000, A&A 357, 793
- (28) Gibb E.L., Whittet D.C.B., Schutte W.A., et al., 2000, ApJ 536, 347
- (29) Gibb E.L., Whittet D.C.B., Chiar J.E., 2001, ApJ 558, 702
- (30) Grim R.J.A., Greenberg J.M., 1987, ApJ, 321, L91
- (31) Grim R.J.A., Greenberg J.M., Schutte W.A., Schmitt B., 1989a, ApJ, 341, L87
- (32) Grim R.J.A., Greenberg J.M., de Groot M.S., et al., 1989b, AAS 78, 161
- (33) Grim R.J.A., Baas F, Geballe T.R., Greenberg J.M., Schutte W. 1991, A&A 243, 473
- (34) Hasegawa T.I, Herbst E., Leung C.M., 1992, ApJS 82, 167
- (35) Heaton B.D., Little L.T., Bishop I.S. 1989, A&A 213, 148
- (36) Hiraoka K., Yamashita A., Yachi Y., et al., 1995, ApJ 443, 363
- (37) Hony S., Van Kerckhoven C., Peeters E., et al. 2001, A&A 370, 1030
- (38) Hudson R.L., Moore M.H., 1998, Icarus, 135, 518
- (39) Hudson R.L., Moore M.H., 1999, Icarus, 140, 451
- (40) Hudson R.L., Moore M.H., 2000, A&A, 357, 787
- (41) Hudson R.L., Moore M.H., Gerakines P.A., 2001, A&A, in press
- (42) Jenniskens P., Baratta G.A., Kouchi A., et al., 1993, A&A 273, 583
- (43) Joblin C., d’Hendecourt L., Léger A., Défourneau D. 1994, A&A, 281, 923
- (44) Keane J.V., Tielens A.G.G.M., Boogert A.C.A., Schutte W.A., Whittet D.C.B., 2001, A&A 376, 254
- (45) Keane J.V., Schutte W.A., Tielens A.G.G.M. 2002, submitted to A&A
- (46) Kerkhof O., Schutte W.A., Ehrenfreund P. 1999, A&A 346, 990
- (47) Khanna R.K., Moore M.H. 1999, Spectrochim. Acta 55A, 961
- (48) Maki A., Decius J.C., 1959, J. Chem. Phys., 31, 772
- (49) McGraw G.E., Bernitt D.L., Hisatsune I.C. 1965, J. Chem. Phys. 42, 237
- (50) Mennella V., Muñoz Caro G.M., Ruiterkamp R., et al., 2001, A&A 367, 355
- (51) Miller A., Wilkins B. 1952, Anal. Chem. 24, 1253
- (52) Moore M.H., Khanna R.K. 1991, Spectrochim. Acta, 47A, 255
- (53) Muñoz Caro G.M., Ruiterkamp R., Schutte W.A., Greenberg J.M., Mennella V. 2001, A&A 367, 347
- (54) Nakamoto K. 1972, Infrared Spectra of Inorganic and Coordination Compounds, John Wiley, p.108
- (55) Novozamsky J.H., Schutte W.A., Keane J.V., 2001, A&A 379, 588
- (56) Russell R.W., Soifer B.T., Puetter R.C., 1977, A&A, 54, 959
- (57) Ryskin Ya.I. 1974, The infrared spectra of minerals, ed. V. C. Farmer (Mineralogical Society, London), p. 137
- (58) Schutte C.J.H., Buys K. 1961, Spectrochimica Acta 17, 921
- (59) Schutte W.A., Tielens A.G.G.M., Sandford S.A. 1991, ApJ 382, 523
- (60) Schutte W.A., Tielens A.G.G.M., Allamandola L.J. 1993, ApJ 415, 397
- (61) Schutte W.A., Greenberg J.M., 1997, AA 317, L43
- (62) Schutte W.A., Tielens A.G.G.M., Whittet D.C.B., et al., 1996a, A&A 315, L333
- (63) Schutte W.A., Gerakines P.A., Geballe T.R., Greenberg, J.M., van Dishoeck E.F., 1996b, A&A 309, 633
- (64) Schutte W.A., Boogert A.C.A., Tielens A.G.G.M., et al., 1999, A&A 343, 966
- (65) Sellgren K., Brooke T.Y., Smith R.G., Geballe T.R., 1995, ApJ 449, L69
- (66) Smith R.G., Sellgren K., Tokunaga A.T., 1989, ApJ 344, 413
- (67) Taban I.M., Schutte W.A., Pontoppidan K.M., van Dishoeck E.F. 2003, submitted to A&A
- (68) Tielens A.G.G.M., Whittet D.C.B. 1997, in I.A.U. Symp. 178: Molecules in Astrophysics: Probes and Processes, ed. E. F. van Dishoeck (Kluwer, Dordrecht), p. 45
- (69) van Broekhuizen F., Keane J.V., Schutte W.A. 2003, in preparation
- (70) Vandenbussche B., Ehrenfreund P., Boogert A.C.A., et al. 1999, A&A 346, L57
- (71) Willner S.P., Gillett F.C., Herter T.L., et al., 1982, ApJ, 253, 174
- (72) Wagner E.L., Hornig D.F., 1950, J. Chem. Phys. 18, 296
- (73) Whittet D.C.B., Schutte W.A., Tielens A.G.G.M., et al., 1996, AA 315, L357