11email: parodi@astro.unibas.ch, binggeli@astro.unibas.ch
Distribution of star-forming complexes in dwarf irregular galaxies
We study the distribution of bright star-forming complexes in a homogeneous sample of 72 late-type (“irregular”) dwarf galaxies located within the 10 Mpc volume. Star-forming complexes are identified as bright lumps in -band galaxy images and isolated by means of the unsharp-masking method. For the sample as a whole the radial number distribution of bright lumps largely traces the underlying exponential-disk light profiles, but peaks at a 10 percent smaller scale length. Moreover, the presence of a tail of star forming regions out to at least six optical scale lengths provides evidence against a systematic star formation truncation within that galaxy extension. Considering these findings, we apply a scale length-independent concentration index, taking into account the implied non-uniform random spread of star formation regions throughout the disk. The number profiles frequently manifest a second, minor peak at about two scale lengths. Relying on a two-dimensional stochastic self-propagating star formation model, we show these secondary peaks to be consistent with triggered star formation; for a few of the brighter galaxies a peculiar peak distribution is observed that is conceivably due to the onset of shear provided by differential rotation. On scales between 100 and 1000 pc, and by taking into account exponential-disk structure, bright lumps reveal cluster dimensions between 1.3 and 2, with a weak trend to higher dimensions for brighter galaxies. Cluster dimension weakly anticorrelates with the lumpiness index (the fraction of the total galaxy light due to the light contributed by the lumps), the latter index showing no dependence on luminosity. Lump spreading within the disk, as measured by the concentration index, and lump clustering, as given by the cluster dimension, are not linked to each other. Interpreting cluster dimension in terms of porosity of a self-similar intragalactic medium, we derive a relation between current star formation rate, scale length, and porosity.
Key Words.:
galaxies: irregular – galaxies: morphology – galaxies: star formation1 Introduction
-
†
References to the published papers of our series on Structure and stellar content of dwarf galaxies: - Bremnes et al. (1998); - Bremnes et al. (1999); - Bremnes et al. (2000); - Barazza et al. (2001); - Parodi et al. (2002).
Dwarf irregular galaxies exhibit peculiar morphologies that are dominated by the flashy but seemingly irregular presence of star-forming regions. Unlike with more massive disk systems that modulate star formation by spiral density waves, dwarf irregulars in the field — or non-interacting irregulars in general — constitute ideal testbeds for the study of genuine processes regulating local and global star formation and consequently of galactic evolution. A review addressing several key questions concerning large-scale star formation in irregular galaxies is given by Hunter (1997), and an evaluation among simple models for the onset of star formation in irregulars is provided by Hunter, Elmegreen, & Baker (1998).
Important clues as to hidden constraints shaping the heterogeneous appearance of dwarf irregular galaxies may emerge from detailed investigations concerning the spatial distribution of star-forming regions (e.g., Feitzinger & Braunsfurth 1984). In recent years several studies on the distribution of H II regions and of young, compact star clusters in late-type spirals and in dwarf irregular galaxies have appeared (Telles, Melnick, & Terlevich 1997; Brosch, Heller, & Almoznino 1998; Elmegreen & Salzer 1999; Heller et al. 2000; Roye & Hunter 2000; Billett, Hunter, & Elmegreen 2002). Applying measures like concentration, asymmetry, and fractional-luminosity indices these authors found the star forming regions to be distributed rather randomly, with some tendency to central concentrations particularly for star-bursting systems.
In this paper we extend these previous studies by analysing the distribution of bright spots or lumps in the -band images of a sample of 72 late-type (“irregular”) dwarf galaxies. The general equivalence of bright lumps in H and in broad band blue images as tracers of star formation complexes can be appreciated by comparing galaxy images filtered at the two corresponding wavelengths (e.g., Elmegreen & Salzer 1999; Sparke & Gallagher 2000, pp. 139 and 229). With our homogeneous and relatively large sample at hand we aim at comparing three morphological indices with each other (as applied to lumps within irregulars), none of which has been previously reported in the form presented here or within our context. Indices often serve as the quantitative counterparts to qualitative physical concepts. In particular, lump spreading within a galaxy may be described by concentration indices of different apertures; lump clustering may be represented by the correlation dimension for the two-dimensional lump distribution; finally, the lumpiness (or flocculency) of a galaxy may be measured by means of some fractional light index. Table 1 gives a summary of terms and indices that will be more carefully introduced in the subsequent sections.
Comparing relations among morphological indices, we may deepen our insights into the various mechanisms responsible for the morphology of irregulars. The interstellar matter of dwarf irregulars with different global properties may be different (e.g., metallicity, mean gas density, turbulence, gravitational potential), implying differences in the conditions for the formation of stars. Thus aspects concerning the abundance and distribution of star-forming regions within the galaxies, like clustering and star formation rates, may turn out to vary correspondingly. We adress this issue by means of the clustering parameter. Another goal of the paper is to contribute to the discussion concerning the influence of shear due to differential rotation on star formation in gas-rich late-type galaxies (Roye & Hunter 2000; Elmegreen, Palouš, Ehlerová 2002). Based on cellular automata simulations we introduce a possible criterium to be checked for in radial lump number distributions; we show that a few of our galaxies indeed meet the criterium, but more research is needed for conclusive results.
The paper is organised as follows. Section 2 gives an overview of the galaxy sample used and presents a table with basic galaxy parameters as well as the parameter values deduced in the subsequent sections. Section 3 describes the adopted lump detection method and introduces a first index, the lumpiness index. Section 4 presents the radial number and number density distributions for the bright lumps of all the galaxies. A concentration index that is normalized according to the galaxies being exponential-disk systems is introduced and applied to the bright lump distribution. We then extensively discuss the possible reason for a peculiarity seen in the lump number distribution, namely the occurence and relative locations of major and minor peaks. In Section 5 we determine the cluster or correlation dimension for the two-dimensional lump patterns, relate it to galaxy absolute magnitude, and deduce a model mean porosity that is linked to the current star formation rate. In Section 6 we check for relations among the three indices introduced in the previous sections. We end with a discussion and the conclusions in Section 7. Image processing was performed throughout within the IRAF111IRAF is distributed by the National Optical Astronomy Observatories; http://iraf.noao.edu. package.
2 The sample
The sample of 72 irregular dwarf galaxies is a compilation of Im, BCD, and late-type S galaxies fainter than mag — dwarf “irregulars” for short — used previously for an analysis of exponential-disk model parameters relating photometric, kinematic, and environmental properties (Parodi, Barazza, & Binggeli 2002). The galaxies are lying in the field or in groups within the nearby 10 Mpc volume. They were imaged with 1.2-m to 1.5-m telescopes with resolutions of 0.39-0.77 arcsecs per pixel and under seeing conditions varying between 0.8 and 4.0 arcsecs. Data reduction was performed consistently by our team along the usual prescriptions. -band galaxy image galleries can be found in Parodi et al. (2002) and the references given therein (or at the bottom of Table 2 in the present paper).
In Table 2 we list basic galaxy data as well as parametric data as
deduced in the subsequent sections. The first nine columns are mostly
taken over from Table 1 in Parodi et al. (2002), while the seven other
columns correspond to results obtained in the present paper. The
columns read as follows:
Columns 1 and 2 give the galaxy name and the galaxy type;
columns 3 and 4 list the -band absolute magnitude and — from
fitting an exponential law to the observed surface brightness profile
— the extrapolated central surface brightness, both corrected for
galactic extinction;
columns 5, 6, and 7 give the -band disk scale length along the
semi-major axis (in parsecs), the radius of the 25th-mag/arcsec2
isophote (in parsecs), and the axis ratio of the elliptical
isophote, respectively;
column 8 lists the rotational velocities of the galaxies as far as
measured. The four entries for the southern hemisphere galaxies
ESO473-G024, IC2038, ESO490-G017, and ESO059-G001 are based on HIPASS
222The HI Parkes All-Sky Survey, or HIPASS, is a 21-cm HI
survey of the southern sky undertaken with a multibeam receiver on the
Parkes telescope in Australia. The one-dimensional spectral data for a
freely choosable position is available for downloading in a variety of
different formats at http://www.atnf.csiro.au/research/multibeam/release/. public
data, treated as in Parodi et al. (2002);
column 9 points to the five published papers of our series with
original and detailed observational and photometric data on the
galaxies. Cf. the reference notes on the bottom of Table 2;
column 10 indicates the number of bright lumps found in residual
galaxy images (Section 3);
columns 11, 12, and 13 give the scale length of the radial number
density distribution of the bright lumps (Section 4.2), the radius of
the highest peak in the radial lump number distribution, and the peak
radius of a possible secondary, minor peak, respectively (Section
4.4) (all lengths in units of scale length );
columns 14, 15, and 16 list the values for the following indices: the
normalized concentration index measured using as the
outer aperture radius (Section 4.3), the reduced cluster (or
correlation) dimension (Section 5), and the lumpiness index (Sections 3 and 6), respectively.
3 Lump detection and lumpiness index
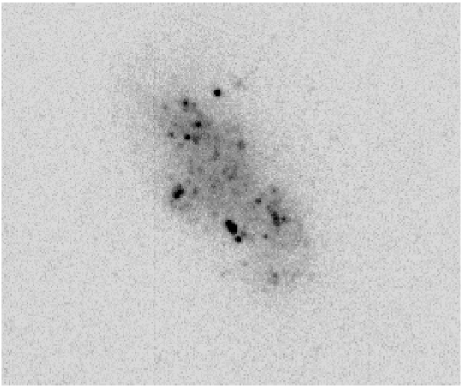
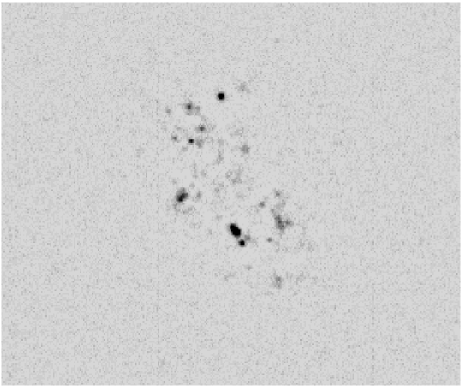
A residual image highlighting bright star-forming complexes — comprising H II regions and young clusters — was constructed by subtracting a smoothed version from the original -band image for each galaxy. To obtain the former image a convenient method is to median filter the original image with a sliding square window. Relying instead on adaptive filtering techniques (i.e., on the IRAF task ADAPTIVE) did not improve on the results, thus we kept applying the simple median filtering method. For the window some characteristic metric size should be chosen: we adopted , with being the effective radius of the galaxy. An example of images processed this way can be seen in Fig. 1. The galaxy shown is ESO 473-G024, with the left frame containing the original image, and the right frame presenting the residual image. From these latter, high-spatial frequency images we extract the following information:
(i) we detect and tabulate the locations of the bright lumps, thus constructing a data base for the distribution analysis below. Detection of bright lumps was done automatically and thus consistently for all galaxies. First, the sky-subtracted residual image is cleaned around and, concerning obvious foreground stars, within the galaxy. The few foreground stars that probably went undetected should have no potential to fake the statistical outcomes of this paper. Second, an appropriate point spread function (PSF) was looked for: a routine checks for the maximum pixel value corresponding to the brightest lump and determines its PSF. It may happen that the brightest lump takes part in a compact cluster of lumps; thus if the PSF’s full-width-at-half-maximum was more than 10 pixels the routine assumed blending and searched for a smaller lump with a narrower PSF. Similarly, if the PSF was very peaky, an overseen foreground star was assumed and a broader PSF was applied for the lump search. Third, this PSF is then used by the IRAF task DAOFIND to search for all other lumps above a detection threshold of 3 sky sigmas. In ESO 473-G024, for example, 22 bright lumps were thus counted. Some galaxies are too fuzzy-looking to have any lumps detected. Finally, lump coordinates are stored in physical units with the center and the major axes of the 25th-mag/arcsec2 isophotal ellipse providing the origin and the axes of the coordinate system; assuming axisymmetry, the lump coordinates will be deprojected to zero ellipticity for all applications. Note that we do not estimate lump luminosities in order to compare lump brightnesses or to provide luminosity functions; for blue luminosity functions of star-forming complexes in spiral and irregular galaxies see Elmegreen & Salzer (1999).
(ii) We determine the galaxy’s lumpiness index . Lumpiness (or flocculency) of a galaxy may be quantified by the high spatial frequency power , pioneered by Isserstedt & Schindler (1986) and recently applied by Elmegreen & Salzer (1999) to spiral and irregular galaxies and by Takamiya (1999) to HDF-N galaxies with the aim of having a galaxy structural parameter at hand that is related to the current star formation rate. Following the notation of Takamiya (1999) it is defined as the ratio of the flux from the bright lumps, , and the total flux of the galaxy, thus
By measureing the total fluxes of the residual and the original images for each galaxy, we obtained the values listed in Table 2. The lumpiness index will be applied below in Section 6.
4 Radial distributions of detected bright lumps
4.1 Number distribution


In Fig. 2 we show for all galaxies of the sample the binned radial number distributions of the detected bright lumps. Histogram bins correspond to concentric elliptical annuli with semi-major axes successively growing by half a scale length and shown out to 8 ; the last bin included in the panels comprises all the detected lumps at radii larger than 7.5 . The number of counts per bin, , is normalized by the largest bin value within 7.5 ; the largest bin value as well as the total number of counts are printed within each panel. This kind of normalization was imposed to minimize the effects of different resolutions and seeing conditions for the following inquiry.
The accumulated radial number distribution for the lumps of all the galaxies, i.e. summing up all the profiles of Fig. 2, is shown as histogram in Fig. 4. The bright-lump distribution of many galaxies thrown together is represented by a radius-weighted exponential distribution that is indicated by the solid line obeying with (cf. Section 4.2). This basically reflects the exponential light profiles of dwarf irregular galaxies in general with, however, a slightly shorter scale length than is seen for the -band continuum light (dashed line). Note that bright lumps or star-forming complexes not only are found way out to large radii, but that they constitute a nice tail in the radial number distribution out to at least six optical scale lengths, a point we come back to in the discussions of Section 7.
The similar exponential structure for two components of the disk is comparable to H II region distributions in other types of exponential-disk galaxies. In intermediate-type spirals (Athanassoula et al. 1993) and in irregular galaxies (Hunter et al. 1998) the azimuthally averaged radial distribution of H II regions follows the stellar light distribution as well. In our dwarf irregular galaxies bright lumps are exhibiting this same behaviour, indicating them to be representative for the distribution of H II regions, as expected. We can put this statement on a still firmer basis tracking down also the radial number density distribution of the bright lumps.
4.2 Number density distribution
Radial number density distributions for the bright lumps are obtained by dividing the number of counts in a given bin by the surface of the corresponding elliptical annulus (cf. Hodge 1969, Athanassoula et al. 1993). The bright-lump number density profiles for our galaxies are shown in Fig. 3. Solid lines represent exponential fits for galaxies with a total of at least 10 detected lumps; their scale lengths are given in each panel in units of -band continuum light scale lengths and are listed in Table 2. For the whole sample we find a mean of
| (1) |
Thus, while the number density distributions of bright
lumps are — at least partially — also exponential, their slopes
are on average steeper than those for the density distributions of the
underlying stellar light. We note that this very same quantitative
behaviour was also observed for the number density distribution of
H II regions in intermediate-type spiral galaxies: Athanassoula et
al. (1993) found , .
Concluding this subsection we state that dwarf irregular galaxies show azimuthally summed-up bright-lump profiles that are quantitatively comparable to those of H II regions in exponential-disk systems. Thus, as expected, bright star-forming complexes largely represent H II regions. In particular, the scale lengths for H II regions, for bright lumps on -band images, and for - and -band continuum light images (Parodi et al. 2002) obey on average the ratio equation , i.e. the older the underlying population the larger the scale lengths. This general trend in star-forming dwarfs has been observed before, and we discuss some implications in Section 7.


4.3 Concentration index
The concentration index of a galaxy is a convenient parameter to quantify galaxy morphology of low- and high-redshift galaxies. It compares the light content for different radial intervals. Various definitions have been used, none of which takes into account the exponential-disk constraint. It is, however, a trivial observation that in scale length-versus-luminosity diagrams the scatter in scale length around the mean relation correlates with the concentration index. To have a scale length-independent concentration index we will explicitely factor in this underlying disk feature. Following Heller et al. (2000) for the sake of comparision, the concentration index is taken as the ratio of the flux or, in our case, the number of complexes within an elliptical aperture of semi-major radius , i.e. from the inner part of the galaxy, to the flux or number of complexes from its outer annulus with inner and outer semi-major radii of and , respectively. Opposite to Heller et al. (2000) — who suspect linear radial distributions of the (flux from) star forming regions — we do not bring the two numbers to an equal-area basis by dividing the outer number of lumps by a factor of three. Instead, we want to relate the measured lump to the corresponding one for an assumed underlying radial number distribution (or, as it is more adequate for lumps, ; see below). We thus normalize our galaxy concentration index with . Expressing the total radius in terms of the disk scale length , , one finds
| (2) |
Thus our normalization constant depends on the chosen outer radius , or , respectively, used to determine the concentration index. On a statistical footing the 72 dwarf irregular galaxies of our sample share the mean ratios in the continuum -band light, where is the effective radius, is the 25th-mag/arcsec2 isophotal radius, and is the radius equivalent to an aperture with 99.5% of the total flux. Theoretically, pure exponential-light decays yield , where the value for was interpolated using the observed mean ratios given above. The fact that our galaxies exhibit on average smaller radii is a consequence of the exponential-disk description being only an approximation; in particular, there is a large fraction of bright galaxies with central light cusps. The appropriate normalization constants corresponding to the above radii are then =0.52, =0.64, =1.23, and =3.01.
With this normalization we expect the concentration indices to be . Deviations from this canonical value provide information on the actual shapes of the profiles. For example, the median values of the concentration indices obtained by Heller et al. (2000) for their dwarf irregular (BCD + LSB) galaxy sample are — corrected to our normalization by adopting their limit and thus applying — (4.23/3)/1.23 = 1.15 and (3.43/3)/1.23=0.93 for the H-flux and the continuum images, respectively. Thus BCD and LSB galaxies are rather well represented by exponential light profiles on large parts. However, the values for the BCDs typically lie above and those for the LSBs below these median values, reflecting the fact that the former galaxies are more actively star forming in the center regions than the latter. Returning to our sample, we arrive at values 0.94, 1.26, 1.32, 1.73 for outer radii 2, 3, 4, 5 , respectively. These values typically being larger than one and even increasing with larger outer radii is due to the normalization used so far that was based on the continuum light scale length .
However, if the lump scale length is used for the normalization instead of , one indeed recovers . This is shown in Fig. 5 where we have plotted the normalized concentration indices of our galaxies for various aperture radii against their rotational velocities, now adopting the mean scale length found for the lumps in Section 4.2. Actually, one would prefer to adopt for each galaxy its particular lump scale length, but given the uncertainties in determining them, we are content with the mean value given in equation (1). Only galaxies with at least five detected lumps are included, leaving about 50 galaxies. Infinite values result for s in the case of no outer-annuli lump detections; in the plots they are included as triangle symbols with values fixed at . Data for the upper right panel is listed in Table 2. The panel’s median values, plotted as dashed lines and ignoring the = cases, are 0.83, 1.24, 0.95, and 1.04. Lying all in the vicinity of one, this is consistent with the annulus-integrated exponential distribution for the summed lump number distribution seen in Fig. 4 out to large radii.
Thus, applying the analytic tool of the concentration index, we have again demonstrated that the radial distribution of star forming regions is non-linear but follows an annulus-integrated exponential distribution. This implies a non-uniform random spread of the star forming regions throughout the disk, which explains the discrepancy found by Heller et al. (2000) between the values for actual galaxies and the lower ones for simulated galaxies with random star formation region positions. Roye & Hunter (2000) pointed out an increased scatter of concentration indices for faster rotating galaxies of their sample. In the upper right panel, data from Roye & Hunter (2000), adopted to our normalization using (assuming =3=3.5) and with a median value of only 0.58, are plotted, too; however, we no longer see this effect in any panel with our larger sample.
4.4 Peak number distribution: shear-enhanced star formation at work?
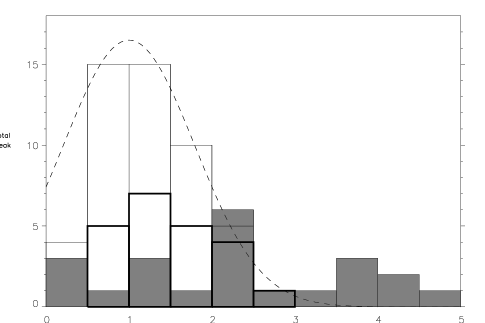
For the sample as a whole the radial locations of bright lumps mirror the exponential intensity distribution of the underlying population. This is, however, only a rule-of-thumb. Individual galaxies may exhibit strong deviations from this mean statistical behaviour (cf. Fig. 2). For example, the primary peak in the radial number distribution (i.e. the bin with the highest value) appears not around one scale length, but is shifted to smaller or higher radii. The histogram for the radial distributions of primary peaks only is shown in Fig. 6, left (thin-lined bars). Only galaxies with peaks corresponding to at least three counts are included. The expected maximum of occurences of primary peaks around one scale length is clearly recovered; a Gaussian with a mean at one scale length and a standard deviation of 1.4 is overplotted as the dashed line. However, another particular feature of individual lump number histograms is the frequent presence of a secondary peak that is lower than the main peak (instead of monotonicly smaller bin heights on both sides of the main peak); this is the case for about a third of our galaxies (cf. Fig. 2). The radii of primary peaks (with at least three counts) and secondary peaks are listed in Table 2; in a few cases of equal height peaks we refered to 0.1 -bin width number distributions to decide which of the peaks is the primary or the secondary one. While the primary peaks of those galaxies exhibiting a second, minor peak as well are crowded around one scale length (thick-lined bars), the corresponding distribution of secondary peaks reveals a pronounced maximum at about two scale lengths (shaded bars).
Is this excess of bright stellar complexes at radii larger than about two scale lengths a statistical fluctuation or is it a manifestation of some underlying mechanism? A candidate mechanism that deserves closer inspection is shearing due to differential rotation within the outer part of the disk. We thus discuss the physical plausibility for the influence of shearing on the generation of star-forming complexes within dwarf galaxies. Two questions will be adressed: First, is shearing in dwarf galaxies a viable mechanism? And second, can it account for the observed peak distribution?
A compilation of 20 high quality dwarf galaxy rotation curves by Swaters (2001) shows them to look much like those of spiral galaxies, with rotation curves rising steeply in the inner parts and flattening in the outer parts. In particular, most dwarf galaxy rotation curves start to flatten around two disk scale lengths, and no dwarf galaxy shows solid-body rotation beyond three disk scale lengths anymore. Concerning our observed occurence of minor peaks in the bright lump distribution, starting at and being most pronounced at about two scale lengths as well, we may wonder whether it is related to the transition from solid-body to differential rotation. Affirmative signals arrive both from theory and simulations. (i) Larson (1983) suggested that the SF rate increases with higher shear rate via the “swing amplifier” mechanism: citing Toomre he points out that shear itself contributes strongly to the growth of gravitational instabilities, leading to gas density enhancements and subsequent star formation. For dIs, however, lacking spiral-density waves, swing amplification may seem an inappropriate mechanism to rely on. (ii) Alternatively, in their review Seiden & Schulman (1990, p. 40) remind that in models for stochastic self-propagating star formation (SSPSF) shearing increases the density of star-forming regions: gas-rich, potential star-forming regions are transported to and mixed with former star-forming regions, giving space for new star formation. (iii) Additionally, while it has been questioned whether shear may cause any visible effect at all given dwarf galaxies being rather slowly rotating systems (Hunter et al. 1998), it becomes more and more evident that some irregular galaxies like the Large Magellanic Cloud or NGC4449 possess regular, large-scale magnetic fields (e.g., Otmianowska-Mazur et al. 2000), and thus it similarly becomes feasible that the magneto-rotational instability (e.g., Balbus & Hawley 1998) comes into play, effectively strengthening the effects of shear. Bearing in mind this possibility, we nevertheless restrain the discussion in the following on the second of these scenarios only.
Self-propagating star formation is observed with many galactic as well within many extragalactic objects. It is thought of as a locally important SF triggering mechanism in all types of galaxies. For example, modulated by density waves, long-lived spiral arms may be formed in bright disk galaxies (Smith, Elmegreen, & Elmegreen 1984); the surface filling factor of bubbles and the locations of molecular rings in observed disk galaxies can be quantitatively explained by SSPSF (Palouš, Tenorio-Tagle, & Franco 1994); age gradients in star-bursting galaxies can be accounted for by means of triggered star formation (Thuan, Izotov, & Foltz 1999; Harris & Zaritsky 1999); and last but not least, the general burst characteristics of compact and irregular dwarf galaxies is long known to partially be understood by means of SSPSF (Gerola, Seiden, & Schulman 1980; Comins 1984).
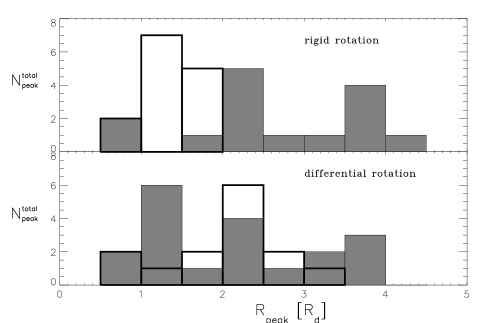
Relying ourselves on a two-dimensional SSPSF model, we numerically tested the hypothesis that the onset of shear-induced star formation around the turnover radius may leave its imprint in an overabundance of SF regions or of bright stellar complexes beyond two scale lengths. In the Appendix we describe the particular implementation. A general finding of our simulations is that the inclusion of shear (i.e. rotation) allows for about five to ten percent more star forming cells, the exact value depending on the particular parameters used. Being mainly interested in the azimuthally summed-up radial distribution of lumps under different rotational conditions, we compare simulation runs with and without a transition to a flat rotation curve. In the top panel of Fig. 6, right, a typical outcome for a simulation of 20 galaxies with rigidly rotating disks is plotted. The highest peaks are found to be located around one scale length, while the secondary peaks show occurences at many radii but with a preference for locations around two scale lengths. This coincides with our observed peak distributions. For comparision, in the bottom panel of Fig. 6, right, a representative peak distribution for a simulation run of 20 galaxies that exhibit a continuous transition from solid-body to (strong) differential rotation at two scale lengths is shown. Interestingly, the primary peaks now occur preferentially at around two scale lengths indicating a strong influence of shear on star formation around the turnover radius. While this is not the general picture observed with our sample, some of the brighter galaxies actually do match this pattern: IC 1959, ESO 154-G023, Ho I, NGC 5477.
We thus conclude that the observed pattern of primary peaks at one scale length manifests the underlying exponential-disk systems, and that the frequent occurence of secondary peaks at about two scale lengths is not necessarily related to the onset of strong shear in rotating disks. As the simulations show, it is however consistent with the idea of triggered star formation based on a stochastic self-regulation scenario. Some of the larger galaxies are exhibiting pronounced primary peaks at two scale lengths but show minor peaks at one scale length; with these galaxies we may be directly witnessing shear-induced star formation. The possible role of bars will be reflected in Section 7.
5 Clustering properties of bright lumps: cluster dimensions on scales of a few 100 pc


Star-forming complexes in dwarf galaxies form non-random point patterns also in a sense different from that discussed in Section 4.3. Their positions correlate according to a self-similar (fractal) arrangement. In this Section we substantiate this claim studying an index devoted to spatial statistics, namely the correlation or clustering dimension, as applied to two-dimensional bright-lump distributions.
As observed by Elmegreen & Elmegreen (2001), the distribution of bright-lump center positions on a kiloparsec scale in spiral and irregular galaxies obey a power-law behaviour similar to the fractal structure of the interstellar gas with fractal dimension . Thus the center positions of star-forming aggregates within isolated areas of large galaxies are fractal. Here we address the question whether star-forming complexes that are scattered over the entire disks of dwarf galaxies are non-randomly distributed as well. We restrict our inquiry to the dwarfs of our sample that exhibit more than 20 bright lumps. Given our photometry with image scales of typically well above 10 parsecs/pixel and seeing conditions of a few pixels we expect to only dissolve structures larger than about 100 parsecs. Thus small-scale clustering and the accompagning blending effects (Elmegreen & Elmegreen 2001) are of no concern to our study. To quantify the spatial clustering of the position patterns we adopt the cumulative distance method (Hastings & Sugihara 1996): a power law relationship is assumed for the cumulative number of points within a distance around each point. If the distribution is (at least partially) self-similar this will be manifested in a - diagram as a straight line with slope , called the cluster (or correlation) dimension,
The more highly clustered the points (at all relevant scales), the lower the cluster dimension. For a random or Poissonian distribution of points on a two-dimensional plane one has , independent of the number of points involved, which only governs the error estimate. The graphs for six observed galaxies with 20-30 lumps and for five galaxies with about 200-300 lumps are shown in Fig.7, left, plotted with thin and thick lines, respectively. For both groups the relevant scaling range, i.e. the straight part of the curve, lies between about 100 () and 1000 () parsecs. The galaxies with lower lump numbers exhibit smaller cluster dimensions () than the galaxies with many detected lumps (). However, plotting versus for all our data (not shown), no clear relation between the two quantities is seen anymore. There nevertheless is a hidden dependence between the two variables: it emerges from the non-uniform distribution of lumps in exponential-disk systems (as discussed in Section 4), and it is to be corrected for. We do so by, first, simulating point patterns with exponential radial number density distributions and indeed are recovering the observed dependence of the cluster dimension on the number of lumps. In particular, accepting a linear regression we obtain . Actually, a function converging asymtotically toward =2 for large lump numbers would be more appropriate; having no clue as to its exact form, though, we stay within the linear approximation. Then, second, instead of using the observed cluster dimensions as inferred from galaxy images, we introduce reduced cluster dimensions defined by , i.e. all measured cluster dimensions are made comparable by formally adjusting them to the common number =0. Other values could have been chosen; however, the adopted value (or other low values, say 50) yields consistently cluster dimensions of about or below the theoretical maximum value of two. We show in Fig.7, right, the reduced cluster dimension as a function of the extrapolated central surface brightness for all galaxies. There is a weak but significant trend that fainter dwarf galaxies exhibit lower cluster dimensions, i.e. more strongly clustered star-forming regions, than brighter dwarf galaxies. The same statement holds if instead of central surface brightness we take the absolute magnitude of the galaxy.
We have also determined the cluster dimensions for 15 selected
sub-galactic areas (consisting of about 30 lumps within a circle of
about 1.5 kpc diameter) within larger galaxies (each with a total of
more than about 200 lumps). With a mean of 1.85 and a
scatter of only about 0.1, these areas show relatively high cluster
dimensions that are typically lying above their galaxies’
values. It furthermore implies that cluster dimensions for local
lump aggregates scatter less than those for entire galaxies.
We now attempt to give an interpretation of the reduced cluster dimension in terms of intragalactic gas porosity and star formation rate. The volume filling factor of the empty or low-density regions of a self-similar medium, the porosity, can be related to the medium’s fractal dimension in three dimensions, , by
where and are the lower and upper boundary of the relevant scaling range (e.g., Turcotte 1992). From Fig.7, left, and as mentioned above, we infer pc and pc. This approach to galaxy porosity is analogous to Elmegreen’s (1997) treatment of fractal interstellar gas clouds, the porosity of which was characterized by , with a maximum density contrast of for the intracloud gas. The two approaches are formally and numerically similar if we identify . Qualitatively, dwarf irregular galaxies may thus be considered as huge star-forming clouds similar to fractal intragalactic star-forming clouds. Solving for the dimension, we obtain
| (3) |
Interpreting Fig.7, right, in terms of galaxy porosity, we have to
take into account that the scaling dimension of a projected
isotropic self-similiar object is one less than the true dimension
(Elmegreen & Elmegreen 2001), thus . We then learn that on average fainter galaxies with on average lower cluster
dimensions, i.e. with stronger clustering properties, are also more
porous (, ) than brighter galaxies
(, ).
Theoretically porosity is thought
to be crucial for the self-regulation of disks, and one expects an
increasing star-formation rate to be accompagnied with decreasing
porosity (Silk 1997, equ. 7). This holds empirically as well, as we
will sketch now. For dwarf irregular galaxies the area-normalized star
formation rate is correlated with the galaxy’s extrapolated central
surface brightness: from Fig. 7a in van Zee (2001) we infer
, with and being the
exponential-model scale length in kpc. On the other hand, an ordinary
least-squares bisector fit (Isobe et al. 1990) to the data of
Fig. 7, right, yields , shown as line in the figure. Equating the two expressions,
inserting equation (3), and remembering , we finally deduce
| (4) |
Within our model treatment of dwarf irregular galaxies being self-similar objects we thus have semi-empirically established a statistical relation between SFR, scale length, and porosity, in the sense that for a given scale length galaxies with higher SFRs are also less porous. Note that for a given scale length, equation (4) predicts a maximum SFR. However, porosity as defined above has to be understood as a conceptual parameter and not as a quantity describing reality in detail. The parameters possibly influencing the mean porosity of a galaxy are manyfold (gas density, gas pressure or velocity dispersion, gas metallicity, supernova energy release), forming an intricate, interdependent parameter set (Silk 1997).
6 Comparing clustering, spreading, and relative luminosity of the lumps

In the course of this paper we encountered three indices, namely the lumpiness index (Section 3), the concentration index (Section 4.3), and the cluster dimension (Section 5). The first one has been introduced only, but has not been applied until now. To make up leeway and to draw some first conclusions, we plot in Fig. 8 the values resulting from applying the three indices against each other. Several distinctive features are present. First, and most notable, the lumpiness index anticorrelates with cluster dimension (upper left panel): the higher the lumpiness index , i.e. the higher the fraction of total galaxy light in the lumps, the smaller the cluster dimension, i.e. the more clustered are the bright lumps. Without plotting the corresponding graphs, we note that the lumpiness index shows no dependence on galaxy luminosity; this is contrary to the behaviour of the cluster dimension. In terms of porosity, this behaviour means that lumpier galaxies are also more porous, and vice versa.
Second, the degree of lumpiness and concentration behave such that the galaxies with the highest values for the lumpiness index all have low values for the concentration index (lower panel). In other words, high fractional lump luminosities come with star-forming complexes that are widely scattered within a galaxy disk. On the other hand, those galaxies with lumps very centrally concentrated, i.e. with 3, come with low fractional lump luminosities, i.e. with low values. This is somewhat surprising because there are BCD- and BCD-like galaxies with central starbursts (high ) that are expected to be very lumpy (high ) at the same time. But indeed, no galaxy with high fractional lump luminosity is observed, not even a BCD galaxy, to be centrally concentrated. This means that even for actively star-forming galaxies the main body of light is still clearly dominated by the total galaxy light. We disclaim a selection bias to the disadvantage of dwarfs with central starbursts in the next section by providing two representative examples.
Finally, no relation seems to hold between concentration index and cluster dimension (right panel). In particular, galaxies with highest lump concentrations present any cluster dimensions. In other words, lump location and the degree of self-similar clustering are independent of each other; this argues, as done in Section 4, for the introduction of some mean galaxy porosity that may vary among galaxies.
7 Discussion and conclusions
Regarding the azimuthally integrated, radial distribution of bright lumps — corresponding to star-forming complexes — in dwarf irregular galaxies, we find them non-uniformly distributed. While in individual galaxies the number distribution is non-monotonic and rugged, the summed-up distribution for all galaxies of our sample manifests the hidden constraint, which is a -distribution closely tracing the underlying older population. More precisely, in terms of radial number density distribution the lumps follow an exponential decay with scale length about 10 percent smaller on average than that of the blue continuum light. This is consistent with studies of the radial distribution of H II regions in intermediate-type spiral galaxies (Athanassoula et al. 1998). The fact that each component of the average disk — from star-forming site number density to surface brightness of the total light — is approximately exponential is a hint that luminous exponential disks are born rather than made, consistent with the accretion scenario for the viscous evolution of galaxy disks (e.g., Ferguson & Clarke 2001). Star-forming complexes in irregular dwarf galaxies can be found out to large radii, as already emphasized by Schulte-Ladbeck & Hopp (1998), Brosch et al. (1998), and Roye & Hunter (2000). The presence of a tail in the accumulated radial number distribution of star forming regions out to at least six optical scale lengths (Fig. 4) indicates that the distributions of dwarf irregulars are truncated at rather low gas density thresholds for star formation. (van Zee et al. 1997, Hunter et al. 1998, Pisano et al. 2000); this seems to be different with many spiral galaxies for which sharp to weak truncations, starting at galactocentric radii of 2-4 near-infrared or 3-5 optical scale lengths, have persistently been reported (e.g., recently, Florido et al. 2001, Kregel et al. 2002, Pohlen et al. 2002).
Beside the presence of main or primary peaks in the radial lump number distribution at slightly less than one optical scale length on average, there is — contrary to the expectations for exponential-disk systems — the frequent occurence of secondary peaks at about two scale lengths. As simple simulations show, it is consistent with the idea of triggered star formation based on a stochastic self-regulation scenario. However, some of the brighter, larger galaxies exhibit pronounced primary peaks at two scale lengths and show minor, secondary peaks around one scale length. For these galaxies with a reversed peak pattern the simulations indicate that shear-induced star formation around the disk’s turnover to differential rotation could be at work; we feel this issue worth a deeper investigation: given a lump statistics based on higher-resolution images and linked to detailed rotational velocity data, and possibly supplemented with information on large-scale magnetic field structures, this may lead to some subtle but decisive insights related to star formation in irregular galaxies. Also, the possible role of bars or bar-like central features should be carefully considered. However, as none of our four galaxies with principal peaks appering around two scale lengths is classified as “barred”, and because Roye & Hunter (2000) did not see a preferential location of H II regions towards the ends of bars in the two candidate galaxies of their sample, we do not consider this mechanism as being effective in shaping the number distribution of lumps.
The observation that the scale lengths are the larger the older the underlying respective population is, goes in hand with the finding that in star-forming dwarf galaxies the oldest populations are also the most extended ones (Gardiner & Hatzidimitriou 1992, Minniti & Zijlstra 1996, Minniti et al. 1999, Harris & Zaritsky 1999). The common interpretation is that of an age-related dispersion of stars. Because dynamical disk heating tends to saturate at a fixed velocity dispersion (Freeman & Bland-Hawthorn 2002) the amount of radial spread introduced by dynamical heating is expected to be larger in smaller galaxies with lower gravitational binding energies (J. Gallagher, private communication). Indeed, the fact noted in Parodi et al. (2002) that with increasing scale length the disk color gradients become systematically less positive and even start being weakly negative when going from dwarf irregular to low-surface brightness and spiral galaxies — which is equivalent to larger galaxies having red-to-blue band scale length ratios below one — seems to support the idea that the extent of the red component decreases as galaxy mass increases. However, for spirals part of this colour trend is most certainly a metallicity effect.
We provide no investigation of the azimuthal lump distribution; where necessary we assumed axisymmetry. Applying different asymmetry indices to dwarf and normal irregulars, Heller et al. (2000) and Roye & Hunter (2000) obtained opposing results that were dependent on the definition of the chosen index (asymmetry as a question of perception). Also, it was found that while the conveniently applied rotational asymmetry index may be used as a first discriminator between (distant) elliptical and spiral/irregular galaxies (Schade et al. 1995, Conselice et al. 2000), this parameter actually is strongly dependent on recent star formation (Takamiya 1999, Mayya & Romano 2001) and thus must be correlated with the lumpiness index as adopted in the present paper. As we have no data for the star formation rate of our galaxies, an immediate comparision cannot be offered, however.
Applying a concentration index that is normalized according to the exponential-disk structure of a mean lump distribution leads to consistent results for varying aperture sizes. It may also remove the discrepancy found by Heller et al. (2000) between the values for actual galaxies and the lower ones for simulated galaxies with random star formation region positions. Roye & Hunter (2000) pointed out an increased scatter of concentration indices for faster rotating galaxies of their sample; we no longer see this effect with our larger sample.
Comparing concentration () with lumpiness () we find the galaxies with a high percentage () of light stemming from the lumps showing low to moderate concentrations (), i.e., galaxies with lumps that are widely scatterd within the disk maintain a higher fraction of the total luminosity (Fig. 8). On the other hand, for very concentrated galaxies () less than about 10 percent of the light is due to the lumps; actually, for these galaxies the values for the lumpiness index fluctuate around the sharp value of 7% attributed to most of the (barred) spiral and irregular galaxies observed by Elmegreen & Salzer (1999). They suggested the similarity of the blue-band light fraction in complexes for several galaxies of different Hubble types and different total luminosities being due to similar star formation efficiencies.
It remains, however, remarkable that galaxies with very high lump concentrations are not among the galaxies showing high luminosity fractions of the lumps (Fig. 8, bottom panel). One may wonder whether some of the nearby, well-known BCDs with central starbursts would agree with this conclusion as well, i.e. whether their central bursts should not dominate the total light content. We therefore examined where the typical starburst dwarf irregular galaxies NGC 1569 and NGC 1705 would fill in the vs. diagram. Based on the 48 brightest central star clusters of NGC 1569 as compiled in Hunter et al. (2000) and adopting a distance of 2.5 Mpc and a galaxy absolute magnitude of mag, we estimate a mere for NGC 1569. Similarly, for the super-star cluster dominated amorphous galaxy NGC 1705, the absolute magnitude for the 7 brightest clusters is about according to the data in O’Connell et al. (1994), whereas the galaxy has a magnitude of at a distance of 5 Mpc, implying only . Thus independent of the exact concentration indices for the brightest clusters, these two small but representative galaxies with central starbursts would not occupy the empty part of the vs. diagram. This means that the empty region in this figure is not a selection effect, but may be related to our adopted procedures in determining the corresponding indices.
While the concentration index is a measure for lump spreading, the cluster or correlation dimension provides information on the scaling behaviour for lump-to-lump distances. We found the lump cluster dimensions — corrected for the effect of radial abundances according to the annulus-integrated exponential distribution — to lie between 1.3 and 2.0 and to gently correlate with extrapolated central surface brightness and absolute magnitude of the host galaxy. At the same time the cluster dimension is weakly anticorrelated with the lumpiness index.

Cluster dimension (or porosity) as introduced in this paper may be intimately linked to the sizes of the largest, kiloparsec-sized lump compounds (Elmegreen et al. 1996) or to the sizes of star-forming, collapsed expanding shells (e.g., Walter 1999). Elmegreen et al. (1996) found the sizes of the largest compounds within spiral and irregular galaxies to approximately scale with the square root of the galaxy luminosity, or, if normalized by the galaxy semi-major axis , small galaxies to have slightly larger relative compound diameters than larger galaxies. This was hypothesized to result from gravitational instabilities with the Jeans length or the mean virial density varying with galaxy luminosity. Walter (1999) suggests the holes in dwarf irregulars to be larger than those in late-type spirals because small galaxies have lower masses and correspondingly lower gravitational potentials and lower ambient ISM gas densities, favoring H I shells to grow larger. Alternatively, we are temptatively interpreting the cluster dimension of a galaxy in terms of the volume filling factor of empty regions in a fractal medium, i.e. in terms of porosity (defined analogous to Elmegreen 1997), and find the following statistical trends: (i) fainter galaxies tend to be more porous; (ii) more porous galaxies also have a lumpier morphology with lower central lump concentrations; (iii) the more porous the galaxy, the lower the star formation rate per kpc2 (equation 4). While these trends are not unexpected, we provide an objective and quantitative statistical treatment of these.
Porosity, or self-similarity, as observed with the bright-lump
distribution within dwarf irregular galaxies reflects the
self-regulated evolution of the interstellar medium, with stellar
feedback and self-gravitation being the main mechanisms. It is thus
not to be confused with the still self-similar pattern of dispersed
stellar aggregates that initially formed from the fractal interstellar
gas, obeying the canonical value of =1.3 for turbulence-driven star
formation (Elmegreen & Elmegreen 2001). Our sub-galactic areas are
showing 1.7, i.e. much higher fractal
dimensions. We suspect that in dwarf irregular galaxies either the
dispersive redistribution of stars is indeed much more effective than
in spiral galaxies (Elmegreen & Hunter 2000), and/or that feed-back
regulation is responsible for the partially randomized position
patterns (e.g., due to the intersection of giant shells).
Acknowledgements.
B.R.P. thanks Helmut Jerjen for introducing him to IRAF and for pointing out the HIPASS data release interface. Valuable recommendations by the referee, J. Gallagher, helped to improve the paper. Financial support by the Swiss National Science Foundation is gratefully acknowledged.Appendix A The SSPSF model
The implementation of the stochastic self-propagating star formation
(SSPSF) disk model is a variant of the prescriptions found in the
reviews of Schulman & Seiden (1986) and, in more detail,
Seiden & Schulman (1990). Major modifications are an exponentiated
initial disk structure, a transition from a linearly increasing to a
flat rotation curve, and the inclusion of spontaneous star
formation. In particular, our model consists of 80 corotating rings,
each with 6R cells, R being the ring number or radius. Thus we have
a total of 18960 cells. Initially, for each ring the number of
occupied cells, , has a probability proportional to a Gamma
distribution , with the scale length taken to be
. On average the galaxies of our sample have a scale length of
about 0.7 kpc, thus the linear size of each cell corresponds to about
44 pc. The polar angles for the cells in a ring are randomly
chosen. At the start there are a total of 300 occupied cells. The life
time of an occupied cell is 10 time steps, corresponding to about 10
Myr. The first time step following the activation of a cell, an empty
neighbouring cell has a probability of 0.21 to become activated
too. This implements the idea that the stellar wind of massive stars
created in a cluster travels with a wind velocity of about 40
km s-1 for about 1 Myr forming an increasingly dense shell
that eventually fragments or hits other overdense regions, thus giving
chance to the formation of new star-forming sites. At each time step,
an additional 20 new cells are spontaneously activated; this sustains
the number-density profile being exponential. Typically, an
equilibrium occupation of around 1400 cells is reached after a few
dozen time steps (providing a filling factor around 0.07), 10 percent
of which having been just activated, and with the number density
distribution remaining rather exponential out to about four scale
lengths; further out there is a rapid drop or truncation of
star-forming regions.
Either the rings rotate rigidly, with
circular velocity being proportional to the ring radius, or
differential rotation may be imposed by additionally demanding a
constant circular velocity beyond a turnover radius . For
the simulations that included shear a flat rotation curve velocity of
500 km s-1 was enforced, which is an unrealistic factor of
10 faster than observed for a typical dwarf irregular. However,
this was only to clearly demonstrate the effect of strong shear within
the model. As long as the circular velocity is much higher than
the radial propagation velocity, shear seems to increase the star
formation rate. For each simulated galaxy the number (and number
density) distribution after 500 time steps was stored for use in the
study of Section 4.4. The lump patterns and their corresponding
distributions for a typical simulated galaxy can be seen in Fig. 9.
Note that we simulate only the occurence of new and the presence of
young stellar clusters, but otherwise assume a prevailing underlying
population of older stars.
References
- (1) Athanassoula, E., García Gómez, C., Bosma, A. 1993, A&AS, 102, 229
- (2) Balbus, S.A., Hawley, J.F. 1998, Rev. Mod. Phys. 70, 1
- (3) Barazza, F.D., Binggeli, B., Prugniel, P. 2001, A&A, 373, 12
- (4) Billett, O.H., Hunter, D.A., Elmegreen, B.G. 2002, AJ, 123, 1454
- (5) Bremnes, T., Binggeli, B., Prugniel, P. 1998, A&AS, 129, 313
- (6) Bremnes, T., Binggeli, B., Prugniel, P. 1999, A&AS, 137, 337
- (7) Bremnes, T., Binggeli, B., Prugniel, P. 2000, A&AS, 141, 211
- (8) Brosch, N., Heller, A., Almoznino, E. 1998, MNRAS, 300, 1091
- (9) Comins, N.F. 1984, ApJ, 284, 90
- (10) Conselice, C.J., Bershady, M.A., Jangren, A. 2000, ApJ, 529, 886
- (11) Elmegreen, B.G. 1997, ApJ, 477, 196
- (12) Elmegreen, B.G., Elmegreen, D.M. 2001, AJ, 121, 1507
- (13) Elmegreen, B.G., Elmegreen, D.M., Salzer, J.J., Mann, H. 1996, ApJ, 467, 579
- (14) Elmegreen, B.G., Hunter, D.A. 2000, ApJ, 540, 814
- (15) Elmegreen, B.G., Palouš, J., Ehlerová, S. 2002, MNRAS, 334, 693
- (16) Elmegreen, D.M., Salzer, J.J. 1999, AJ, 117, 764
- (17) Feitzinger, J.V., Braunsfurth, E. 1984, A&A, 139, 104
- (18) Ferguson, A.M.N., Clarke, C.J. 2001, MNRAS, 325, 781
- (19) Florido, E., Battaner, E. Guijarro, A., Garzón, F., Jiménez-Vicente, J. 2001, A&A, 378, 82
- (20) Gardiner, L.T., Hatzidimitriou, D. 1992, MNRAS, 257, 195
- (21) Gerola, H., Seiden, P.E., Schulman, L.S. 1980, ApJ, 242, 517
- (22) Harris, J., Zaritsky, D. 1999, AJ, 117, 2831
- (23) Hastings, H.M., Sugihara, G. 1996, Fraktale (Spektrum Akademischer Verlag, Heidelberg)
- (24) Heller, A.B., Brosch, N., Almoznino, E., van Zee, L., Salzer, J.J. 2000, MNRAS, 316, 569
- (25) Hodge, P.W. 1969, ApJ, 155, 417
- (26) Hunter, D.A. 1997, PASP, 109, 937
- (27) Hunter, D.A., Elmegreen, B.G., Baker, A.L. 1998, ApJ, 493, 595
- (28) Hunter, D.A., O’Connell, R.W., Gallagher, J.S., Smecker-Hane, T.A. 2000, AJ, 120, 2383
- (29) Isobe, T., Feigelson, E.D., Akritas, M.G., Babu, G.J., 1990, ApJ, 364, 104
- (30) Isserstedt, J., Schindler, R. 1986, A&A, 167, 11
- (31) Kregel, M., van der Kruit, P.C., de Grijs, R. 2002, MNRAS, 334, 646
- (32) Larson, R.B. 1983, Highlights of Astronomy, 6, 191
- (33) Mayya D., Romano, R. 2001, RMxAC, 11, 115
- (34) Minniti, D., Zijlstra, A.A. 1996, ApJ, 467, L13
- (35) Minniti, D., Zijlstra, A.A., Alonso, M.V. 1999, AJ, 17, 881
- (36) O’Connell, R.W., Gallagher III, J.S., Hunter, D.A. 1994, ApJ, 433, 65
- (37) Otmianowska-Mazur, K., Chyży, K.T., Soida, M., von Linden, S. 2000, A&A, 359, 29
- (38) Palouš, J., Tenorio-Tagle, G., Franco, J. 1994, MNRAS, 270, 75
- (39) Parodi, B.R., Barazza, F.D., Binggeli, B. 2002, A&A, 388, 29
- (40) Pisano, D.J., E.M. Wilcots, Elmegreen, B.G. 2000, AJ, 120, 763
- (41) Pohlen, M., Dettmar, R.-J., Lütticke, R., Aronica, G. 2002, A&A, 392, 807
- (42) Roye, E.W., Hunter, D.A. 2000, AJ, 119, 1145
- (43) Schade, D., Lilly, S.J., Crampton, D., Hammer, F., Le Fèvre, O., Tresse, L. 1995, ApJ, 451, L1
- (44) Schulman, L.S., Seiden, P.E. 1986, Science, 233, 425
- (45) Schulte-Ladbeck, R.E., Hopp, U. 1998, AJ, 116, 2886
- (46) Seiden, P.E., Schulman, L.S. 1990, Advances in Physics, 39, 1
- (47) Silk, J. 1997, ApJ, 481, 703
- (48) Smith, G., Elmegreen, B.G., Elmegreen, D.M. 1984, MNRAS, 210, 399
- (49) Sparke, L.S., Gallagher, J.S. 2000, Galaxies in the Universe (Cambridge University Press, Cambridge)
- (50) Swaters, R.A. 2001, in Dwarf Galaxies and their Environment, ed. by K.S. de Boer, R.-J. Dettmar, & U. Klein (Shaker Verlag, Aachen), p. 291
- (51) Takamiya, M. 1999, ApJS, 122, 109
- (52) Telles, E., Melnick, J., Terlevich, R. 1997, MNRAS, 288, 78
- (53) Thuan, T.X., Izotov, Y.I., Foltz, C.B. 1999, ApJ, 525, 105
- (54) Turcotte, D.L. 1992, Fractals and chaos in geology and geophysics (Cambridge University Press, Cambridge), p. 31
- (55) van Zee, L. 2001, AJ, 121, 2003
- (56) van Zee, L., Haynes, M.P., Salzer, J.J., Broeils, A.H. 1997, AJ, 113, 1618
- (57) Walter, F. 1999, PASA, 16, 106