Near-Infrared Observations of Powerful High-Redshift Radio
Galaxies: 4C 40.36 and 4C 39.37 11affiliation: Some of the data presented herein were obtained at
the W. M. Keck Observatory, which is operated as a scientific
partnership among the California Institute of Technology, the
University of California, and the National Aeronautics and Space
Administration. The Observatory was made possible by the generous
financial support of the W. M. Keck Foundation. 22affiliation: Based in part on observations made with the NASA/ESA
Hubble Space Telescope, obtained at the Space Telescope Science
Institute, which is operated by the Association of Universities for
Research in Astronomy, Inc., under NASA contract NAS 5-26555. These
observations are associated with proposal #7860.
Abstract
We present near-infrared imaging and spectroscopic observations of two FR II high-redshift radio galaxies (HzRGs), 4C 40.36 () and 4C 39.37 (), obtained with the Hubble, Keck, and Hale Telescopes. High resolution images were taken with filters both in and out of strong emission lines, and together with the spectroscopic data, the properties of the line and continuum emissions were carefully analyzed. Our analysis of 4C 40.36 and 4C 39.37 shows that strong emission lines (e.g., [O III] 5007 Å and H[N II]) contribute to the broad-band fluxes much more significantly than previously estimated (80% vs. 20–40%), and that when the continuum sources are imaged through line-free filters, they show an extremely compact morphology with a high surface brightness. If we use the -law parametrization, their effective radii () are only 2–3 kpc while their restframe -band surface brightnesses at are 18 mag/″. Compared with 3CR radio galaxies, the former is 3–5 smaller, while the latter is 1–1.5 mag brighter than what is predicted from the correlation. Although exponential profiles produce equally good fits for 4C 40.36 and 4C 39.37, this clearly indicates that with respect to the 3CR radio galaxies, the light distribution of these two HzRGs is much more centrally concentrated. Spectroscopically, 4C 40.36 shows a flat (=const) continuum while 4C 39.37 shows a spectrum as red as that of a local giant elliptical galaxy. Although this difference may be explained in terms of a varying degree of star formation, the similarities of their surface brightness profiles and the submillimeter detection of 4C 39.37 might suggest that the intrinsic spectra is equally blue (young stars or an AGN), and that the difference is the amount of reddening.
4C 39.376C 123239)—radio continuum:galaxies
1 INTRODUCTION
Because of their high luminosities, radio galaxies are extremely useful for studying the process of galaxy formation and evolution at high redshift. Although their substantial luminosities—the very property which makes them so useful—may make them quite atypical of galaxies, whatever is learned for high-redshift radio galaxies (HzRGs) might also be applicable to a much broader spectrum of high-redshift galaxies.
When using radio galaxies as a probe for galaxy formation/evolution at high redshift, the important observations are of the near-IR continuum emission. Although the spectacular morphology of the luminous line-emitting regions attracts our attention, the line-emitting regions do not provide significant information on the underlying stellar populations since they are most likely excited by the central AGN (Rawlings et al., 1989; Willott et al., 1999). On the other hand, the near-IR continuum emission is thought to originate from the underlying stellar population because of the remarkable tightness and continuity seen in the -band Hubble diagram ( relation) of HzRGs as first shown by Lilly & Longair (1984) (for the recent compilations of diagram, see Jarvis et al. (2001) and De Breuck, et al. (2002)). Since the UV continuum is often contaminated by scattered AGN light (e.g., Vernet et al., 2001), the near-IR continuum is the most robust observable from which we can hope to extract information on the underlying stellar populations in HzRGs.
When deriving near-infrared continuum properties of HzRGs such as magnitudes and morphology, it is essential to remove the contribution from the luminous line-emitting regions (e.g., Eales & Rawlings, 1993a). This becomes especially important when observing radio galaxies at , where strong optical emission lines often contaminate - and -band observations. This redshift range is of great interest since HzRGs start to show a dramatic evolution in terms of morphology (van Breugel et al., 1998) and submillimeter luminosity (Archibald et al., 2001), although the -band (i.e., restframe visual) luminosity evolution remains relatively mild (Jarvis et al., 2001).
To study the properties of the near-infrared continuum sources in HzRGs, we have been carrying out a near-infrared imaging and spectroscopic study of HzRGs using the Keck, Hale, and Hubble Space Telescopes (HST) (Armus et al. 1998; Egami et al. 1999; Armus et al. 2002, in preparation). In this paper, we present observations of two FR II radio galaxies, 4C 40.36 at (Chambers, Miley, & van Breugel, 1988) and 4C 39.37 ( 6C 123239) at (Rawlings, Eales, & Warren, 1990; Eales et al., 1993b). These galaxies were chosen for HST/NICMOS observations because their restframe visual emission lines ([O III] and H[N II] for 4C 40.36 and [O III] for 4C 39.37) are redshifted into the narrow-band filters available with HST/NICMOS. Together with the high-quality ground-based data from the Keck and Hale Telescopes, we are able to examine the nature of these galaxies in detail.
To facilitate the comparison with previously published results, we assume , , km s-1 Mpc-1 throughout the paper. With these parameters, 1″ subtends 7.9, and 7.1 kpc for 4C 40.36 and 4C 39.37, respectively.
2 OBSERVATIONS AND DATA REDUCTION
A log of all the observations is presented in Table 1, which lists the telescope/instrument setups as well as observed wavelengths and integration times. Further details are described below.
2.1 HST Near-IR Imaging
The HST near-infrared images were taken with Camera 1 and Camera 2 of the Near Infrared Camera and Multi-Object Spectrometer (NICMOS, Thompson et al., 1998). Both cameras use a 256256 HgCdTe array. The pixel scale is 0043/pixel for Camera 1 and 0075/pixel for Camera 2. The array was read out in the MULTIACCUM mode with an exposure time of 512 seconds per image.
The images were reduced and calibrated with the NICMOS pipeline calibration task CALNICA by running the IRAF command NICPIPE with darks and flats taken with the same camera and readout parameters. The bias drift between readouts and the quadrant-dependent sky/bias level offsets were removed by using the IRAF command BIASEQ and PEDSKY. Once each image was reduced and calibrated, a Chebyshev polynomial of order two was fitted and subtracted from each row and column to remove the baseline slopes. Finally, the DitherII package (Fruchter & Hook, 2002) was used to remove cosmic rays and combine the images. Neither pixel scale change nor image rotation was applied when producing the final dithered images, with which all the photometry and surface brightness profile fitting were done. Pixel scale change and image rotation were applied only when producing figures for visual display.
For the continuum flux calibration, the photometric calibrations of (NIC1; F145M) and Jy (DN/s)-1 (NIC2; F187W) were adopted. The emission line fluxes were calculated from the narrow-band count rates according to the prescription in the HST NICMOS Data Handbook with the photometric calibrations of (NIC1; F164N), (NIC2; F212N), and Jy (DN/s)-1 (NIC2; F215N). The count rates were measured within a 4″-diameter beam.
2.2 Keck Near-IR Imaging and Spectroscopy
The Keck near-infrared images were taken with the Near Infrared Camera (NIRC; Matthews & Soifer 1994) on the Keck I Telescope on Mauna Kea in Hawaii. NIRC uses a Hughes-SBRC 256256 InSb array, and is attached to the f/25 forward Cassegrain focus of the telescope, producing a pixel scale of 015/pixel with a field of view of 38″ on a side.
Low-resolution near-infrared spectra were also taken with NIRC. The slit width was set to 068 (4.5 pixels), which gives a resolving power (R=/) of , and covers a wavelength range of 1–2.4 m in two wavelength settings, m and m. For 4C 40.36, spectra were taken at these two settings while for 4C 39.37, only the longer-wavelength setting was used. The photometric calibration was done by reference to the near-IR standard stars of Hawarden et al. (2001) and Hunt et al. (1998).
For spectroscopy, each target was first acquired by direct imaging through a broad-band filter. The slit was then aligned at a position angle (east of north) of 83 for 4C 40.36 and 140 for 4C 39.37, respectively, which roughly correspond to the position angle of the radio axis. The object was moved by 5″ to five positions along the slit for successive integrations.
The data were processed in a conventional manner. The spectra were corrected for atmospheric features by dividing the spectra by that of a G star observed on the same night and at a similar air mass. The spectra were then multiplied by the blackbody spectrum with an effective temperature corresponding to that of the G star.
The broad-band images show that in these two galaxies with a typical seeing of 0.5″, the 07 slit captures only 50% of the source flux measured in a 4″ diameter beam because of the significant spatial extent of the line-emitting regions. Therefore, the spectra were calibrated such that when summed over the passband of the corresponding broad-band filter, they produced half of the flux measured with a 4″ diameter beam.
2.3 Hale Near-IR Spectroscopy
Moderate-resolution near-infrared spectra were obtained with the long-slit near-infrared spectrograph (Larkin et al., 1996) on the Hale 5-m Telescope at Palomar Observatory. The slit width was set to 07 (4 pixels), which gives a resolving power of 1000 with a full wavelength coverage of 0.1 m. The seeing was estimated to be 05 when the spectra were taken.
Each target was acquired by direct imaging through a 1 % CVF filter at the wavelength of the target line with an integration time of 300 seconds. The slit was aligned at a position angle of 83 for 4C 40.36 and 140 for 4C 39.37. The spectra were taken in pairs, and the object was moved along the slit by 20″ between the two spectra. After each pair, the object was moved by 5″ in one direction, and another pair was taken.
The spectra were corrected for atmospheric features by dividing the spectra by that of a G star observed on the same night and at a similar air mass. The spectra were then multiplied by the blackbody spectrum with an effective temperature corresponding to that of the G star.
Since the sky was not photometric when these spectra were taken, the flux-calibration was done such that the line flux of the brightest line in each spectrum has the value measured in the NIRC spectrum since both the slit size and seeing were very similar.
3 RESULTS
3.1 Morphology
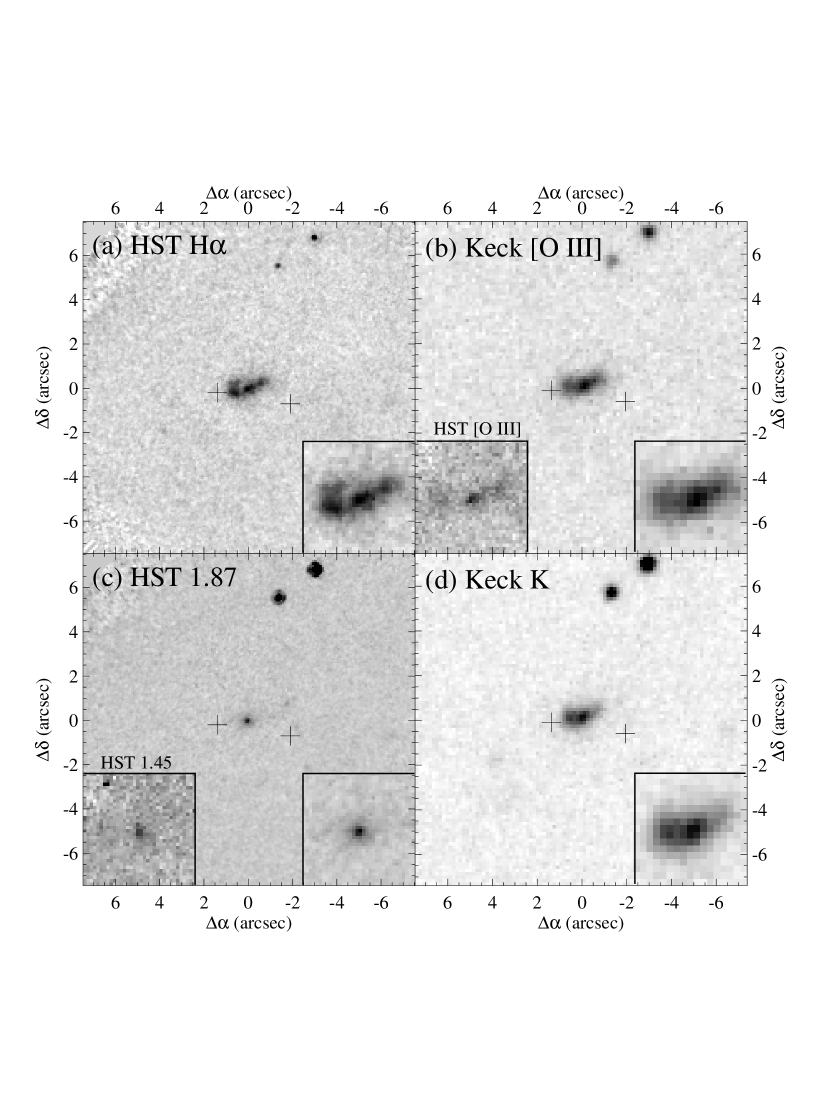
Figure 1 shows the HST and Keck images of 4C 40.36. There is a striking difference in morphology between the line-emitting regions and the line-free continuum source. The H[N II] line-emitting regions (Figure 1a) and the [O III] line-emitting regions (Figure 1b) show a clumpy, nearly linear, filamentary structure while the line-free continuum images taken at 1.45 and 1.87 m (4430 Å and 5720 Å in the restframe) show a much more compact and symmetric source (Figure 1c). A comparison with the -band image (Figure 1d), which contains the H[N II] emission in the passband, clearly indicates that the line emission dominates the -band morphology of 4C 40.36. The line-emitting region extends over 2″ ( 16 kpc) along a position angle of 111° (east of north) with three major knots. The central knot coincides with the continuum source while the other two knots have no detectable continuum emission. Also, the eastern knot shows a significant north-south extension.
A major difference between these near-IR images and the visual images published previously (Chambers et al., 1996) is that the former do not show the strong alignment effect seen in the latter. For example, there is no detectable near-IR flux coming from the location of the western radio peak (the cross to the right in Figure 1), which is seen as a conspicuous second peak in the visual. Furthermore, Figure 1a and 1b clearly show that although both the radio and line emission are extended roughly east-west, there is a significant misalignment between the axes of the two components, with a PA of 81 and 111, respectively. The possibility of such a misalignment was previously noted by Chambers et al. (1996). Because of this, the relation between the radio jets and restframe-visual emission lines is not clear. This also means that our spectra, for which the slit was aligned to the radio axis, will miss a substantial amount of the extended line flux.
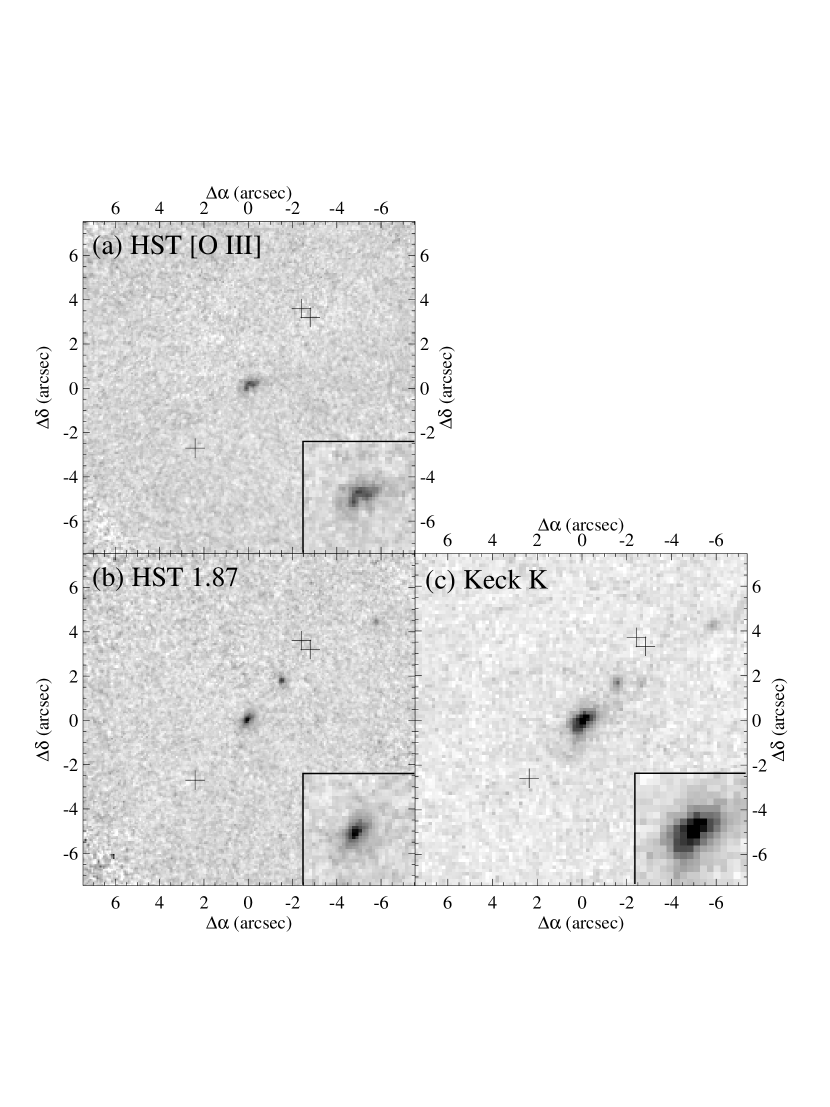
Figure 2 shows the HST and Keck images of 4C 39.37. Again, there is a significant difference in morphology between the [O III] line-emitting regions (Figure 2a) and the line-free continuum (Figure 2b), although the difference is less striking than that of 4C 40.36. The [O III] line emitting region is wedge-shaped while the line-free continuum (4430 Å in the rest frame) is compact and symmetric. The line-free continuum source in Figure 2b shows a significant elongation along PA 139, which is almost the same as the PA of the radio axis.
The continuum, though compact, is spatially extended in both galaxies, as compared to the PSF defined by the stars seen to the north of 4C 40.36 in Figure 1. The surface brightness profiles were computed based on the isophotal ellipse fitting using the ELLIPSE task in STSDAS/IRAF. The center position, ellipticity, and position angle were all allowed to vary. The measured profiles were then fitted with an -law profile and an exponential profile. To find the best-fit model, we subtracted PSF-convolved models from the HST/NICMOS line-free continuum image, and minimized the residual. Once the best model was found, we measured its surface brightness profile by running the ELLIPSE task with the same parameters as those used to measure the profile in the HST/NICMOS image.
Figure 3 shows the results of the surface brightness profile fitting. The profiles have a kink around 04 from the center, which is due to the similar structure seen in the PSF. It can be seen that both the exponential and laws produce acceptable fits. The difficulty of distinguishing these two type of profiles was noted previously with the Keck/NIRC images of HzRGs (van Breugel et al., 1998), and our results show that this difficulty persists even with the HST/NICMOS data to the depth of our images. In the case of 4C 40.36, the exponential-law fit requires a point-source core containing 20 % of the total continuum flux. The best-fit parameters are listed in Table 2.
3.2 Photometry
Table 3 lists the photometric measurements derived from the NIRC and the HST/NICMOS images with a 4″-diameter beam. The pure continuum flux density was measured to be 10 Jy with the three line-free HST filters (F145M and F187W for 4C 40.36; F187W for 4C 39.37), and as shown in the table, the continuum flux accounts only for 20–26% of the broad-band flux measured with the Johnson broad-band filters, whose passbands contain strong emission lines.
Table 3 also shows that the line flux contributes only 7–25% of the broad-band flux. As a result, the sum of the continuum and line fluxes falls substantially short (32–48%) of what is needed to account for the broad-band magnitudes. As shown later, this is due to the mismatch between the filter passbands and line wavelengths/profiles. Although a correction can be made based on the observed line profiles in the spectra, the large loss of the line flux due to the narrow slit width (%) makes such a correction highly uncertain unless the velocity structure is exactly the same in and out of the slit. For this reason, we will not use the narrow-band line images for photometry purposes. This also implies that the relative brightnesses of the line emitting regions seen in the narrow-band images may be significantly affected by the underlying velocity structures.
3.3 Spectroscopy
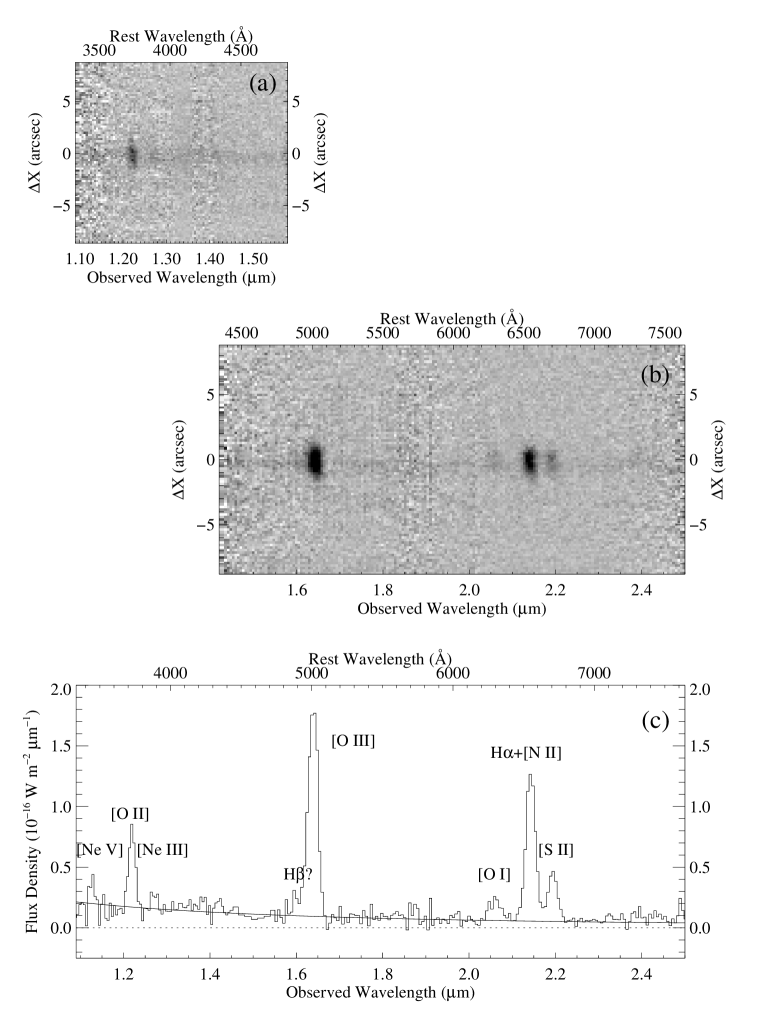
Figure 4 shows the low-resolution Keck/NIRC spectrum of 4C 40.36. The restframe visible spectrum of 4C 40.36 is dominated by strong emission lines as seen in the figure. The lines detected are the classical strong lines seen in the spectra of radio galaxies, [Ne V] 3426 Å, [O II] 3727 Å, [Ne III] 3869 Å, [O III] 4959/5007 Å, [O I] 6300 Å, H[N II] 6563 Å, and [S II] 6716/6731 Å. There is also a possible detection of the H line as a faint wing blueward of the [O III] line. A faint continuum is also clearly detected in the spectrum. The spatial extent of the continuum along the slit is significantly smaller than that of the emission lines, which is consistent with the imaging results. The slope of the continuum is found to be extremely flat in (the solid line in Figure 4c).
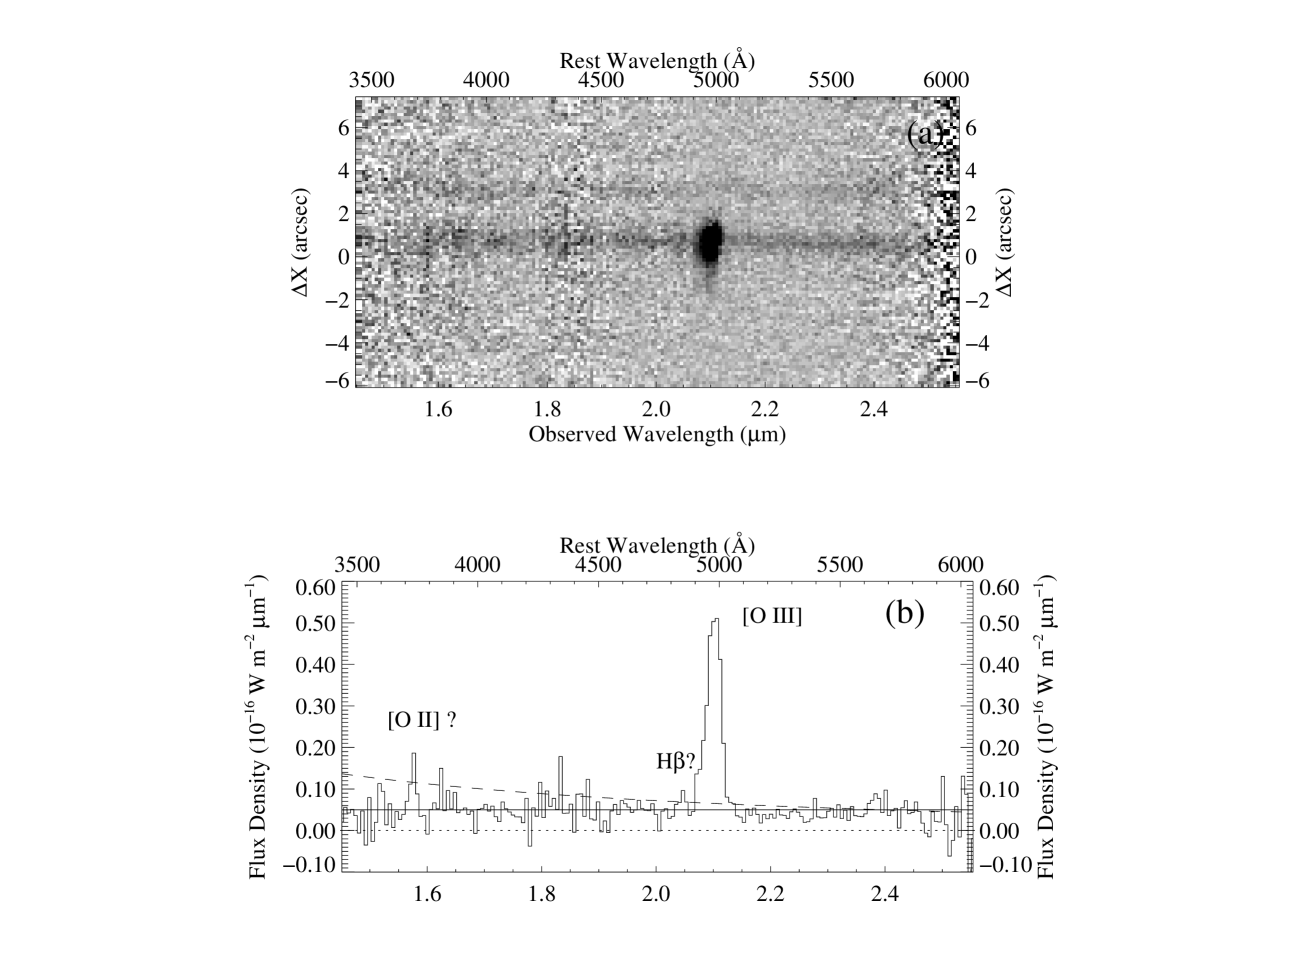
Figure 5 shows the NIRC spectrum of 4C 39.37. It shows a strong [O III] 4959/5007 line, and the line emission is significantly more extended than the continuum. Again, H line might be seen just blueward of the [O III] line. There is also a possible detection of the [O II] line, but this is again uncertain. The continuum slope is significantly redder than that of 4C 40.36 and flat in (i.e., ). Figure 5a also contains the spectrum of a nearby object to north-west (see Figure 2), which does not show any obvious emission line.
Table 4 lists the line fluxes and continuum flux densities measured in the spectra. The continuum flux densities measured here agree well with the values derived with the line-free filters (Table 3), indicating that most of the continuum emission is captured with the 07 slit. This is consistent with the observed compact morphology of the continuum sources. The line plus continuum fluxes here also fall substantially short of that needed to account for the broad-band magnitudes, and this is likely due to the extended nature of the emission lines.
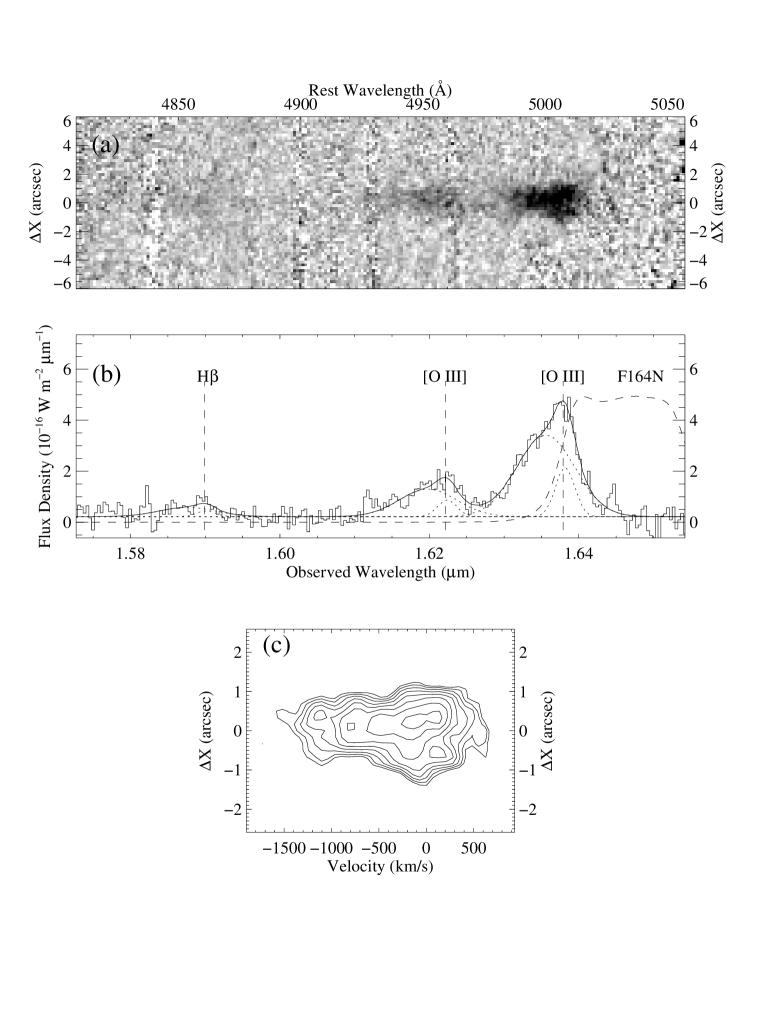
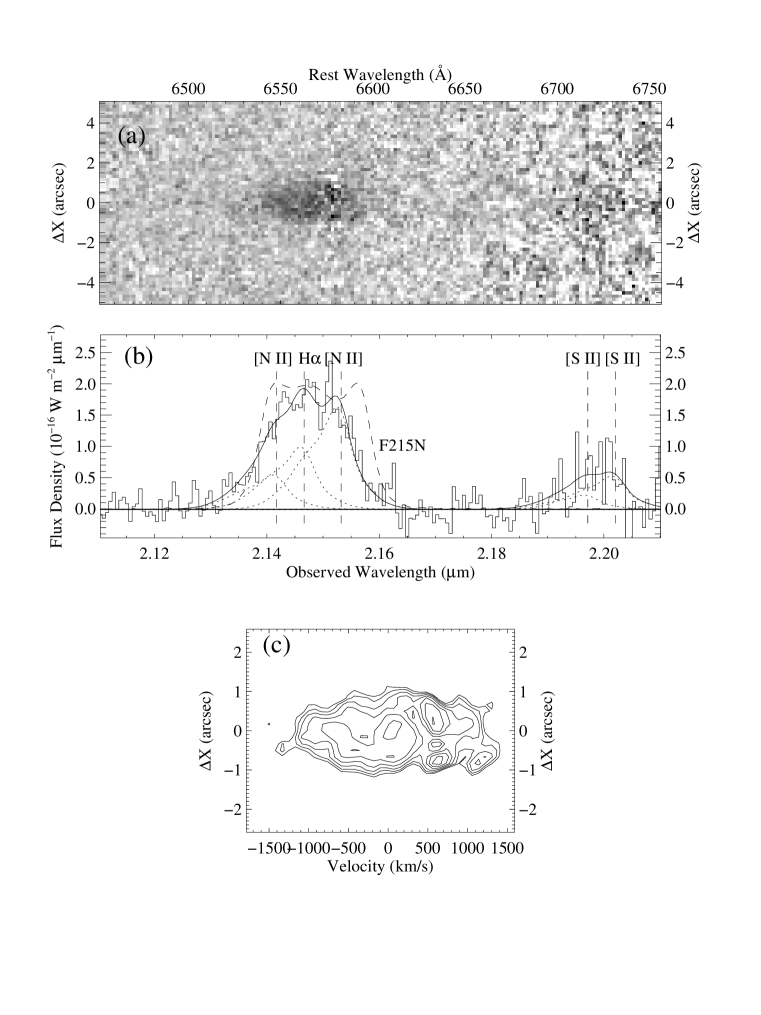
Figures 6 and 7 show the Palomar moderate-resolution () spectra of 4C 40.36 around [O III] and H, respectively. The complex spatial and spectral structures of the lines indicate the multi-component nature of the line emitting regions that is expected from the complex morphology seen in Figure 1. The integrated [O III] line can be characterized by two components: a narrower (FWHM 560 km s-1) component at the systemic velocity and a broader (FWHM 1670 km s-1) blueshifted ( km s-1) component (Figure 6b). The broader blueshifted component of [O III] emerges mainly from the central knot, which coincides with the continuum source (Figure 6c). In the spectrum, a faint H line can also be seen.
To measure the fluxes of various lines, we assumed that each line consists of the two components derived above with a relative flux ratio of 4.9 as seen with the [O III] 5007 Å line. Other constraints imposed were as follows: (1) In the spectrum shown in Figure 6, the wavelengths of the H and [O III] 4959 Å lines were fixed with respect to that of [O III] 5007 Å line. Also, a 1:3 ratio was assumed between [O III] 4959 Å line and 5007 Å lines; (2) In the spectrum shown in Figure 7, the wavelengths of the [N II] and [S II] lines were fixed with respect to that of H. Also, a 1:3 flux ratio was assumed between the [N II] 6548 Å and 6583 Å lines.
In Figures 6b and 7b, we also plot the transmission curves of the NIC2 F164N and F215N filters. From these plots, it was estimated that these filters contain 29% and 83%, of the [O III] and H[N II] line flux, respectively.
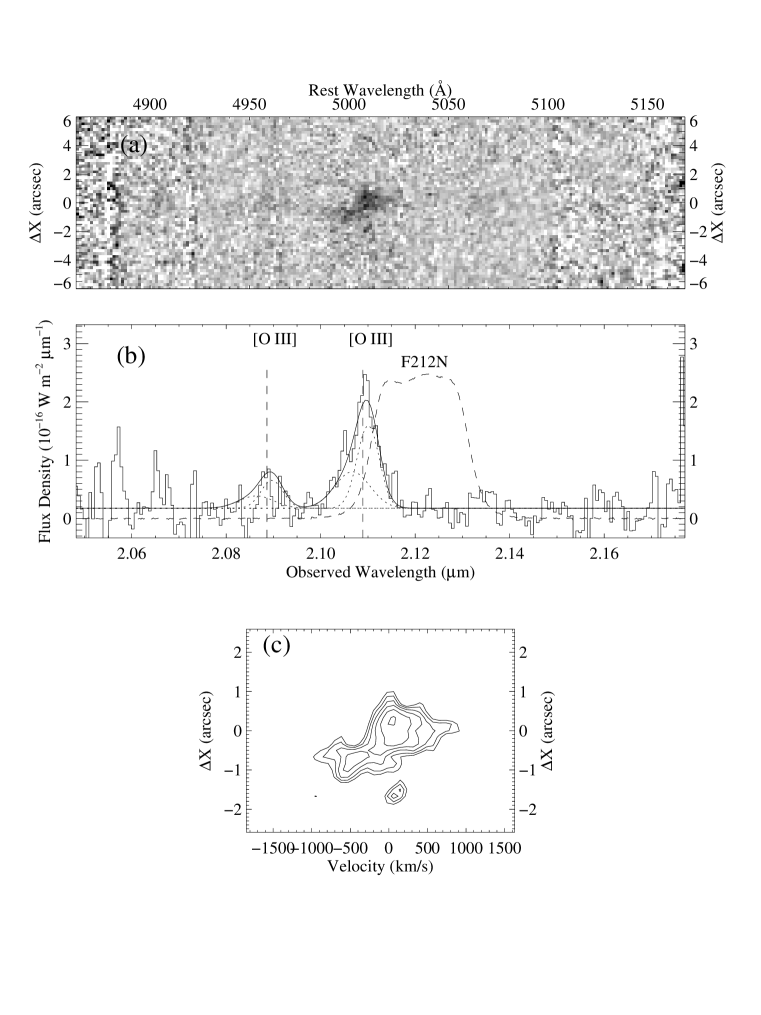
Figure 8 shows the Palomar moderate-resolution spectrum of 4C 39.37 around [O III]. Figure 8c shows that this galaxy has two distinct line-emitting regions separated in space and velocity. The blue component, which is displaced 1″ toward and -500 km/s blueshifted from the main component, fits well with a Gaussian with a central wavelength of 2.107 m and a FWHM of 1230 km/s. With this component fixed (flux was left to vary), another Gaussian was added to fit the overall 5007 Å line profile, which resulted in another component 470 km/s redward with a FWHM of 770 km/s. The [O III] 4959 Å line was fitted with two Gaussians by assuming the same line-component structure and a 1:3 flux ratio with respect to the 5007 Å line.
Again, the narrow-band filter (NIC2 F212N) misses a significant fraction of the [O III] line flux (Figure 8b). It was estimated that 68 % of the [O III] line flux falls outside the F212N filter.
The line parameters derived in the moderate-resolution spectra are listed in Table 5.
4 DISCUSSION
4.1 Emission Lines
4.1.1 Total Flux
As seen in Table 4, the low-resolution spectra basically recover the continuum flux densities similar to those measured in the HST line-free images, but the line fluxes are too small to account for the the observed broad-band fluxes. This is expected since the 07 slit has been found to miss 50% of the broad-band fluxes, most of which is in line emission. About two thirds of the intrinsic line flux is estimated to be missing from the spectra shown in Figure 4 and 5, and when this correction is made, we can recover all the broad-band flux.
Note that the slit-loss corrected line fluxes in Table 4 are a factor of few larger than what we would derive from the narrow-band observations (Table 3) by correcting for the passband mismatch based on the line shapes seen in Figure 6, 7, and 8. This suggests that the line-emitting regions which fell outside our slit have a velocity structure significantly different from those seen in the long-slit spectra.
4.1.2 Contribution to the Broad-Band Magnitude
Table Near-Infrared Observations of Powerful High-Redshift Radio Galaxies: 4C 40.36 and 4C 39.37 11affiliation: Some of the data presented herein were obtained at the W. M. Keck Observatory, which is operated as a scientific partnership among the California Institute of Technology, the University of California, and the National Aeronautics and Space Administration. The Observatory was made possible by the generous financial support of the W. M. Keck Foundation. 22affiliation: Based in part on observations made with the NASA/ESA Hubble Space Telescope, obtained at the Space Telescope Science Institute, which is operated by the Association of Universities for Research in Astronomy, Inc., under NASA contract NAS 5-26555. These observations are associated with proposal #7860. lists our estimates for the contribution of emission lines to the broad-band magnitudes compared with those determined by the previous studies. The estimates can be made in two ways, either from the observed continuum flux densities or from the line fluxes. The estimates based on the continuum fluxes consistently give a line contribution of 70–80% regardless of the observing modes (imaging and spectroscopy), which lends high confidence to these measurements. On the other hand, the estimates based on the line fluxes (we only discuss the spectroscopic results and disregard the narrow-band imaging results) give numbers which are typically a factor of few smaller than the continuum-based estimates, and this is likely due to the loss of source flux falling outside the slit as we have already discussed. The two types of estimates become consistent with each other when a slit-loss correction is made for the latter, which was not applied in the previous studies. Also, the significantly lower signal-to-noise of the previous spectra may have resulted in less accurate spectrophotometry.
4.1.3 Line Ratios and Equivalent Widths
With our data, extinction can be explicitly determined for 4C 40.36 although the value is likely to vary significantly from position to position. The H/H ratio was measured to be 2.5, which is consistent with the Case B no-extinction value within the uncertainty. This suggests very little internal extinction in this galaxy, which is consistent with the extremely flat spectrum seen in the restframe visual. With no extinction correction applied, we find the following values for the diagnostic line ratios for 4C 40.36: [O III](5007)/H 9.1, [N II](6583)/H 1.65, [O I]/H 0.45, and [S II]/H 0.94. These line ratios clearly show that the excitation level of the line-emitting regions is high and comparable to that seen in Seyfert galaxies (Veilleux & Osterbrock, 1987). This is consistent with the previous studies by Iwamuro et al. (1996), Evans (1998), and Carson et al. (2001). Also, the [S II](6716)/[S II](6731) ratio of 0.4 indicates that the electron density of the ionized gas is high ( cm-3). For 4C 39.37, we find [O III](5007)/H 14, again indicating a Seyfert-like excitation.
The equivalent widths of the emission lines are extremely large. Table 4 shows that the restframe equivalent widths measured directly in the spectra are Å with the [O III] 4959/5007 and H[N II] lines; if we correct for the slit loss, these values become 3000–4000 Å. Though abnormally large, comparably large equivalent-width lines have been observed in other HzRGs (e.g., Simpson et al., 1999). In fact, if the line contribution to broad-band magnitudes is % as we derived, emission-line equivalent widths must be this large. It is difficult to produce such large equivalent widths (e.g., W(H) W(H[N II]) 1400 Å in 4C 40.36) by a stellar population unless the population is extremely young, a few Myrs at most based on the instantaneous models in Starburst99 (Leitherer et al., 1999). The strong emission lines of these HzRGs, together with the high excitation level derived from the line ratios, are more likely to be excited by the central AGN.
4.2 Continuum
4.2.1 Surface Brightness Profile and Luminosity
Although slightly extended, the continuum sources in 4C 40.36 and 4C 39.37 are spatially compact. If we adopt the -law fits, the effective radii () are 2.7 kpc for 4C 40.36 and 1.8 kpc for 4C 39.37, respectively. This is a factor of several smaller than those of radio galaxies, kpc, measured by McLure & Dunlop (2000). A similar trend of HzRGs having a smaller effective radius was also found by Pentericci et al. (2001), who reported that the average effective radius of five HzRGs at is 5.4 kpc, based on the measurements of five HzRGs with HST/NICMOS at 1.6 m. The effective radii they derived are somewhat larger than those we do but this difference may be due to the fact that their filter passbands contain emission lines. We also note that two of their five HzRGs have very small effective radii, 1.6 and 1.7 kpc, respectively.
It should be noted that in this discussion, we use the law simply as a parametrization that allows us to compare the continuum sizes of 4C 40.36 and 4C 39.37 with those of radio galaxies. It is not implied here that the surface brightness profiles of 4C 40.36 and 4C 39.37 actually follow the law.
4C 40.36 and 4C 39.37 both appear to have high surface brightnesses compared to radio galaxies. This can be seen in Figure 9, which plots the surface brightness at the effective radius () versus effective radius () in the restframe band. This plot clearly shows that the restframe -band surface brightness of 4C 40.36 and 4C 39.37 are 1–1.5 mag larger than what is expected from the correlation (often referred to as Kormendy relation) of 3CR radio galaxies at (McLure & Dunlop, 2000).
The restframe -band luminosities of the continuum sources in 4C 40.36 and 4C 39.37 turn out to be similar to those of radio galaxies. In the -law parametrization, the total luminosity is proportional to , so the increase of the surface brightness is offset by the decrease of effective radius. The line of a constant luminosity is shown in Figure 9. This results in a very modest, if any, luminosity evolution in the diagram for 4C 40.36 and 4C 39.37. Using the flux density measurements with the F145M and F187 filters, which roughly sample the restframe -band of 4C 40.36 and 4C 39.37, the absolute magnitudes were derived to be 23.3 and mag, respectively. For comparison, the absolute magnitudes of radio galaxies were also derived using the Cousins magnitudes from McLure & Dunlop (2000), which also measure the restframe -band light. The derived value, mag, indicates that the luminosities of 4C 40.36 and 4C 39.37 are consistent with those of the average 3CR radio galaxies.
4.2.2 Spectra
The restframe visual continuum spectra of these two HzRGs are very different. The continuum of 4C 40.36 is almost completely flat (, Figure 4) while the continuum of 4C 39.37 is as red as that of a present day giant elliptical galaxy (, Figure 5). This difference is clearly illustrated in Figure 10, in which the low-resolution NIRC spectra shown in Figure 4 and 5 are further rebinned to bring out the continuum shapes.
The flat restframe visible continuum of 4C 40.36 can be produced by either an AGN or a young ( 100 Mys) stellar population. Vernet et al. (2001) recently detected a significant amount of polarization in the restframe UV continuum of a number of HzRGs, including 4C 40.36, and reported that the scattering efficiency appears almost independent of wavelength. This suggests that the flat restframe visible continuum of 4C 40.36 may be scattered AGN light. On the other hand, there might be a sign of a small Balmer break seen in the spectrum, and if it is real, it would suggest the stellar origin of the flat continuum. A comparison with a GISSEL96 instantaneous burst model111The Simple Stellar Population (SSP) model of the Galaxy Isochrone Synthesis Spectral Evolution Library (GISSEL96) by Bruzual and Charlot (Bruzual & Charlot, 1993) was used. The model used here is the one with the solar metallicity, the Salpeter IMF (0.1–125 M⊙), and theoretical stellar spectra compiled by Lejeune, Cuisinier and Buser (1997) (bc96_0p0200_sp_ssp_kl96 in GISSEL). An instantaneous burst model was selected since it gives the fastest evolution of the mass-to-light ratio, resulting in the maximum estimate for the age and stellar mass. shows that the continuum spectrum can be fitted by the light from a 50–100 Myr old population with a mass of M⊙. This mass, however should be considered as a lower limit since the galaxy might contain a separate population of old stars whose light is masked by that of the young population, but contributes significantly to the total galaxy mass. Recently, the existence of such a young (100–200 Myr) population was also inferred for two other HzRGs, 3C 256 at (Simpson et al., 1999) and 53W002 (Motohara et al., 2001).
The red continuum of 4C 39.37 can be produced by either an old ( 1 Gyr) stellar population or a significant amount of dust reddening an intrinsically much bluer source. If the continuum light is of stellar origin and suffers little reddening, the GISSEL96 instantaneous burst model predicts roughly an age of 0.7–1.4 Gyrs and a mass of 2–3 M⊙. On the other hand, the recent submillimeter continuum detection of 4C 39.37 (Archibald et al., 2001) might support the dust-reddening explanation. The observed 850 m flux density ( mJy) translates into to a restframe 200 m luminosity () of L☉, implying that the far-infrared luminosity of 4C 39.37 is comparable to those of local luminous IR galaxies (LIRGs, L L☉). The total infrared luminosity could be much larger if the dust temperature is significantly higher than 20 K. A large amount of warm dust would then lend strength to the argument that reddening, and not age, is responsible for the shape of the restframe visual spectrum we measure in 4C 39.37.
The amount of reddening necessary to produce the continuum slope of the 4C 39.37 spectrum from a flat spectrum like that of 4C 40.36 (whether it is scattered AGN light or young star light) is mag (Figure 10b), which results in a visual magnitude extinction () of 1.6 mag, using the extinction law of Cardelli, Clayton, & Mathis (1989). Such an amount of extinction could significantly suppress the apparent luminosity evolution of HzRGs in the diagram since the band samples the restframe visual for these galaxies.
4.3 Implications
The small effective radius and high surface brightness of 4C 40.36 and 4C 39.37 (Figure 9) seem to indicate an increased level of activity in the nuclear region of these HzRGs compared with radio galaxies. The nature of the luminosity source, however, remains unknown since there is no clear detection of either stellar or AGN spectral features in the restframe visual continua. The surface brightness profiles, which can be fitted by an law or an exponential law, might be taken as the evidence that the restframe visual light is of stellar origin, but recently there is a suggestion that scattered AGN light may produce a similar surface brightness profile (K. C. Chambers 2002, private communication).
Although our near-IR Keck/NIRC spectra of 4C 40.36 and 4C 39.37 provide vital information on the shape of the restframe visual continuum, it is not possible to distinguish the various possibilities listed above using our data alone. For this, it is necessary to determine the SED of the continuum sources in the restframe UV. For example, two hypotheses for the red continuum of 4C 39.37, an old stellar population vs. dust reddening, are easily distinguishable in the restrame UV because the former would show much less UV emission than the latter based on our estimate on the reddening. Although some visual (restframe UV) data exist in the literature for 4C 40.36 and 4C 39.37, a direct comparison with the near-IR data presented here is difficult because of their poor spatial resolution and strong contamination from the component producing the alignment effect.
5 SUMMARY AND CONCLUSIONS
Using the Hubble, Keck, and Hale Telescopes, we have obtained near-infrared images and spectra of two FR II HzRGs, 4C 40.36 () and 4C 39.37 (). The main conclusions are as follows:
-
1.
The contributions of the [O III] 5007 Å and H[N II] lines to near-IR broad-band magnitudes are found to be 80%, substantially larger than the previous estimates of 20–40% determined for the same galaxies.
-
2.
The continuum sources in 4C 40.36 and 4C 39.37 are extremely compact ( kpc) and of high surface brightness ( mag/″) compared to 3CR radio galaxies. However, their restframe -band luminosities are similar, showing very little luminosity evolution.
-
3.
The continuum spectral shapes of the two HzRGs in the restframe visual are very different: the continuum spectrum of 4C 40.36 is almost completely flat (=const) while the spectrum of 4C 39.37 is as red as that of a local gE galaxy. The origin of the continuum emission is not yet clear since no obvious AGN feature (e.g., a broad line) or stellar feature (e.g., a continuum break) is seen.
-
4.
The difference of the continuum spectral shapes may be explained in terms of a varying degree of star formation as well as different amounts of reddening.
References
- Archibald et al. (2001) Archibald, E. N., Dunlop, J. S., Hughes, D. H., Rawlings, S., Eales, S. A., & Ivison, R. J. 2001, MNRAS, 323, 417
- Armus et al. (1998) Armus, L., Soifer, B. T., Murphy, T. W., Neugebauer, G., Evans, A. S., & Matthews, K. 1998, ApJ, 495, 276
- Bruzual & Charlot (1993) Bruzual, G. A., & Charlot, S. 1993, ApJ, 405, 538
- Cardelli, Clayton, & Mathis (1989) Cardelli, J. A., Clayton, G. C., & Mathis, J. S. 1989, ApJ, 345, 245
- Carilli et al. (1997) Carilli, C. L., Röttgering, H. J. A., van Ojik, R., Miley, G. K., & van Breugel, W. J. M. 1997, ApJS, 109, 1
- Carson et al. (2001) Carson, J. E. et al. 2001, ApJ, 563, 63
- Chambers, Miley, & van Breugel (1988) Chambers, K. C., Miley, G. K. & van Breugel, W. J. M. 1988, ApJ, 327, L47
- Chambers et al. (1996) Chambers, K. C., Miley, G. K., van Breugel, W. J. M., Bremer, M. A. R., Huang, J. -S. & Trentham, N. A. 1996, ApJS, 106, 247
- De Breuck, et al. (2002) De Breuck, C., van Breugel, W., Stanford, A., Roettgering, H., J. A., Miley, G., & Stern, D. 2002, AJ, 123, 637
- Eales & Rawlings (1993a) Eales, S. A. & Rawlings, S. 1993a, ApJ, 411, 67
- Eales & Rawlings (1996) Eales, S. A. & Rawlings, S. 1996, ApJ, 460, 68
- Eales et al. (1993b) Eales, S. A., Rawlings, S., Dickinson, M., Spinrad, H., Hill, G. J., & Lacy, M. 1993b, ApJ, 409, 578
- Egami et al. (1999) Egami, E., Arumus, L., Neugebauer, G., Soifer, B. T., Evans, A. S., & Murphy, T. W. 1999, ASP Conf. Ser. 193: The Hy-Redshift Universe: Galaxy Formation and Evolution at High Redshift, 86
- Evans (1998) Evans, A. S. 1998, ApJ, 498, 553
- Fruchter & Hook (2002) Fruchter, A. S., & Hook, R. N. 2002, PASP, 114, 144
- Hawarden et al. (2001) Hawarden, T. G., Leggett, S. K., Letawsky, M. B., Ballantyne, D. R., & Casali, M. M. 2001, MNRAS, 325, 563
- Hunt et al. (1998) Hunt, L. K., Mannucci, F., Testi, L., Migliorini, S., Stanga, R. M., Baffa, C., Lisi, F., & Vanzi, L. 1998, AJ, 115, 2594
- Iwamuro et al. (1996) Iwamuro, F., Oya, S., Tsukamoto, H. & Maihara, T. 1996, ApJ, 466, L67
- Jarvis et al. (2001) Jarvis, M. J., Rawlings, S., Eales, S., Blundell, K. M., Bunker, A. J., Croft, S., McLure, R. J., & Willott, C. J. 2001, MNRAS, 326, 1585
- Kormendy (1977) Kormendy, J. 1977, ApJ, 218, 333
- Larkin et al. (1996) Larkin, J. E., Knop, R. A., Lin, S., Matthews, K., & Soifer, B. T. 1996, 108, 211
- Leitherer et al. (1999) Leitherer, C. , et al. 1999, ApJS, 123, 3
- Lejeune, Cuisinier and Buser (1997) Lejeune, T., Cuisinier, F. and Buser, R. 1997, A&AS, 125, 229
- Lilly & Longair (1984) Lilly, S. J. and Longair, M. S. 1984, MNRAS, 211, 833
- McLure & Dunlop (2000) McLure, R. J. & Dunlop, J. S. 2000, MNRAS, 317, 249
- Motohara et al. (2001) Motohara, K. et al. 2001, PASJ, 53, 459
- Pentericci et al. (2001) Pentericci, L., McCarthy, P. J., Röttgering, H. J. A., Miley, G. K., van Breugel, W. J. M., & Fosbury, R. 2001, ApJS, 135, 63
- Rawlings, Eales, & Warren (1990) Rawlings, S., Eales, S., & Warren, S. 1990, MNRAS, 243, 14
- Rawlings et al. (1989) Rawlings, S., Saunders, R., Eales, S. A., & Mackay, C. D. 1989, MNRAS, 240, 701
- Simpson et al. (1999) Simpson, C. et al. 1999, ApJ, 525, 659
- Thompson et al. (1998) Thompson, R. I., Rieke, M., Schneider, G., Hines, D. C., & Corbin, M. R. 1998, ApJ, 492, L95
- van Breugel et al. (1998) van Breugel, W. J. M., Stanford, S. A., Spinrad, H., Stern, D., & Graham, J. R. 1998, ApJ, 502, 614
- Veilleux & Osterbrock (1987) Veilleux, S. & Osterbrock, D. E. 1987, ApJS, 63, 295
- Vernet et al. (2001) Vernet, J., Fosbury, R. A. E., Villar-Martín, M., Cohen, M. H., Cimatti, A., di Serego Alighieri, S., & Goodrich, R. W. 2001, A&A, 370, 407
- Willott et al. (1999) Willott, C. J., Rawlings, S., Blundell, K. M., & Lacy, M. 1999, MNRAS, 309, 1017
| Object | UT date | Telescope | Instrument | Filter | Line | Exp time | |
|---|---|---|---|---|---|---|---|
| (m) | (sec) | ||||||
| 4C 40.36 | 1996 September 4 | Keck I | NIRC | 2.01 – 2.44 | 1080 | ||
| [Fe II] | 1.638 – 1.656 | [O III] | 1680 | ||||
| Spectrum | 1.0 – 1.6 | 2000 | |||||
| Spectrum | 1.4 – 2.5 | 2000 | |||||
| 1996 August 1 | Hale | NSPEC | Spectrum | 2.11 – 2.21 | 3600 | ||
| Spectrum | 1.57 – 1.66 | 3600 | |||||
| 1998 September 18 | HST | NIC1 | F164N | 1.637 – 1.655 | [O III] | 7168 | |
| F145M | 1.35 – 1.55 | continuum | 2560 | ||||
| 1998 September 24 | HST | NIC2 | F215N | 2.139 – 2.159 | H[N II] | 7168 | |
| F187W | 1.75 – 2.00 | continuum | 2560 | ||||
| 4C 39.37 | 1996 June 1 | Keck I | NIRC | 2.008 – 2.435 | 900 | ||
| Spectrum | 1.4–2.5 | 4000 | |||||
| 1997 February 22 | Hale | NSPEC | Spectrum | 2.11 – 2.21 | 3600 | ||
| 1998 August 1 | HST | NIC2 | F212N | 2.111 – 2.132 | [O III] | 7168 | |
| F187W | 1.75 – 2.00 | continuum | 3072 |
| Object | law | Exponential law | ||||||||||
|---|---|---|---|---|---|---|---|---|---|---|---|---|
| (″) | ( kpc) | (Jy/″) | ( mag/″)aa In the calculation of the restframe -band surface brightnesses, only the cosmological dimming (in ) was taken into account. This is justified because, (1) for 4C 39.37, the F187W filter passband roughly samples the restframe -band light at , and (2) for 4C 40.36, our NIRC spectra show that its continuum is almost completely flat in . | (″) | ( kpc) | (Jy/″) | ( mag/″)aa In the calculation of the restframe -band surface brightnesses, only the cosmological dimming (in ) was taken into account. This is justified because, (1) for 4C 39.37, the F187W filter passband roughly samples the restframe -band light at , and (2) for 4C 40.36, our NIRC spectra show that its continuum is almost completely flat in . | |||||
| 4C 40.36 | 0.34 | 2.7 | 5.0 | 18.4 | 0.19 | 1.5 | 33 | 16.4 | ||||
| 4C 39.37 | 0.26 | 1.8 | 5.9 | 17.5 | 0.14 | 1.0 | 58 | 15.0 | ||||
Note. — -law profile: ; Exponential profile:
| Object | Filter | Instrument | Continuum | Line | |||
|---|---|---|---|---|---|---|---|
| Name | Line | ||||||
| (Jy) | (%)aa The percentage contribution of the continuum flux to the total flux as measured in the corresponding broad-band filters. The measured flux densities were adjusted to the central wavelength of the corresponding Johnson filter by assuming a continuum shape of for 4C 40.36 and for 4C 39.37. | (10-18 W m-2) | (%)bb The percentage contribution of the line flux to the total flux as measured in the corresponding broad-band filters. | ||||
| 4C 40.36 | F145M | NIC1 | 20 | ||||
| F164N | [O III] | NIC1 | 12 | ||||
| H | NIRC | 100 | |||||
| F187W | NIC2 | 23 | |||||
| F215N | H[N II] | NIC2 | 25 | ||||
| K | NIRC | 100 | |||||
| 4C 39.37 | F187W | NIC2 | 26 | ||||
| F212N | [O III] | NIC2 | 7 | ||||
| K | NIRC | 100 | |||||
| Object | Continuum | Line | Corrected LineaaThe slit-loss correction factors are 3.5 (4C 40.36: [Ne V], [O II], [Ne III]), 2.8 (4C 40.36: [O III]), 2.6 (4C 40.36: [O I], H[N II], [S II]), and 3.1 (4C 39.37: [O III]). These factors were derived by assuming that the slit captures all the continuum flux but only 50 % of the total flux measured within a 4”-diameter beam. | |||||||||
|---|---|---|---|---|---|---|---|---|---|---|---|---|
| Flux | EW | Flux | EW | |||||||||
| (Å) | (m) | (Jy) | (%)bbThe percentage contribution of continuum emission to the corresponding broad-band flux ( or ). | ( W m-2) | (%)ccThe percentage contribution of line emission to the corresponding broad-band flux ( or ). | (Å) | ( W m-2) | (%)ccThe percentage contribution of line emission to the corresponding broad-band flux ( or ). | (Å) | |||
| 4C 40.36 | [Ne V] | 3426 | 1.127 | 2.29 | 0.420.11 | 94 | 1.5 | 329 | ||||
| [O II] | 3727 | 1.219 | 2.27 | 1.370.13 | 306 | 4.8 | 1071 | |||||
| [Ne III] | 3869 | 1.270 | 2.28 | 0.300.13 | 67 | 1.1 | 235 | |||||
| 7.30.6 | ||||||||||||
| H | 4861 | 0.16 | ||||||||||
| [O III] | 4959/5007 | 1.638 | 2.27 | 4.960.09 | 31 | 1458 | 14 | 87 | 4084 | |||
| 9.10.8 | 18 | |||||||||||
| [O I] | 6300 | 2.060 | 2.27 | 0.450.09 | 3 | 166 | 1.2 | 9 | 432 | |||
| H[N II] | 6563, 6548/6583 | 2.143 | 2.27 | 3.240.09 | 24 | 1194 | 8.4 | 61 | 3104 | |||
| [S II] | 6716/6731 | 2.194 | 2.26 | 0.950.09 | 7 | 350 | 2.5 | 18 | 910 | |||
| 13.50.8 | 25 | |||||||||||
| 4C 39.37 | H | 4861 | 0.1 | |||||||||
| [O III] | 4959/5007 | 2.101 | 3.20 | 1.900.03 | 23 | 1210 | 5.9 | 71 | 3751 | |||
| 7.80.5 | 24 | |||||||||||
| Object | Line | FWHM | Observed flux | ||
|---|---|---|---|---|---|
| Å | (km s-1) | ( W m-2) | |||
| 4C 40.36 | H | 4861 | 2.266 | 1670 | 0.34 |
| 2.272 | 560 | 0.07 | |||
| [O III] | 4959 | 2.266 | 1670 | 1.03 | |
| 2.272 | 560 | 0.21 | |||
| [O III] | 5007 | 2.266 | 1670 | 3.10 | |
| 2.272 | 560 | 0.62 | |||
| [N II] | 6548 | 2.266 | 1670 | 0.46 | |
| 2.272 | 560 | 0.09 | |||
| H | 6563 | 2.266 | 1670 | 0.84 | |
| 2.272 | 560 | 0.17 | |||
| [N II] | 6583 | 2.266 | 1670 | 1.39 | |
| 2.272 | 560 | 0.28 | |||
| [S II] | 6716 | 2.266 | 1670 | 0.20 | |
| 2.272 | 560 | 0.04 | |||
| [S II] | 6731 | 2.266 | 1670 | 0.46 | |
| 2.272 | 560 | 0.09 | |||
| 4C 39.37 | [O III] | 4959 | 3.208 | 1230 | 0.19 |
| 3.214 | 770 | 0.27 | |||
| 5007 | 3.208 | 1230 | 0.58 | ||
| 3.214 | 770 | 0.82 |
Note. — Because of the various constraints applied to the spectral line fitting, many of the numbers listed here are not independent. Wavelengths (i.e., redshifts), FWHM widths, and fluxes of some emission lines are fixed with respect to each other. See text for more details on the fitting constraints.
| From Continuum | From Line | ||||||||||
|---|---|---|---|---|---|---|---|---|---|---|---|
| Object | Band | This Work | I96 | This Work | ER96 | I96 | E98 | C01 | |||
| Image | Spectra | Spectra | Slit-loss corrected | ||||||||
| (%) | (%) | (%) | (%) | (%) | (%) | (%) | (%) | (%) | |||
| 4C 40.36 | H | 80 | 82 | 77 | 31 | 87 | 33 | 81 | |||
| K | 77 | 75 | 34 | 88 | 25 | 44 | 54 | ||||
| 4C 39.37 | K | 74 | 76 | 23 | 71 | 30 | |||||