The Ly Forest Around High Redshift Galaxies
Abstract
Motivated by the relative lack of neutral hydrogen around Lyman Break Galaxies deduced from recent observations, we investigate the properties of the Ly forest around high redshift galaxies. The study is based on improved numerical SPH simulations implementing, in addition to standard processes, a new scheme for multiphase and outflow physics description. Although on large scales our simulations reproduce a number of statistical properties of the IGM (because of the small filling factor of shock-heated gas), they underpredict the Ly optical depth decrease inside 1 Mpc of the galaxies by a factor of . We interpret this result as due to the combined effect of infall occurring along the filaments, which prevents efficient halo gas clearing by the outflow, and the insufficient increase of (collisional) hydrogen ionization produced by the temperature increase inside the hot, outflow-carved bubble. Unless an observational selection bias is present, we speculate that local photoionization could be the only viable explanation to solve the puzzle.
keywords:
cosmology: theory - cosmological simulations, intergalactic medium, quasar spectra1 INTRODUCTION
Galaxies form from the intergalactic medium (IGM), process such gas
into stars, and possibly re-eject a fraction of it, enriched by
nucleosynthetic products, back into the intergalactic space via
powerful supernova-driven outflows (Mac Low & Ferrara 1999;
Ferrara, Pettini & Shchekinov 2000;
Madau, Ferrara & Rees 2001; Scannapieco, Ferrara & Madau 2002;
Theuns et al. 2002).
The energy deposition connected to these processes is expected
to leave at least some detectable imprints on the physical state
of the IGM. Thus, it is conceivable that such signatures can be studied
through QSO absorption line experiments. Naively, the presence of
hot outflowing gas should result primarily in two effects:
[i] a decrease of the gas density and [ii] an increase of the
temperature caused by shock-heating (acting in conjunction with
photo-heating by the UV background) in a large (several hundreds
kpc) region around the perturbing galaxy. Both these occurrences would
imply an increasingly more transparent Ly forest when
approaching the galaxy, i.e. a galactic proximity effect.
Quantitative confirmation
of this scenario has faced tremendous difficulties, standing
the complications of the physics of star formation, explosions and
metal mixing in multiphase media. Hence, most simulations to date
had to rely on ad hoc recipes for such processes.
Nevertheless, these ideas have stimulated the first
challenging observations aimed at detecting the imprints of
galaxy-IGM interplay.
Adelberger et al. (2002, A02) obtained high resolution spectra of 8 bright
QSOs at and spectroscopic redshifts for 431 Lyman-break
galaxies (LBGs) at lower redshifts. By comparing the positions of the
LBGs with the Ly absorption lines in QSO spectra, indeed
they conclude that within (comoving) Mpc of the galaxies
little H is present; on the contrary, between 1
and 5 Mpc an H excess with respect to the IGM mean is detected.
This simple interpretation might be at odd with the results of a
VLT/UVES study of the Ly forest in the vicinity of the LBG MS1512-cB58
showing the opposite trend (Savaglio et al. 2002), i.e. an
absorption excess close to the galaxy.
Numerical simulations have also noticeable difficulties reproducing
A02 results as discussed by Croft et al. (2002) and Kollmeier et al. (2002);
however, these studies lack a self-consistent treatment of
multiphase gas structure and/or outflow dynamics.
Here we revisit A02 results through SPH simulations
(Marri et al. 2003) that
implement a new scheme for multiphase hydrodynamics and, more importantly,
a physically meaningful outflow treatment; the full description
of the code and of the tests made are given in Marri & White (2002).
We then derive synthetic absorption line spectra along lines of
sight randomly traced through the simulation box at
and compare them directly with A02 data to investigate
galactic feedback effects on the IGM.
2 Simulations and data analysis
We have performed hydrodynamic simulations for a
CDM cosmological model with , ,
and km s-1 Mpc-1. The initial power
spectrum is cluster-normalized (); periodic boundary conditions are
adopted.
We first obtained a set of low-resolution runs ( particles for both gas
and dark matter) in a comoving Mpc cube;
these runs serve as a guide for more computationally expensive runs and
for testing purposes. We consider a first model where the IGM
multiphase structure and galaxy outflows are deliberately ignored
and a second one which includes a description of both these physical effects.
We will refer to these runs as sph and mfb , respectively, with the
same meaning (and parameters) adopted in the description of the
low-resolution
CDM test problem described in Marri & White (2002).
The high-resolution run, on which the main results of the present
analysis are based,
is a particles simulation in a comoving Mpc
box. For this run we only studied the full mfb model.
Softening lenghts are fixed both in physical and comoving coordinates
as required in GADGET (Springel, Yoshida & White 2001). Gas (dark matter)
gravitational softening is approximately kpc ( kpc) comoving
and kpc ( kpc) physical in
the high-res case and scales according to particle number and
box size in the low-res run.
In all runs we include the effects of a UV background produced by QSOs and
filtered through
the IGM, whose shape and amplitude are taken from Haardt & Madau (1996).
2.1 Synthetic Ly forest spectra
To allow a direct comparison of simulation results with observational data we construct synthetic Ly spectra from simulation outputs at redshift () for the low-res (high-res) runs. In the simulation box we randomly trace 60 lines-of-sight (LOS) parallel to the -axis, each of which is discretized into pixels. In order to assign to each pixel a value for the hydrogen density, temperature and peculiar velocity we perform a standard SPH smoothing using the 32 closest neighbour SPH particles to the LOS pixel position. The neutral hydrogen density is derived using the code CLOUDY94111http://nimbus.pa.uky.edu/cloudy/ on each pixel, adopting the same UVB as in the simulation. The transmitted flux due to Ly absorption in the IGM is , where is the optical depth along the considered LOS. The Hubble velocity varies in the range (0,), where the maximum value is set by the box size. The contribution to at the observed frequency corresponding to , where is the pixel index, is given by
| (1) |
where is the pixel size, is the Ly cross section, is the
Ly oscillator strength,
is the Ly wavelength, and
are the H number density, the Doppler parameter, and the total velocity in the
pixel , respectively; is a gaussian line profile and is the peculiar
velocity. For additional discussion on this formula, see e.g. Rauch, Haehnelt & Steinmetz (1997a).
To compare observations and simulations at best it is necessary to degrade the synthetic spectra
to account for the uncertainties affecting the observed spectra.
We perform such procedure through the following steps: i) continuum normalization
at the highest flux value in each spectrum;
ii) convolution with the instrumental profile; iii) sampling due to spectrograph
spatial resolution; iv) addition of instrumental noise (see Rauch
et al. 1997b;
Theuns et al. 1998; McDonald et al. 2000; Petry et al. 2002).
As most of the data we compare with are taken with the Keck/HIRES
spectrograph we adopt the following instrumental characteristics:
FWHM km s-1, pixel spectral resolution Å
and signal-to-noise ratio S/N=50. The low (high) resolution box
has a wavelength extent of Å
(Å); hence, degraded spectra in
the two cases are made of 269 and 417 pixels, respectively.
3 Results
As a general sanity check of the simulations we have first confronted
the simulated statistical properties of the Ly forest with
the observed ones. The most obvious comparison involves the
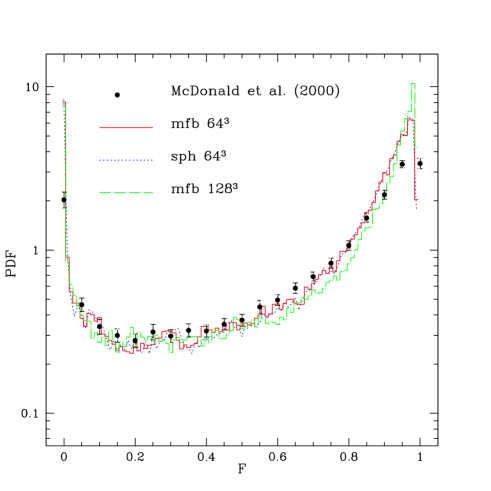
probability distribution function (PDF) of the transmitted flux.
In Fig.1 we plot the PDF as a function
of the flux for the low-res
(both mfb and sph runs) and high-res
simulations (mfb case only) and compare them with the
observational data of McDonald et al. (2000).
The general agreement is quite good through all the flux range
and for all three cases.
The discrepancy between simulations and data at high fluxes
is probably due to the uncertainties in the data continuum fitting
(McDonald et al. 2000; Croft et al. 2002).
Surprisingly, it appears that the inclusion of multiphase
and outflow physics, not considered in the pure sph run, does not
affect the distribution in a sensible manner. In other words,
galactic outflows leave the Ly forest unperturbed.
This result is in agreement with that recently found by Theuns et al. (2002),
who interpreted it as an indication that galactic outflows tend to propagate
preferentially in the voids leaving the Ly absorbing filaments virtually
unaffected.
As an additional check we have calculated the Doppler parameter, ,
and the H column density distribution,
and compared them with two QSOs observations at and
by
Hu et al. (1995).
The values of and for each absorber in the synthetic
spectra have been derived using the fitting programm AUTOVP.
The experimental distribution is well reproduced both by the
sph and mfb (low-res + high-res) runs at similar quality level
(simulated and observed distributions peak both around km s-1).
However, simulated spectra
tend to slightly overproduce lines with km s-1 and under-predict
lines with km s-1. A similar effect has already been
noted by Theuns et al. (1998). These authors propose a number of possible
explanations for this behavior: physical (HeII reionization, radiative transfer effects),
numerical (resolution) and related to data analysis (fitting procedure). Our
results seem to indicate that numerical artifacts should not be the dominant factor.
As for the H column density distribution, the mfb case seems to
reproduce the observational data for somewhat
better; for smaller values of the differences between the two runs
are negligible.
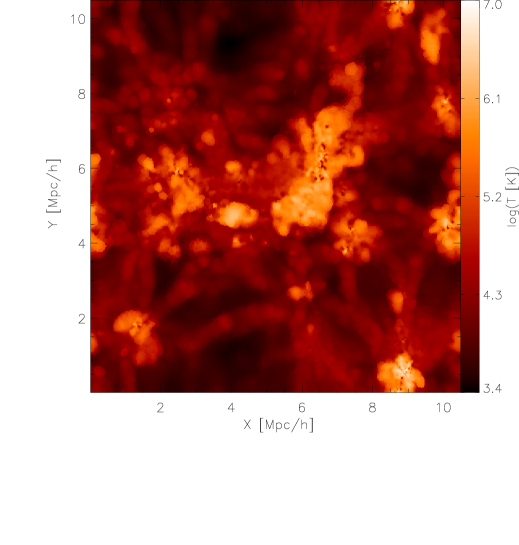
In Fig.2 we show a temperature map from a slice through the high-res box at . Hot bubbles ( K) of shocked gas produced by outflows around the parent galaxies are clearly apparent. Their sizes range from Mpc to Mpc , and their shape appears in some case rather jagged as a result of the interaction with the inhomogeneous ambient medium. The volume filling factor of gas with temperature above K is 14%. The internal structure of the bubbles can be inspected more quantitatively in Fig.3, where the comparison between sph and mfb is shown (low-res case) for various physical quantities (hydrogen density, , ionization fraction, , gas temperature, T, and peculiar velocity, ) along the LOS through the center of the most massive galaxy in these simulations; the galaxy position corresponds to the density peak at Mpc . In both simulations the star formation rate in this galaxy is 5.6 (18 ) for the mfb (sph ) models. A striking result of the comparison between the two models shows that, although outflows are able to heat the halo/IGM gas up to high temperatures out to more than 1 Mpc from the galaxy, they do not seem able to modify its density structure in a sensible way. Hence the density in the surroundings remains high and close to that set up by the process of galaxy formation. Close to the galactic center the outflow peak speed is about km s-1, but this value rapidly decreases as kinetic energy is used to counteract the pressure of intergalactic accreting gas, raining onto the galaxy at essentially the escape speed of the system, roughly km s-1. The stalling radius is seen at the zero-crossing of , approximately 0.3 Mpc away from the outflow source. The relative insensitivity of the density to the SN energy injection can be interpreted as the fact that the outflow velocities are lower than the escape speeds and hence the flow is confined by inflow.
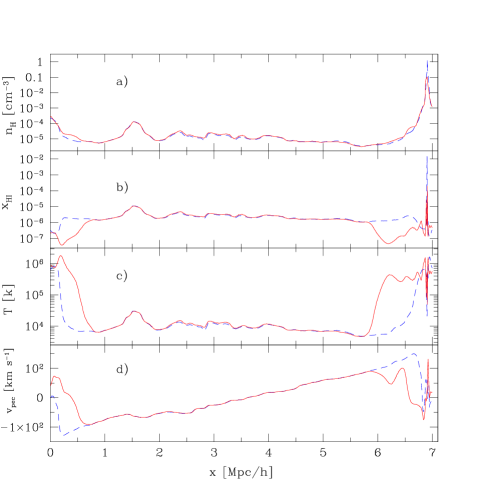
Also, we note that the outflow velocities we find are lower than those inferred
by A02, km s-1 from LBGs.
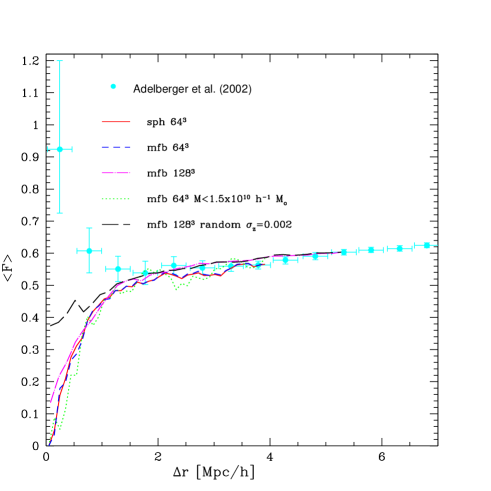
Fig.4 shows the mean Ly forest flux averaged on pixels on
different LOS at different distances, , from the galaxy centers in the simulation box,
following the same experimental procedure as in A02:
| (2) |
where is the number of pixels that fall in the bin , and is the transmitted flux in the pixel . The synthetic data, normalized to the observational ones, are plotted only out to a distance Mpc for the low-res simulations ( Mpc for high-res one) due to the periodic boundary conditions of the simulation. We first compare the two low-res sph and mfb cases. The difference between these curves is negligible and on average the Ly absorption is similar: this is expected after the results analyzed in Fig. 1. In addition both simulations are in agreement with the high-res one, thus ensuring that numerical convergence has been reached and results are not affected by spurious effects. However, these models fail in reproducing the observed trend inside 1 Mpc . The simulated Ly forest seems to be much more opaque than the observed one, with a maximum discrepancy of about a factor 2.2. In order to assess if the disagreement could be reduced by a more efficient outflow clearing of the halos of smaller systems, we excluded the contribution of most massive galaxies () to the flux. However, as it is seen from the Figure, this does not solve the problem. As a final resort, we have randomized the position of galaxy centers in the box to account for the reported experimental error determination. To this aim we have added a gaussian random displacement to the redshift of each galaxy with r.m.s. , which represents the 1- error of the measure. This procedure improves the result, as now galaxy centers do not perfectly coincide with density peaks, but to an extent insufficient to explain the data.
4 Conclusions
Motivated by the recent observational results of A02,
we have studied, with the help of a set of cosmological simulations including
star formation in multiphase gas and outflows from galaxies, the effects
of galaxy formation/activity on the properties of the surrounding Ly forest.
Although on large scales our simulations can reproduce remarkably well a number
of statistical properties of the IGM, they fail to predict the observed
Ly flux increase in regions close to the galaxies themselves. The success
can be ascertain to two concomitant effects: (i) outflows preferentially
expand in regions of low-density (voids) thus preserving the filaments
responsible for the Ly absorbing network; (ii) the hot bubbles
fill a relatively small fraction of the cosmic volume (%
in our simulations).
Support to the first hypothesis emerges also from an inspection of
the velocity field in the surrounding of the most
massive galaxy in the simulation:
the inflow of gas from low density
regions is blocked by the bubble expansion, but it proceeds basically
unimpeded along the filaments (see Marri et al. 2003).
Much more puzzling is instead
the reason for the opacity excess (with respect to real data) we see in
the simulation in the inner Mpc . Apparently, simulated outflows do not
carry sufficient momentum to disperse the density peak created in the vicinity
of the galaxy as a leftover of its formation. Also, a large fraction of the
outflow energy is used
to counteract the infalling gas ram pressure which tends to pile up the
gas into the galaxy. The temperature increase close to galaxies amplifies
the magnitude of the collisional ionization rate, which becomes larger than
the equivalent photoionization rate for K. In this case
the H neutral fraction is independent of gas density and remains at roughly
the same level as in the general IGM. Therefore, collisional ionization is not
sufficient to balance the opacity increase induced by the density raise and the
transmitted flux drops accordingly to the latter.
What are the possible alternative explanations for the observed flux trend?
The presence of a bias in the data produced by a preferential selection effect
of low Ly absorption LBGs has already been suggested by Croft et al. (2002).
Another possibility is provided by photoionization, particularly if one recalls
the recent results by Steidel, Pettini & Adelberger (2001),
who detected flux beyond the Lyman limit (with significant residual flux
at Å) in a composite spectrum of 29 LBGs at , a
clue of a conspicuous escape probability of ionizing radiation from these objects.
As mentioned above, the A02 data would require an optical depth (or equivalently
a , assuming a prescribed density profile) a factor smaller.
If this can be achieved with the ionizing flux coming from galaxies must be proved with
detailed radiative transfer calculations which are currently ongoing (Maselli et al. 2003)
The first attempt using simplified analytical and/or post-processing techniques
to account for this effect (Croft et al. 2002, Kollmeier et al. 2002) have yielded so
far negative answers, but a fully self-consistent, physically accurate description
of the problem is awaited in order to draw a final conclusion.
This work was partially supported by the Research and Training Network ‘The Physics of the Intergalactic Medium’ set up by the European Community under the contract HPRN-CT2000-00126 RG29185. MB thanks P.Petitjean for discussions and hospitality at IAP. We are grateful to S. Bianchi for help with AUTOVP and discussions.
References
- [1] Adelberger, K. L., Steidel, C. C., Shapley, A. E. & Pettini, M. 2002, astro-ph/0210314
- [2] Croft R.A.C., Hernquist L., Springel V., Westover M. & White M. 2002, astr-ph/0204460
- [3] Ferrara, A., Pettini, M., & Shchekinov, Y. 2000, MNRAS, 319, 539
- [4] Haardt F. & Madau P. 1996, ApJ, 461, 20
- [5] Hu E.M., Kim T., Cowie L., Songaila A. & Rauch M. 1995, Astron. J., 110 (4), 1526
- [6] Kollmeier, J., Weinberg, D. H., Davé, R. & Katz, N. 2002, astro-ph/0209563
- [7] Mac Low, M-M. & Ferrara, A. 1999, ApJ , 513, 142
- [8] Madau, P., Ferrara, A., & Rees, M. J. 2001, ApJ, 555, 9
- [9] Marri, S., Ferrara, A., Bruscoli, M., Schneider, R. & Maselli, A., 2003, in preparation
- [10] Marri, S. & White, S. D. M. 2002, astro-ph/0207048
- [11] Maselli, A., Ferrara, A, Marri, S., Bruscoli, M. & Schneider 2003, in preparation
- [12] McDonald et al. 2000, ApJ, 543, 1
- [13] Petry C.E., Impey C.D., Katz N., Weinberg D.H. & Hernquist L.E. 2002, ApJ, 566, 30
- [14] Rauch M. et al. 1997b, ApJ, 489, 7
- [15] Rauch M., Haehnelt M.G. & Steinmetz M. 1997a, ApJ, 481, 601
- [16] Savaglio S., Panagia N. & Padovani P. 2002, ApJ, 567, 702
- [17] Scannapieco, E., Ferrara, A. & Madau, P. 2002, ApJ, 574, 590
- [18] Steidel, C. C., Pettini, M. & Adelberger, K. L. 2001 ApJ, 546, 665
- [19] Springel V., Yoshida N. & White S.D.M. 2001, NewA, 6, 79
- [20] Theuns T., Leonard A., Efstathiou G., Pearce F.R. & Thomas P.A. 1998, MNRAS, 301, 478
- [21] Theuns T., Viel M., Kay S., Schaye J., Carswell R.F. & Tzanavaris P. 2002, astro-ph/0208418