VLBA CONTINUUM AND H I ABSORPTION
OBSERVATIONS OF THE
ULTRA-LUMINOUS INFRARED GALAXY
IRAS 17208–0014
Abstract
We present phase-referenced VLBI observations of the radio continuum emission from, and the neutral hydrogen 21 cm absorption toward, the Ultra-Luminous Infrared Galaxy IRAS 17208–0014. The observations were carried out at 1362 MHz using the Very Long Baseline Array, including the phased Very Large Array as an element. The high-resolution radio continuum images reveal a nuclear starburst region in this galaxy, which is composed of diffuse emission approximately pc on the plane of the sky, and a number of compact sources. These sources are most likely to be clustered supernova remnants and/or luminous radio supernovae. Their brightness temperatures range over (2.2–6.6) K, with radio spectral luminosities between . The total VLBI flux density of the starburst region is 52 mJy, which is about 50% of the total flux density detected with the VLA at arcsecond resolution. For this galaxy, we derive a massive star formation rate of 84 yr-1, and a supernova rate of 41 yr-1. H I absorption is detected in multiple components with optical depths ranging between 0.3 and 2.5, and velocity widths between 58 and 232 km s-1. The derived column densities, assuming , range over cm-2. The H I absorption shows a strong velocity gradient of 453 km s-1 across (274 pc). Assuming Keplerian motion, the enclosed dynamical mass is about , comparable to the enclosed dynamical mass estimated from CO observations.
1 INTRODUCTION
At luminosities above , infrared galaxies become the most numerous objects in the local universe () (Sanders & Mirabel, 1996). The trigger for the intense infrared emission appears to be the strong interaction or merger of molecular gas-rich spirals. Galaxies at the highest infrared luminosities (), known as Ultra-Luminous Infrared Galaxies (ULIRGs), appear to be advanced merger systems and may represent an important stage in the formation of quasi-stellar objects (Sanders et al., 1988).
The bulk of the energy radiated by these sources is infrared emission from warm dust grains heated by a central power source or sources. The critical question concerning these galaxies is whether the dust is heated by a nuclear starburst, or an active galactic nucleus (AGN), or a combination of both. Mid-infrared spectroscopic studies on a sample of ULIRGs by Genzel et al. (1998), suggest that 70%–80% of these galaxies are powered predominantly by recently formed massive stars, and 20%–30% by a central AGN. These authors conclude further that at least half of these ULIRGs are probably powered by both an AGN and a starburst in a 1–2 kpc diameter circumnuclear disk or ring. The most direct evidence to date of sub-kpc nuclear starburst regions in ULIRGs is the discovery of luminous radio supernovae and supernova remnants in both Arp 220 (Smith et al., 1998b) and Mrk 273 (Carilli & Taylor, 2000), using VLBI observations.
In this paper, we present VLBI continuum and H I absorption observations on the ULIRG IRAS 17208–0014 at . This galaxy has an infrared luminosity of , as defined in Goldader et al. (1995).
Optical images of IRAS 17208–0014 at 6550 Å show two tidal tails from a merger (Melnick & Mirabel, 1990; Murphy et al., 1996), and its optical spectrum resembles that of an H II region (Veilleux et al., 1995; Soifer et al., 2000). Its near-IR images show a very disturbed morphology and an extended but single nucleus, suggesting a complete merger (Zenner & Lenzen, 1993; Murphy et al., 1996). Higher resolution near-IR images reveal numerous extremely luminous clusters in the inner 1 kpc, with no direct evidence of an AGN (Scoville et al., 2000). Infrared observations, in general, suggest that this galaxy represents the extreme of starburst dominated sources of this type (Soifer et al., 2000), and an observational proof that a collision of galaxies can lead to a mass distribution similar to elliptical galaxies (Zenner & Lenzen, 1993).
The CO (1–0) emission observations of IRAS 17208–0014 by Downes & Solomon (1998) show a source of size at full width half maximum, and a strong velocity gradient with a change of 400 km s-1 over in position angle . The enclosed dynamical mass estimated from the CO observation is .
IRAS 17208–0014 also exhibits OH megamaser activity (Martin et al., 1989) at 1665, 1667, and 1720 MHz. The strongest emission is in the 1667 MHz line, with a luminosity of . MERLIN 1662 MHz radio continuum observations at resolution (Martin et al., 1989) revealed the existence of an unresolved component on the longest baselines, with a constant visibility amplitude of 35 mJy. However, the continuum emission from this galaxy was not detected in the 18 cm global VLBI observations by Diamond et al. (1999) to a limit of .
Single dish observations by Martin et al. (1989) at Nançay showed the existence of a very wide H I absorption line in this galaxy, with full velocity widths of 650 and 695 km s-1 at 50% and 20% of the maximum depth, which is mJy.
In this paper, we report a detailed study of the H I 21 cm absorption and the radio continuum emission from IRAS 17208–0014. The results reveal the H I gas dynamics and the distribution of compact continuum sources, possibly composed of luminous radio supernova and/or supernova remnants, in the nuclear region of this galaxy on sub-kpc scales. We adopt a distance of 171 Mpc to this galaxy, assuming km s-1 Mpc-1. At this distance 1 mas corresponds to 0.76 pc.
2 OBSERVATIONS AND DATA REDUCTION
The observations were carried out at 1362 MHz on June 4, 2001 using NRAO’s 111The National Radio Astronomy Observatory is a facility of the National Science Foundation operated under cooperative agreement by Associated Universities, Inc. Very Long Baseline Array (VLBA), and the phased Very Large Array (VLA) as an element. The bandwidth of the observations was 16 MHz, in each of right and left-hand circular polarizations, sampled at two bits and centered at the frequency of the neutral hydrogen 21 cm line, at a heliocentric redshift of , or km s-1. The data were correlated at the VLBA correlator in Socorro, NM with 512-point spectral resolution per baseband channel, and 2.6 seconds correlator integration time. The total observing time was 11 hours. An initial correlation was performed at the position reported by Diamond et al. (1999) for IRAS 17208–0014 in their 18 cm VLBI OH megamaser observations, but no emission was detected. A second and final correlation was done at the position reported by Martin et al. (1989) in their 18 cm OH megamaser and continuum observations with the VLA and MERLIN. This position, where strong fringes were detected, is about 5.5 arcseconds different from the position reported by Diamond et al. (1999).
Data reduction and analysis were performed using the Astronomical Image Processing System (AIPS) and the Astronomical Information Processing System (AIPS++). Table 1 summarizes the parameters of these observations.
Along with the target source IRAS 17208–0014, the compact source J1730+0024 was observed as a phase reference with a cycle time of 120 seconds, 80 seconds on the target source and 40 seconds on the phase reference. The source J1743–0350 was used for amplitude and bandpass calibration.
After applying a priori flagging and manually excising integrations affected by interference, we performed amplitude calibration using the measurements of the antenna gain and the system temperature of each station, and bandpass calibration. Different spectral averagings generated two data sets, a one-channel continuum and a 124-channel line data set. The phase calibrator J1730+0024 in the continuum data set, was self-calibrated and imaged in an iterative cycle. The self-calibration solutions of J1730+0024 were applied on both the continuum and the line data of the target source IRAS 17208–0014.
The continuum data of IRAS17208–0014 were then deconvolved and imaged with various spatial resolutions by tapering the visibility data, to reveal its continuum structure. Continuum signals were mainly detected on the short-to-moderate length baselines to the phased VLA (Y27). The H I absorption line was only detected on the shortest baselines to Y27, primarily on the Y27–Pie Town baseline. The continuum emission was subtracted from the spectral-line visibility data. The spectral-line data were then analyzed at various spatial and spectral resolutions, and imaged by applying a two dimensional Gaussian taper falling to 30% at 500 k. Pairs of channels were averaged together to improve the sensitivity. The resulting velocity resolution of the H I images was 58 km s-1, and the spatial resolution . An optical-depth cube was calculated from the H I absorption image cube and a continuum image with a similar resolution as . The optical depth cube was blanked in areas where the flux density of the background continuum image is below 9.4% of the peak value, i.e., less than 3 mJy beam-1.
3 RESULTS AND ANALYSIS
3.1 The Radio Continuum
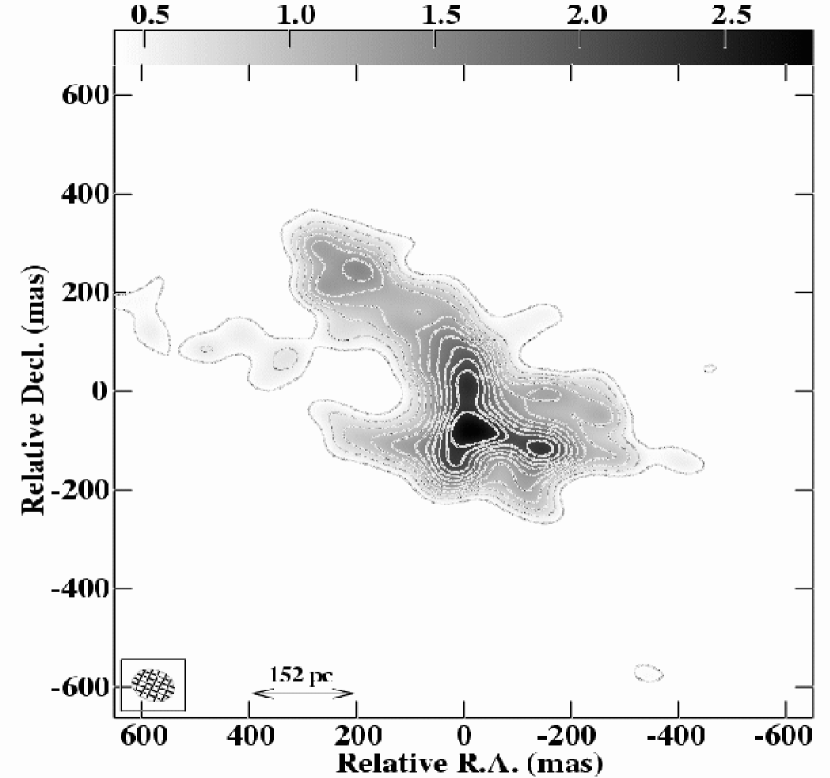
Figure 1 is our moderate resolution continuum image of the central region in IRAS 17208–0014 at 1362 MHz, with mas ( pc) resolution, obtained by using the CLEAN algorithm as implemented in the AIPS task “IMAGR”, with a grid weighting intermediate between natural and uniform (). A two dimensional Gaussian taper falling to 30% at 2 M in both U and V directions was applied on the visibility data. The radio continuum emission region has an extent of pc on the plane of the sky, with a total flux density of 52 mJy. We also reduced the VLA data from these observations, which were performed in the CnB configuration and yielded a resolution of . The total flux density of the source at this resolution is 100 mJy, consistent with the value measured by Condon et al. (1996) at 1.425 GHz with the VLA-B array.
An important question regarding these observations is whether the extended emission is likely diffuse, or composed of many point sources as might be expected for a nuclear starburst. Due to the incomplete UV coverage in VLBI observations, especially for a source at declination, the CLEAN algorithm tends to generate spurious point sources when deconvolving extended emission regions at high resolution. On the other hand, it is plausible that the extended emission is indeed composed of mostly faint point sources, in view of the likely starburst nature of IRAS 17208–0014. To resolve this ambiguity, we tested two other imaging algorithms: The Multi-Scale CLEAN and the Maximum Entropy Method (MEM), by generating two artificial data sets in AIPS++ with the same U-V sampling, weights and sky positions as our target source. Such simulations give us confidence in the reliability of the results obtained from the real observations. The first data set was composed of multiple point sources and an extended source, and the second was composed of three extended sources. While the MEM gave very poor images for the set with compact sources and relatively poor results on the set with large sources, the Multi-Scale CLEAN successfully imaged both data sets without exhibiting any tendency to generate spurious point sources. Thus, we imaged the actual observations of our target source at high resolution (Figure 2) using the Multi-Scale Clean algorithm as implemented in the AIPS++ tool “IMAGER”, with a grid weighting .
Figure 2 has a resolution of mas ( pc) and represents the same region as in Figure 1. The visibility data were tapered with a Gaussian function falling to 30% at 6 M in the U direction and 4.5 M in the V direction. The continuum source is resolved and consists of a diffuse component extending over pc, punctuated by a number of compact sources.
There are about 25 compact sources in this high resolution image with flux densities larger than 5Jy beam-1, but in Table 2 we list only the seven strongest compact sources, with flux densities higher than 9Jy beam-1. We selected this conservative limit because only these sources were consistently reproduced in the total intensity (Stokes I), and in the individual RR and LL images, with comparable flux densities. The remaining sources lacked this consistency.
The compact source parameters in Table 2 were obtained by fitting Gaussian functions using the tool “IMAGEFITTER” in AIPS++. The positions (Column 2) are relative to the peak surface brightness. Column 3 lists the surface brightnesses of these source, and Column 4 their integrated fluxes. Columns 5, 6 are the major and minor axes of the Gaussians at full width half maximum, and Column 7 are their position angles.
Phase-referencing observations allow the determination of the absolute position of the target source and its components, if any, from the position of the calibrator (Walker, 1999). The peak emission in IRAS 17208–0014, which is 1043 Jy beam-1, is found to be at , . In applying the phase-referencing technique, the accuracy of the calibrator position is important. The position of J1730+0024 was obtained from the Jodrell Bank–VLA Astrometric Survey (JVAS) of phase calibrators, with a position uncertainty of 14 mas (Browne et al., 1998). We verified the reported position of this calibrator, as well as its structure and its VLBI flux density, with a short VLBA observation preceding our main observations.
3.2 The H I Absorption
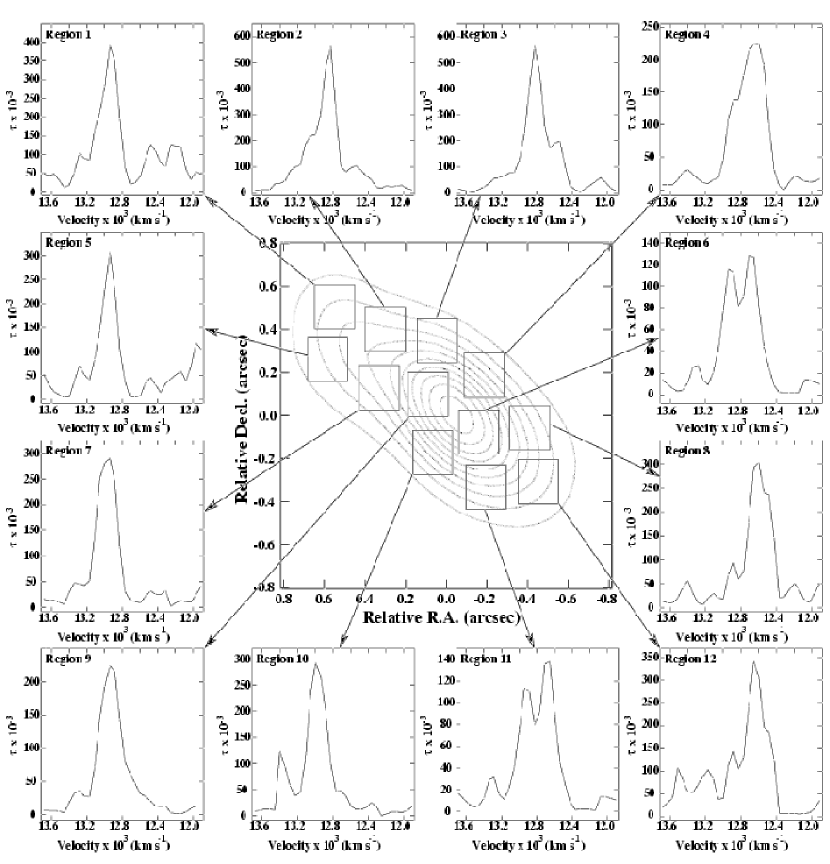
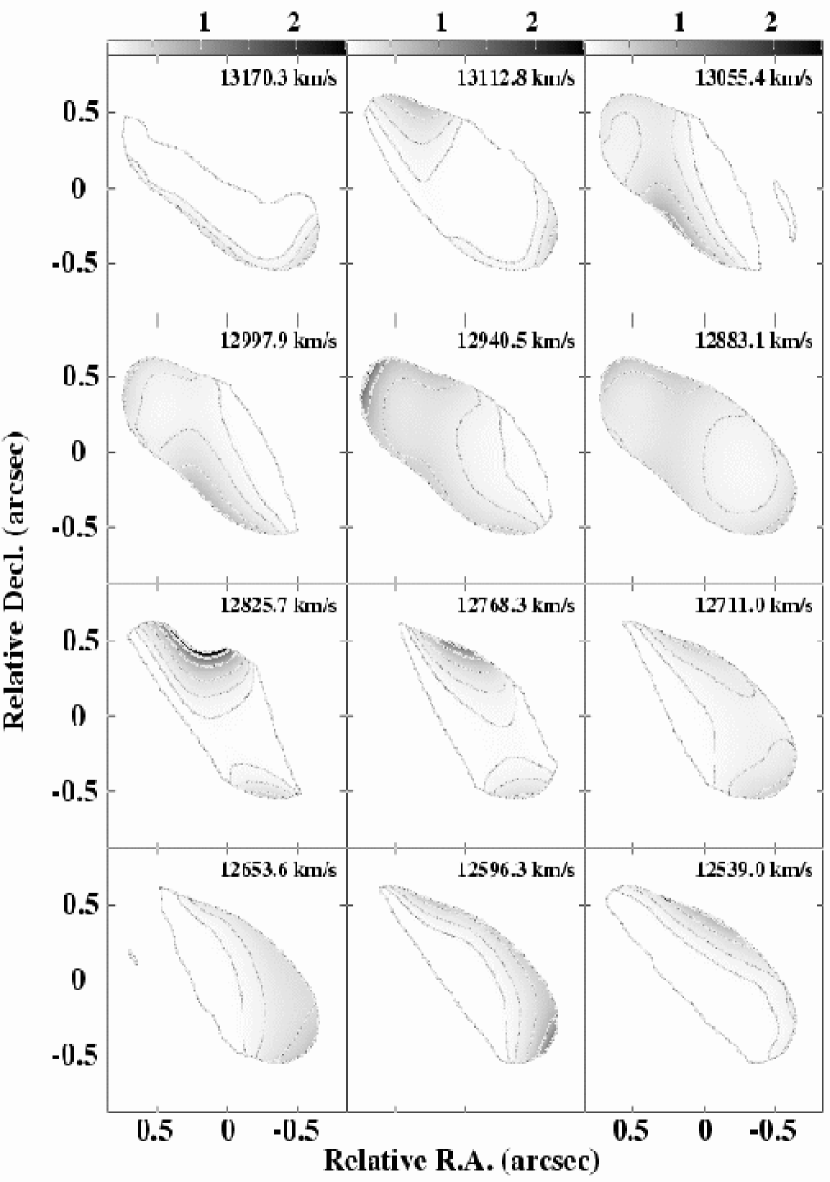
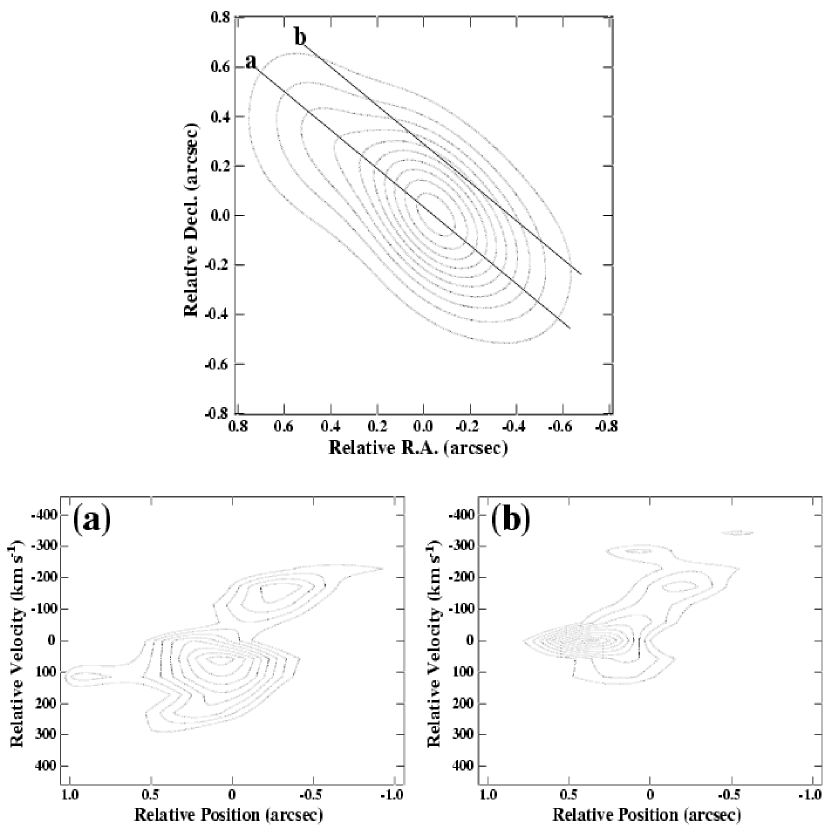
The H I absorption detected against the whole structure of the continuum has a full width at 20% maximum of 696 km s-1, and is composed of several components. Figure 3 shows Hanning smoothed spectra of H I optical depth averaged over various regions against the low resolution continuum image of IRAS 17208–0014. Figure 4 presents optical depth images covering the velocity range 13170.3–12539.0 km s-1. These images explicitly show the variation of the H I opacity against the nuclear region of IRAS 17208–0014. In the lower panel of Figure 5, Figure 5a is the H I position-velocity (P-V) plot along the major axis of the radio source (position angle ), and Figure 5b is a P-V diagram along another cut parallel to the major axis, as shown in the continuum image at the upper panel of Figure 5. We distinguish five main absorption peaks in both the P-V and the optical-depth images. Their velocity widths range between 58 and 232 km s-1 at half maximum, with optical depths between 0.3 and 2.5. Table 3 summarizes the physical characteristics of these five H I absorption features. The velocities (Column 1) refer to peaks of these features as seen in the optical-depth spectra. The widths of these lines (Column 2) are the approximate full widths at half peak optical depth. of each peak (Column 4) is calculated as . The column densities (Column 5) are derived assuming K. The visual extinction of each feature as a function of the H I spin temperature (Column 6) is computed assuming a Galactic dust-to-gas ratio (Staveley-Smith, & Davies, 1987), and the visual extinctions (Column 7) are also derived for K.
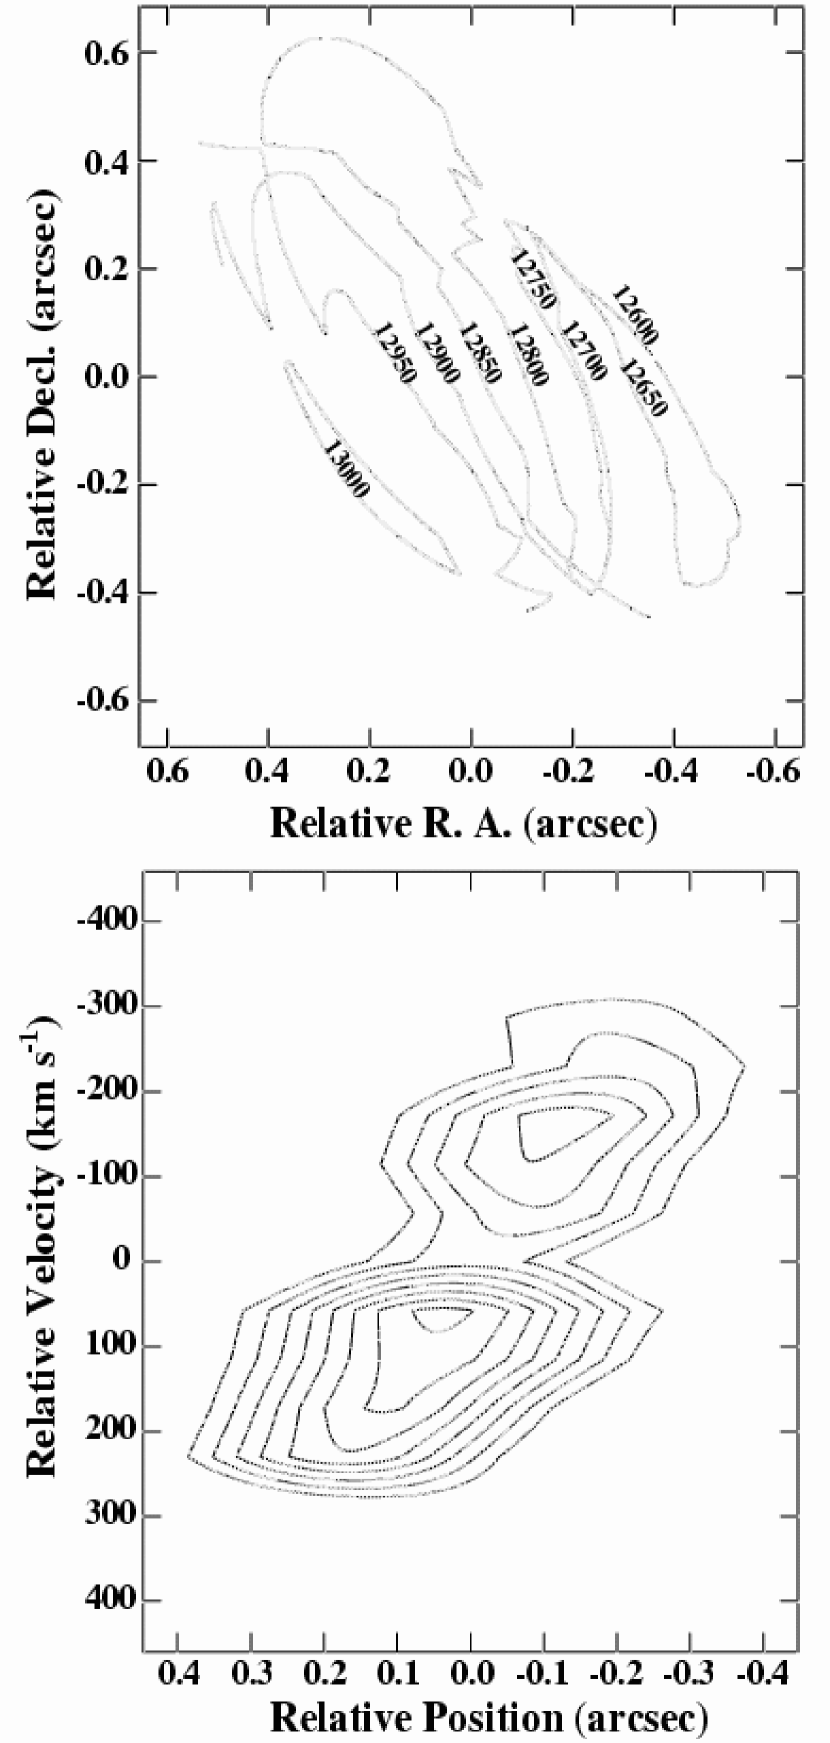
Our analysis show that the strongest velocity gradient in the H I absorption is along a position angle of , and not along the major axis of the radio source. The upper panel of Figure 6 is the H I absorption velocity field, the contours are in steps of 50 km s-1 and cover a velocity range between 12600 and 13000 km s-1. The lower panel of Figure 6 is a P-V plot along a cut where the strongest velocity gradient is seen (position angle ). This gradient is 453 km s-1 over 360 mas (274 pc), i.e. 1653 km s-1 kpc-1.
The spatial resolution of the low resolution continuum image and the H I images (Figures 3, 4, 5, & 6) is ( pc). The rms noise level of the H I image cube is 0.5 mJy beam-1. All these images were reconstructed with natural grid weighting ( in AIPS task “IMAGR”).
4 DISCUSSION
4.1 The Radio Continuum
At a moderate resolution (Figure 1), the nuclear region of IRAS 17208–0014 is composed of large scale structures a few hundred mas in size, with an average brightness temperature of 3 K. Our high resolution continuum results (Figure 2) show that the nuclear region is composed of a diffuse emission, covering an overall area of ( pc), punctuated by multiple bright compact sources with flux densities greater than five times the rms noise level, or Jy. At the full resolution of our array, this region is over-resolved and does not reveal any single dominant source with very high brightness temperature. This morphology resembles those of the starburst nuclei in M 82 (Muxlow et al., 1994; Pedlar et al., 1999), NGC 253 (Ulvestad & Antonucci, 1997), Arp 220 (Smith et al., 1998b), Mrk 273 (Carilli & Taylor, 2000), and III Zw 35 (Pihlström et al., 2001). The average size of these compact sources is mas ( pc), and their brightness temperatures are between (2.2–6.6) K, indicating the emission is non-thermal and not from H II regions. The non-thermal emission in nuclear starburst galaxies is usually attributed to synchrotron radiation from electrons accelerated in supernova remnant shocks (Condon, 1992).
4.1.1 The starburst and the star formation rate
A remarkably tight and linear correlation between the total radio continuum emission and the far-IR luminosities () is well known in “normal” galaxies where the main energy source is not due to a supermassive black hole (Condon, 1992). The most obvious interpretation of this correlation is the presence of massive stars that both provide relativistic particles via supernova events, and heat the interstellar dust which radiates in FIR wavelengths (Helou, Soifer, & Rowan-Robinson, 1985; Wunderlich & Klein, 1988; Condon, 1992).
The ratio of infrared to radio luminosity is expressed by the quantity as defined by Helou et al. (1985):
| (1) |
where is given by:
| (2) |
For IRAS 17208–0014, the total flux density at 1.4 GHz is 100 mJy (this work), and the IR flux densities at 60 and 100 are Jy and Jy, respectively (Sanders et al., 1995). The resulting is 2.63, reasonably consistent with the mean value of 2.34 for IR selected galaxies, and dispersion of for galaxies with , obtained by Yun, Reddy, & Condon (2001). Values of less than 1.64 would indicate the presence of a radio loud AGN (Yun, Reddy, & Condon, 2001). Thus, based on the radio-FIR correlation, it would appear that IRAS 17208–0014 is dominated by a starburst.
An estimate of the massive star formation rate and the supernova rate for a starburst galaxy can be obtained in two independent ways. The first is a theoretical approach which assumes an initial mass function (IMF) (Scoville & Soifer, 1991), and the second is based on an empirical relationship between the observed non-thermal radio flux density and the supernova rate in the Galaxy (Condon & Yin, 1990).
For the theoretical approach, we assume a modified Miller-Scalo IMF of the form . This function is truncated at and (Scalo, 1986; Condon, 1992; Smith, Lonsdale, & Lonsdale, 1998). The models presented by Scoville & Soifer (1991) give the following relationship between the luminosity of the starburst and the star formation rate ():
| (3) |
where and are the lower and upper mass limits for star formation, respectively, is the lifetime of the starburst, and and 0.55 for and , respectively.
The supernova rate of a starburst galaxy can be calculated from the star formation rate using the following expression from Smith et al. (1998b), that assumes the same IMF introduced above:
| (4) |
where for Type II supernovae.
To obtain the star formation and supernova rates in IRAS 17208–0014 (), we use the lower and upper mass arguments obtained for Arp 220, the prototype ULIRG which has a very similar value to our galaxy. For Arp 220 an upper limit mass was set from free-free emission and Pa observations and the lower mass limit was set from the CO dynamical mass measurements and the adopted disk model (Smith et al. (1998b) and references therein). These limits are and . It has also been found that the far-IR luminosity is a good measure of the bolometric luminosity produced by fairly massive young stars (Condon, 1992). Thus, with these mass limits, we can state that . The resulting star formation rate (Equation 3) is , and the supernova rate (Equation 4) is .
As an alternative, we can derive these rates using the empirical approach of Condon & Yin (1990), which is based on the observed Galactic non-thermal luminosity () and the supernova rate . This relationship is
| (5) |
where is the non-thermal spectral index for “normal” galaxies. Our 52 mJy total VLBI flux density for IRAS 17208–0014, which is mostly non-thermal, corresponds to a luminosity of . From Equation (5), we get , and from Equation(4) we get a massive star formation rate of , assuming the mass constraints as for Arp 220.
These values are lower than the rates obtained from the far-IR luminosity by a factor of 2.6, and suggest that there might be non-thermal diffuse emission which is not detected by our VLBI array. As shown by Condon (1992), the observed fraction of thermal emission in “normal” galaxies is at 1.4 GHz. Thus, a reasonable approximation would be to consider the total VLA flux density, which is 100 mJy, to be non-thermal. Then, following the above argument with the luminosity that corresponds to the detected VLA flux density, we obtain and . These values are more consistent with the rates obtained from the far-IR luminosity using similar mass limits, and support the suggestion that there is undetected diffuse flux in our VLBI observations.
We averaged the rates obtained from both the far-IR luminosity and the VLA radio flux density to obtain our best estimates for the massive star formation rate in IRAS 17208–0014, , and the supernova rate . The derived star formation and supernova rates are consistent with the rates in the ULIRG Arp 220, where Smith et al. (1998b) obtained a star formation rate of , and a supernova rate of in VLBI observations at 18 cm. Our supernova rate is much higher than the upper limit of 0.3 yr-1 that Ulvestad & Antonucci (1997) derived for the nearby starburst galaxy NGC 253 from higher-frequency VLA observations. Follow-up VLBI observations will make it possible to look for new sources (i.e. RSNe) to directly constrain both the supernova and the massive star formation rates in the nuclear starburst region of IRAS 17208–0014.
An estimate of the magnetic field strength and the pressure of the relativistic electrons responsible for the synchrotron radiation detected from the starburst region can be obtained by minimizing the summed energy in magnetic fields and relativistic particles (Miley, 1980). The resulting magnetic field is Gauss, and the corresponding pressure is dyn cm-2, indicating extreme physical conditions compared to the disks of spiral galaxies.
4.1.2 The nature of the compact sources
The VLBI continuum emission in IRAS 17208–0014 extends over a region of pc, and can be explained in part by synchrotron radiation from aged supernova remnants (SNRs), but this region is also punctuated by a number of bright compact sources (Figure 2). The radio spectral luminosities of these sources range over at 1.362 GHz, and are at least an order of magnitude greater than the brightest radio supernovae (RSNe) seen in M 82 (Muxlow et al., 1994; Pedlar et al., 1999), but comparable to the rare class of extreme luminosity RSNe characterized by SN 1986J in NGC 891 (Rupen et al., 1987) and SN 1979C (Weiler & Sramek, 2001). More recently, a substantial population of such luminous RSNe was discovered in Arp 220 by Smith et al. (1998b), who suggest that the high luminosities of those RSNe may indicate denser environments, more massive progenitors, or stronger magnetic fields relative to typical RSNe.
The compact sources revealed in our observations are a few times brighter and larger in size than the RSNe reported in the ULIRGs Arp 220 (Smith et al., 1998b) and Mrk 273 (Carilli & Taylor, 2000). Thus, we presume that the compact sources in the starburst region of IRAS 17208-0014 are clustered young SNRs and/or luminous RSNe. Support for the clumpy nature of the nuclear region in IRAS 17208–0014 is provided by the high resolution near-IR images obtained with the Hubble Space Telescope NICMOS camera (Scoville et al., 2000). These images, with resolutions between and , reveal numerous extremely luminous clusters of massive stars in the inner 1 kpc region of this galaxy.
Smith et al.(1998a) have fitted smooth Gaussian and clumped models of starburst distributions to the observed visibility functions of 11 luminous and ultra-luminous IR galaxies. Their first conclusion was that starbursts with standard RSNe are incapable of producing the radio power and structure of these galaxies. For luminous RSNe models, the Gaussian fits represented the visibility function poorly, but the clustered models, which assumed simultaneous detonation of the RSNe within one clump, were more successful. Excluding poor solutions, the sizes of these clumps ranged over 1–15 pc in diameter, and the number of supernovae per clump was between 2 and 12. These clumps are at least two times smaller than the minimum sizes implied by the Gaussian fits to our compact sources (Table 2).
However, we cannot rule out the possibility that the compact sources in our high resolution image are mainly powered by very luminous individual RSNe. Smith et al. (1998b) fit the following expression for the post-maximum light curve of luminous RSNe:
| (6) |
where , and is the detonation time. Following their discussion, individual RSNe will lie above our detection level for 7 years. Given our adopted supernova rate of 4 yr-1, we expect to see about 28 individual luminous RSNe, in remarkable agreement with the 25 compact sources revealed in our observations.
Future multi-epoch VLBI observations would determine which of the two above assumptions better explain the nature of the compact components in IRAS 17208–0014.
4.2 The H I Absorption
The wide H I absorption observed against the whole extent of the nuclear region in IRAS 17208–0014, with a full width of at 20% maximum, is common in ULIRGs. Similar wide absorption lines have been found in Arp 220 (Mirabel & Sanders, 1988), Mrk 273 (Bottinelli et al., 1985), and Mrk 231 (Dickey, 1982). The present observations are consistent with the Nançay 300 m meridian telescope observations by Martin et al. (1989), who found a broad H I absorption () centered at . The detected peak absorption flux density in our observations is mJy, about 72% of the single dish detection.
Our observations reveal the details of the H I absorption against the radio emission in IRAS 17208–0014 (Figures 3, 4, 5, & 6). The absorption is complex, and composed of five main features (Table 3). Three of them are wide () with , and the other two relatively narrow () with . These two narrow lines appear to be localized features on the east edge and the north-east side of the continuum emission region (Figure 4), suggesting the existence of quiescent H I clouds in the ISM of the galaxy. The linear extent of these two features is kpc, as seen in the optical depth images (Figure 4).
The P-V diagram in position angle 120∘ (Figure 6-lower panel), shows a strong velocity gradient of 453 km s-1 over (274 pc). Assuming Keplerian motion, the enclosed dynamical mass is , where is the inclination angle. The rotational behavior of the H I and the derived dynamical mass are largely consistent with the results of CO emission line observations (Solomon et al., 1997; Downes & Solomon, 1998). The interferometric observations of the CO by Downes & Solomon (1998) with IRAM at Plateau de Bure, show a velocity gradient of 400 km s-1 over at position angle 120∘, and an enclosed mass of . The resolution of these observations was in position angle 47∘. In both H I absorption and CO emission, the strongest velocity gradient is seen along the same direction (position angle 120∘). The H I absorption results show a stronger velocity gradient (1653 km s-1 kpc-1) comparing to the CO (346 km s-1 kpc-1), suggesting that the H I disk represents the inner region of a larger molecular disk. A similar model was proposed for the absorbing neutral hydrogen in Mrk 231, where the observed H I disk was identified as the inner region of the molecular gas seen in CO emission (Carilli, Wrobel, & Ulvestad, 1998).
It is likely that both atomic and molecular gas exist in the region where the H I absorption is detected. The emission detected in low spatial resolution (FWHM ) CO observations arises from larger scales, and would not show variations on the scales seen in the H I absorption in IRAS 17208–0014.
The neutral hydrogen column densities of the observed absorption features are high, covering a range . The corresponding visual extinctions , assuming a Galactic dust-to-gas ratio, are between 0.066 and 0.174 mag. The discussion in Scoville et al. (1998) for Arp 220, with the infrared magnitudes obtained for IRAS 17208-0014 (Scoville et al., 2000), implies a visual extinction value of 22 mag, comparable to the values derived from our H I column densities with a spin temperature of 100 K.
Our results show a very good agreement between the physical properties of the neutral H I in IRAS 17208–0014 and in the other ULIRGs previously observed in detail, namely Arp 220 (Mundell, Ferruit, & Pedlar, 2001), Mrk 273 (Cole et al., 1999; Carilli & Taylor, 2000) and Mrk 231 (Carilli, Wrobel, & Ulvestad, 1998). The strong velocity gradients seen in the H I absorption of these galaxies suggest rapidly rotating disks which are obscuring the radio-emitting nuclear regions, while the multiple absorption features seen against different regions of the continuum indicate the existence of several discrete clouds in those disks.
5 CONCLUSIONS
We have presented the results of phase-referenced VLBI observations, using the VLBA and the phased VLA, of the 21 cm continuum emission and the H I absorption in the central 1.1 kpc of the very advanced merger galaxy IRAS 17208–0014.
The high resolution continuum images reveal the details of the previously undetected nuclear starburst region of this galaxy. Both diffuse and compact continuum emission are detected. The total VLBI flux is 52 mJy, and represents only half of the total flux seen with the VLA at a lower resolution, suggesting the existence of diffuse emission not detected by our VLBI array. The compact sources in the starburst region are more likely clustered luminous radio supernovae and supernova remnants, considering the H II spectra observed in this galaxy and its morphological similarities to other well-known starbursts. However, we cannot rule out the possibility that each of our compact sources is mainly powered by an individual bright RSN nested in a region that contains faded SNRs. The brightness temperatures of the compact structures seen in these observations are K. The flux density of the brightest source in the starburst region is less than 3% of the total radio flux density. The results suggest that there is no radio-loud AGN in the nuclear region of IRAS 17208–0014.
Both the far-infrared luminosity and the radio continuum flux of this galaxy imply a massive star formation rate of and supernova rate of . The estimated individual luminous RSN number agrees surprisingly well with the number of the compact sources detected above 5 level. From the minimum energy condition, we have estimated the pressure to be dyn cm-2 and the magnetic field to be Gauss in the starburst region.
The very wide H I absorption is composed of five components with velocity widths between 58 and 232 km s-1. The column densities of these absorption peaks are on the order of , and the derived visual extinctions are between and mag. The strongest velocity gradient in the H I absorption is seen in position angle 120∘, as in the CO emission. The H I position-velocity profile in this position angle shows a velocity gradient of 1653 km s-1 kpc-1. The calculated dynamical mass, assuming Keplerian motion, is , comparable to the enclosed mass obtained from CO observations. The H I absorption results suggest the existence of a neutral gas disk containing several clouds, situated inside a larger scale molecular disk as seen in the interferometric CO emission line observations.
6 ACKNOWLEDGMENTS
This research has made use of the NASA/IPAC Extragalactic Database (NED) which is operated by the Jet Propulsion Laboratory, California Institute of Technology, under contract with the National Aeronautics and Space Administration. E. M. is grateful for support from NRAO through the Pre-doctoral Research Program. T. H. T. and E. M. acknowledge NSF support through grant AST 99-88341.
References
- Bottinelli et al. (1985) Bottinelli, L., Fraix-Burnet, D., Gouguenheim, L., Kazes, I., Le Squeren, A. M., Patey, I., Rickard, L. J., & Turner, B. E. 1985, A&A, 151, L7
- Browne et al. (1998) Browne, I. W. A., Patnaik, A. R., Wilkinson, P. N., & Wrobel, J. M. 1998, MNRAS, 293, 257
- Carilli, Wrobel, & Ulvestad (1998) Carilli, C. L., Wrobel, J. M., & Ulvestad, J. S. 1998, AJ, 115, 928
- Carilli & Taylor (2000) Carilli, C. L., & Taylor, G. B. 2000, ApJ, 532, L95
- Cole et al. (1999) Cole, G. H. J., Pedlar, A., Holloway, A. J., & Mundell, G. C. 1999, MNRAS, 310, 1033
- Condon (1992) Condon, J. J. 1992, ARA&A, 30, 575
- Condon & Yin (1990) Condon, J. J., & Yin, Q. F. 1990, ApJ, 357, 97
- Condon et al. (1996) Condon, J. J., Helou, G., Sanders, D. B., & Soifer, B. T. 1996, ApJS, 103, 81
- Diamond et al. (1999) Diamond, P. J., Lonsdale, C. J., Lonsdale, C. J., & Smith, H. E. 1999, ApJ, 511, 178
- Dickey (1982) Dickey, J .M. 1982, ApJ, 263, 87
- Downes & Solomon (1998) Downes D., & Solomon P. M. 1998, ApJ, 507, 615
- Goldader et al. (1995) Goldader, J. D., Joseph, R. D., Doyon, R., & Sanders, D. B. 1995, ApJ, 444, 97
- Helou, Soifer, & Rowan-Robinson (1985) Helou, G., Soifer, B. T., & Rowan-Robinson, M. 1985, ApJ, 298, L7
- Genzel et al. (1998) Genzel, R., et al. 1998, ApJ, 498, 579
- Melnick & Mirabel (1990) Melnick, J., & Mirabel, I. F. 1990, A&A, 231, L19
- Martin et al. (1989) Martin, J. M., Bottinelli, L., Dennefeld, M., Gouguenheim, L., & Le Squeren, A. M. 1989, A&A, 208, 39
- Miley (1980) Miley, G. 1980, ARA&A, 18, 165
- Mirabel & Sanders (1988) Mirabel, I. F., & Sanders D. B. 1988, ApJ, 335, 104
- Mundell, Ferruit, & Pedlar (2001) Mundell, C. G., Ferruit, P., & Pedlar, A. 2001, ApJ, 560, 168
- Murphy et al. (1996) Murphy, T. W. Jr., Armus, L., Matthews, K., Soifer, B. T., Mazzarella, J. M., Shupe, D. L., Strauss, M. A., & Neugebauer, G. 1996, AJ, 111, 1025
- Muxlow et al. (1994) Muxlow, T. W. B., Pedlar, A., Wilkinson, P. N., Axon, D. J., Sanders, E. M., & de Bruyn, A. G. 1994, MNRAS, 266, 455
- Pedlar et al. (1999) Pedlar, A., Muxlow, T. W. B., Garrett, M. A., Diamond, P., Wills, K. A., Wilkinson, P. N., & Alef, W. 1999, MNRAS, 307, 761
- Pihlström et al. (2001) Pihlström, Y. M., Conway, J. E., Booth, R. S., Diamond, P. J., & Polatidis, A. G. 2001, A&A, 377, 413
- Rupen et al. (1987) Rupen, M. P., van Gorkom, J. H., Knapp, G. R., Gunn, J. E., & Schneider, D. P. 1987, AJ, 94, 61
- Sanders et al. (1988) Sanders, D. B., Soifer, B. T., Elias, J. H., Madore, B. F., Matthews, K., Neugebauer, G., & Scoville, N. Z. 1988, ApJ, 325, 74
- Sanders et al. (1995) Sanders, D. B., Egami, E., Lipari, S., Mirabel, I. F., & Soifer, B. T. 1995, AJ, 110, 1993
- Sanders & Mirabel (1996) Sanders, D. B., & Mirabel, I. F. 1996, ARA&A, 34, 749
- Scalo (1986) Scalo, J. 1986, Fundam. Cosmic Phys., II, 1
- Scoville & Soifer (1991) Scoville, N. Z., & Soifer, B. T. 1991, in Massive Stars in Starbursts, ed. C. Leitherer, N. Walborn, T. Heckman, & C. Norman (Cambridge: Cambridge Univ. Press), 233
- Scoville et al. (1998) Scoville, N. Z., et al. 1998, ApJ, 492, L107
- Scoville et al. (2000) Scoville, N. Z., Evans, A. S., Thompson, R., Rieke, M., Hines, D. C., Low, F. J., Dinshaw, N., Surace, J. A., & Armus, L. 2000, AJ, 119, 991
- Smith, Lonsdale, & Lonsdale (1998) Smith, H. E., Lonsdale, C. J., & Lonsdale, C. J. 1998a, ApJ, 492, 137
- Smith et al. (1998b) Smith, H. E., Lonsdale, C. J., Lonsdale, C. J., & Diamond, P. J. 1998b, ApJ, 493, L17
- Soifer et al. (2000) Soifer, B. T., et al. 2000, AJ, 119, 509
- Solomon et al. (1997) Solomon, P. M., Downes, D., Radford, S. J. E., & Barrett, J. W. 1997, ApJ, 478, 144
- Staveley-Smith, & Davies (1987) Staveley-Smith, L., & Davies, R. D. 1987, MNRAS, 224, 953
- Ulvestad & Antonucci (1997) Ulvestad, J. S., & Antonucci, R. J. 1997, ApJ, 488, 621
- Veilleux et al. (1995) Veilleux, S., Kim, D.-C., Sanders, D. B., Mazzarella, J. M., & Soifer, B. T. 1995, ApJS, 98, 171
- Weiler & Sramek (2001) Weiler, K. W., & Sramek, R. A., 1988, ARA&A, 26, 295
- Walker (1999) Walker, C. R. 1999, in Synthesis Imaging in Radio Astronomy II, ed. G. B. Taylor, C. L. Carilli, & R. A. Perley (San Francisco: ASP), 433
- Wunderlich & Klein (1988) Wunderlich, E., & Klein, U. 1988, A&A, 206, 47
- Yun, Reddy, & Condon (2001) Yun, Min S., Reddy, N. A., & Condon, J. J. 2001, ApJ, 554, 803
- Zenner & Lenzen (1993) Zenner, S., & Lenzen, R. 1993, A&AS, 101, 363

| Parameters | Values | ||
|---|---|---|---|
| Observing Date | 2001 June 4 | ||
| Observing Array | VLBA + Y27 | ||
| R.A. (J2000) | 17 23 21.9554 | ||
| Dec. (J2000) | 00 17 00.938 | ||
| Total observing time (hr) | 11 | ||
| Phase-referencing cycle time (min) | 2 | ||
| Frequency (MHz) | 1362 | ||
| Bandwidth (MHz) | 16 | ||
| Continuum image rms (Jy beam-1) | 70 | ||
| Line velocity resolution (km s-1) | 58 | ||
| Line image rms (mJy beam-1) | 0.5 | ||
| Optical depth image cutoff (mJy beam-1)…… | 3 |
Note. — Units of right ascension are hours, minutes, and seconds, and units of declination are degrees, arcminutes, and arcseconds.
| Gaussian Component Parameters | |||||||
|---|---|---|---|---|---|---|---|
| Source | Relative PositionaaThe reference position (0,0) is , . | PeakbbHigher than Jy. | Total | Major AxisccAt half maximum. | Minor AxisccAt half maximum. | P.A. | |
| (mas) | (Jy beam-1) | (mJy) | (pc) | (pc) | (∘) | ||
| (1) | (2) | (3) | (4) | (5) | (6) | (7) | |
| 1 | 0 , 0 | 155 | |||||
| 2 | 87E, 40N | 78 | |||||
| 3 | 153W, 6S | 107 | |||||
| 4 | 182E, 31S | 122 | |||||
| 5 | 98W, 86N | 26 | |||||
| 6 | 50W, 6S | 171 | |||||
| 7 | 6W, 109S | 26 | |||||
| VelocityaaHeliocentric velocity of the H I absorption feature at . | bbBased on . | ccAssumes a Galactic dust-to-gas ratio. | bbBased on . | |||||
|---|---|---|---|---|---|---|---|---|
| (km s-1) | (km s-1) | (cm) | (cm-2) | (mag K-1) | (mag) | |||
| (1) | (2) | (3) | (4) | (5) | (6) | (7) | ||
| 12653.5 | 174 | 0.3 | 10.1 | 10.1 | 0.066 | 6.6 | ||
| 12825.7 | 58 | 2.5 | 28.0 | 28.0 | 0.174 | 17.4 | ||
| 12883.1 | 232 | 0.3 | 13.5 | 13.5 | 0.085 | 8.5 | ||
| 12940.4 | 58 | 1.3 | 14.4 | 14.6 | 0.094 | 9.4 | ||
| 12997.8 | 174 | 0.5 | 16.8 | 16.8 | 0.111 | 11.1 |