Abstract
We have developed a timing analysis method to determine the distances of variable galactic X-ray sources based on the method advanced by Trümper and Schönfelder in 1973. The light-curve of the halo produced by the scattering of X-rays off the interstellar dust is delayed and smeared by the dust grains. This method utilizes the differences between the power density spectra of the point source and the halo. We present the details of this method and our first applications of this method to the Chandra data of X-ray binary Cyg X-3.
keywords:
X-ray source distance, ISM, scatteringDistance Determination of Variable Galactic Sources
1 Introduction
When the high energy photons emitted by the X-ray source arrive to the earth, they have been scattered by the interstellar dust grains. Therefore many galactic X-ray sources are observed to have faint and diffuse halos. This effect and its possible application was first discussed by Overbeck (1965), and the X-ray halo was first detected with Einstein Observatory (Rolf 1983, Catura 1983). The investigation of the shape and strength of the haloes was done by several authors (e.g. Mauche & Gorenstein 1986, Predehl & Schmitt 1995) based on the data of Einstein and ROSAT.
As the photons in the halo travel through longer paths than the photons in the point source, any intensity variation in the the source induces a delayed signal in the halo. It has been suggested by Trümper and Schönfelder (1973, hereafter TS1973) that this effect can be uesd to determine the distance of variable galactic X-ray sources. Although the method is very simple, the first successful application was realized by Predehl (2000) for a X-ray binary Cyg X-3 almost 30 years later. They obtained the distance of kpc to the source. The difficulty of the method is that it is hard to distinguish the halo from the image induced by the point spread function of the instrument until the Chandra X-ray Observatory provides us the high resolution image of X-ray sources.
The shape and strength of the halo depend on the distance to the X-ray source, the geometric distribution and the physical properties of the interstellar dust grains (Hayakawa (1970), Mathis & Lee (1991), and Predehl & Klose (1996)).
2 Methodology
The differential scattering cross section of X-ray photons in interstellar dust is (Predehl, 2000)
| (1) |
where is the size of the dust grains (in m), is the energy of X-ray (in keV), and is the scattering angle (in arc min).

Following TS1973, we obtain the time delay of a scattered photon compared with an unscattered photon is (See Fig. 1)
| (2) |
where is given in kpc, in arcsec.
Given the dust density distribution along the line of sight , the time delay distribution function can be calculated. As pointed by Predehl & Schmitt (1995), we can assume is a constant. Thus
| (3) |
For a viable point source with light-curve , the normalized light-curve in the halo is
| (4) |
where is the possible maximal time delay.
In TS1973, and are compared directly to determine distance.
Suppose the light-curve of the point source and the light-curve of the halo at radius are stationary random signals, and are their Fourier transformation respectively. It is easy to show that
| (5) |
where
| (6) |
is the normalized integral transformation of the signal arrival time distribution function .
Denote the power density spectrum of the point source and the halo as and , we get
| (7) |
Given the power density spectra of the point source and the halo at different radius, and are easy to know, and can thus be determined by fitting equation (3).
3 Application to Chandra data on Cyg X-3
Now we apply this method to the Chandra data of X-ray binary Cyg X-3. Cyg X-3 is an eclipsing X-ray binary with an orbital period of 4.8 hours (Brinkman et al. 1972). Cyg X-3 was observed with the High Energy Transmission Grating Spectrometer (HETGS) on board of Chandra on October 20, 1999, with a total time of 12.3 ksec, starting at 01:11:38 UT. The observation covered the binary phases from -0.3 to +0.4. We only use the zeroth order data in this study.
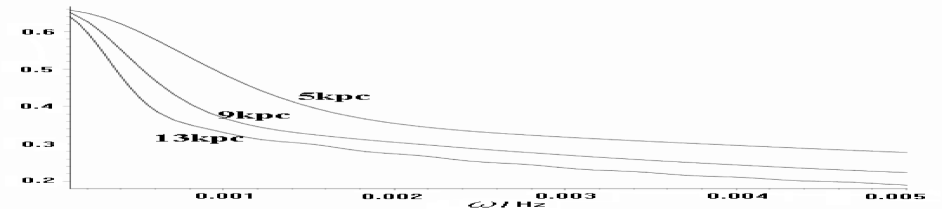
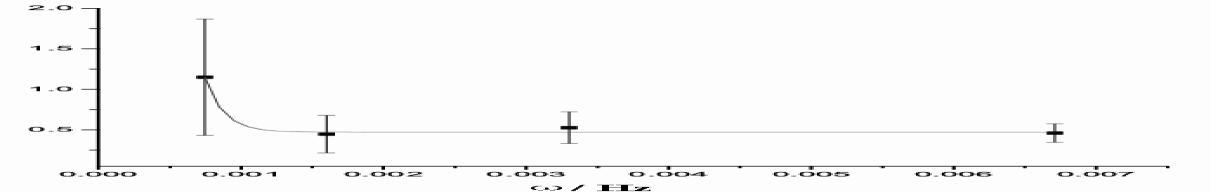
Because the image of the point source is severely damaged by the pileup effect, we can only campare the power density spectra at different and radius. The theoretical difference of the power density spectrum of the halo at 2 arcsec and 4 arcsec in 5.0-7.0 keV energy band are shown in Fig. 2. Then we calculate in 5.0-7.0 keV energy band, the result shows in Fig. 3. Because the error bar of the data in Fig. 3 is very big, it is hard to fit the data with theoretical curves. For simplicity, we fit the data with a exponential curve. The turning point of the fitting curve lies at about 0.001 Hz, and the corresponding value of is 9 kpc. According to Fig. 3, it seems the real turning point should small than 0.002 Hz, so we estimate is at least 5 kpc.
4 Discussion
Our result is consistent with previous estimate on the distance of Cyg X-3. Predehl et al. (2000) used TS1973 method and obtained kpc, Dickey (1983) found a lower limit of 9.2 kpc 1 using 21 cm wavelength absorption data, Predehl & Schmitt (1995) derived 8 kpc as distance through the galactic dust layer from their comparison of X-ray scattering and absorption.
Our method and TS1973 method both determine the geometric distance instead of physical distance. The physical distance depend on the estimation of many physical parameters, i.e., absorption optical depth. The uncertainties of the geometric distance determination come mainly from the dust density distribution along the line of sight. In principle, it can be solved by carefully fitting the shape and strength of the halo. In TS1973 method the X-ray source must have relatively obvious variations in the time interval comparable to the delay time (see Fig. 4. in Predehl et al. 2000). But in our method this requirement is not needed.
Although the Chandra Observatory has high resolution, its effective area is relatively small, therefore the count rate of the Cyg X-3 halo is not high enough for good statistical study with our method. The future X-ray satellites such as Constellation-X will provide us with high count rate data, and our method can be applied to many more galactic variable X-ray sources.
Acknowledgement: This study is supported in part by the Special Funds for Major State Basic Research Projects and by the National Natural Science Foundation of China. SNZ also acknowledges supports by NASA’s Marshall Space Flight Center and through NASA’s Long Term Space Astrophysics Program.
10
References
- [1] Brinkman, A.C., et al. IAU Circ. 2446 (1972)
- [2] Catura, R. C., Astrophys. J. 275, 645 (1983)
- [3] Dickey, J.M., Astrophys. J. 273, L71 (1983)
- [4] Hayakawa, S., Prog. Theor. Phys. 43, 1224 (1970)
- [5] Mathis, J.S., Lee C.-W., Astrophys. J. 376, 490 (1991)
- [6] Mauche, C.W., Gorenstein P., Astrophys. J. 302, 371 (1986)
- [7] Overbeck, J. W., Astrophys. J. 141, 864 (1965)
- [8] Predehl, P., Schmitt, J.H.M.M., Astro. Astrophys. 293, 889 (1995)
- [9] Predehl, P., Klose, S., Astro. Astrophys. 306, 283 (1996)
- [10] Predehl, P., Burwitz, V., Paerels F., Trümper J., Astro. Astrophys. 357, L25 (2000)
- [11] Rolf, D. P., Nature 302, 46 (1983)
- [12] Trümper, J., Schönfelder, V., Astro. Astrophys. 25, 445 (1973)