00 \Year0000 \Month00 \Pagespan000000 \lhead[0]K.F. Gunn et al.: Radio observations of the XMM-Newton/Chandra 13hr deep survey field \rhead[Astron. Nachr./AN XXX (200X) X]0 \headnoteAstron. Nachr./AN 32X (200X) X, XXX–XXX
Radio observations of the XMM-Newton/Chandra 13hr deep survey field
Abstract
Our VLA observations of the XMM-Newton/Chandra 13hr deep survey field (see Page et al., this proceedings) result in one of the two deepest 1.4GHz radio maps ever made. Within the radius field covered by the deep X-ray data (0.19 deg2), a total of 556 radio sources are detected, down to a flux limit of Jy. Of the 214 Chandra sources, 55 have radio counterparts. The sub-arcsecond accuracy of the VLA and Chandra positions enable us to determine with high confidence the sources common to both surveys. Here we present the relationship between the X-ray and radio source populations at the faintest radio flux limits yet probed by such a study. We discuss how the X-ray/radio relationship differs as a function of optical morphology, ie between unresolved ‘stellar’ objects and well resolved galaxies. We then discuss the origin of the X-ray and radio emission, ie AGN, starburst or a mixture of both, in these two classes of object.
keywords:
surveys — X-rays — radio continuum — galaxies: activekfg@astro.soton.ac.uk
1 Introduction
Our Chandra/XMM-Newton X-ray survey of the 13hr field (, J2000) has been undertaken with the aim of understanding the physics of the X-ray sources around the knee of the source counts, ie, those sources which produce the bulk of the X-ray background radiation. To complement our initial X-ray survey, we have made a deep VLA 20cm radio observation of the field, both as a survey in its own right, but also to investigate the overlap between the faint X-ray and faint radio source populations. Are they entirely different populations or different manifestations of the same object? If the populations overlap, what are the underlying physics and emission mechanisms in these sources? How does the emission mechanism depend upon host galaxy morphology? (see also, eg, Bauer et al. 2002).
1.1 The Data
The 13hr field was originally a deep ROSAT survey field (100ks with the PSPC, McHardy et al. 1998), and was therefore chosen to be at high galactic latitude in a region of extremely low extinction, . The 13hr field has now been observed for 200ks with XMM-Newton (Mason et al., in preparation) as part of the Guaranteed Time programme, and with a mosaic of four 30ks Chandra ACIS-I pointings (McHardy et al. 2002) covering 0.19 deg2, reaching . A wealth of supporting data is available for this field, including a deep Subaru SuprimeCam optical image to and UKIRT/UFTI near infrared images of the bright X-ray galaxies. This field will also be observed at mid to far infrared wavelengths as part of the SIRTF Guaranteed Time programme, and at 1mm with BOLOCAM.
Since the 13hr field is such a well studied field, it was also chosen for an extremely deep VLA survey (over 40hrs at 20cm, mostly with the A-array, plus a further 10hrs at 6cm) reaching Jy rms, making it one of the three deepest radio surveys ever made (see also Richards et al. 1998; Ivison et al. 2002). To study the brightest sources at higher resolution, 18 days of MERLIN 20cm observations were also performed.
1.2 Luminosities

Since the VLA survey reaches to such faint fluxes, it is interesting to look at the typical luminosities for objects in our sample. Fig. 1 shows the radio luminosity vs optical absolute magnitude for the sub-sample of sources with for which redshifts are available. Of these, the majority of radio sources have , and are of relatively low luminosity. For the fainter sources, if we assume , then a Jy source has a luminosity of , which is at the upper limit for ‘normal’ galaxies; an X-ray source of has , at the upper limit for starburst galaxies.
We note also that almost all the radio sources in our sample are smaller than 50kpc in size, ie, the size of a galaxy or smaller, consistent with a starburst origin for much of the emission, therefore we are not detecting the equivalent of classical double-lobed radio galaxies.
1.3 Stellarity
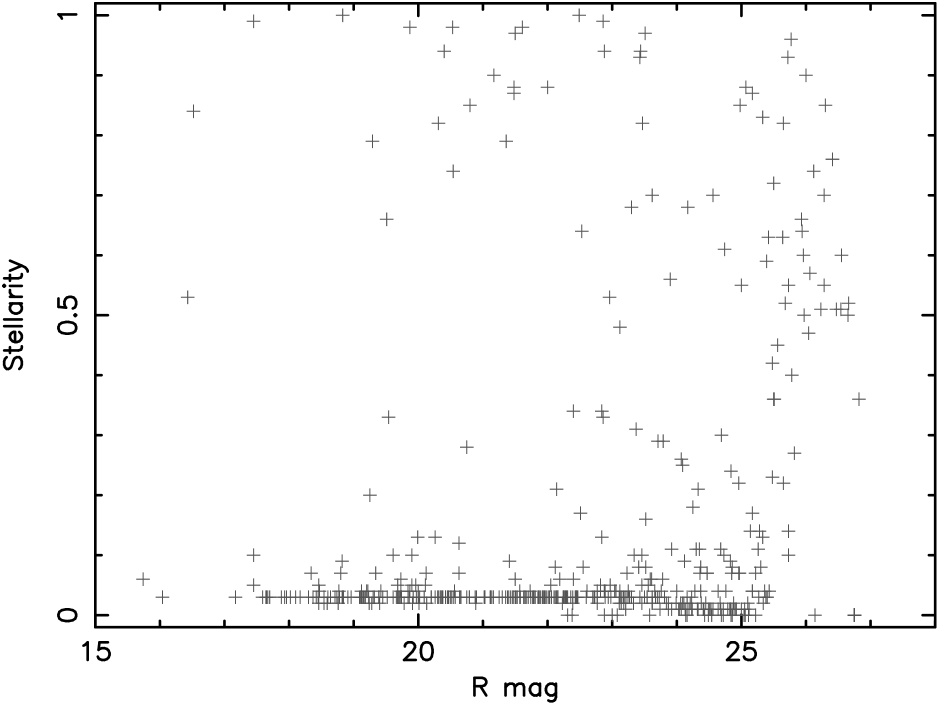
The optical counterparts to the X-ray and radio sources in our samples are found from the Subaru image of the field. The SExtractor source extraction package (Bertin & Arnouts 1996) is used to create the optical catalogue, containing photometric and morphological information. The ‘stellarity’ parameter denotes how resolved an optical source is: broadly speaking, stars have stellarity and galaxies , but a crude separation can be made at . SExtractor has difficulty in classifying the morphology for objects fainter than in our data. In Fig. 2, we plot the stellarity of the optical counterparts against –band magnitude, for both the X-ray and radio samples, which clearly shows that radio counterparts are more galaxy-like than the X-ray counterparts, as would perhaps be expected due to orientation effects in the context of the Unified Model of AGN.

1.4 Optical magnitude distributions


In Fig. 3, the optical magnitude distributions of the X-ray and radio samples are plotted. The Chandra sample (upper panel) has a strong peak at , with very few counterparts with . The radio sample (lower panel) has a fairly flat magnitude distribution to , and only falls off at due to optical catalogue incompleteness. The higher fraction of optically faint sources means that more remain unidentified at present than in the X-ray sample. The broad range of optical magnitudes implies no correlation between radio or X-ray flux and host galaxy brightness.
2 Radio/X-ray correlation
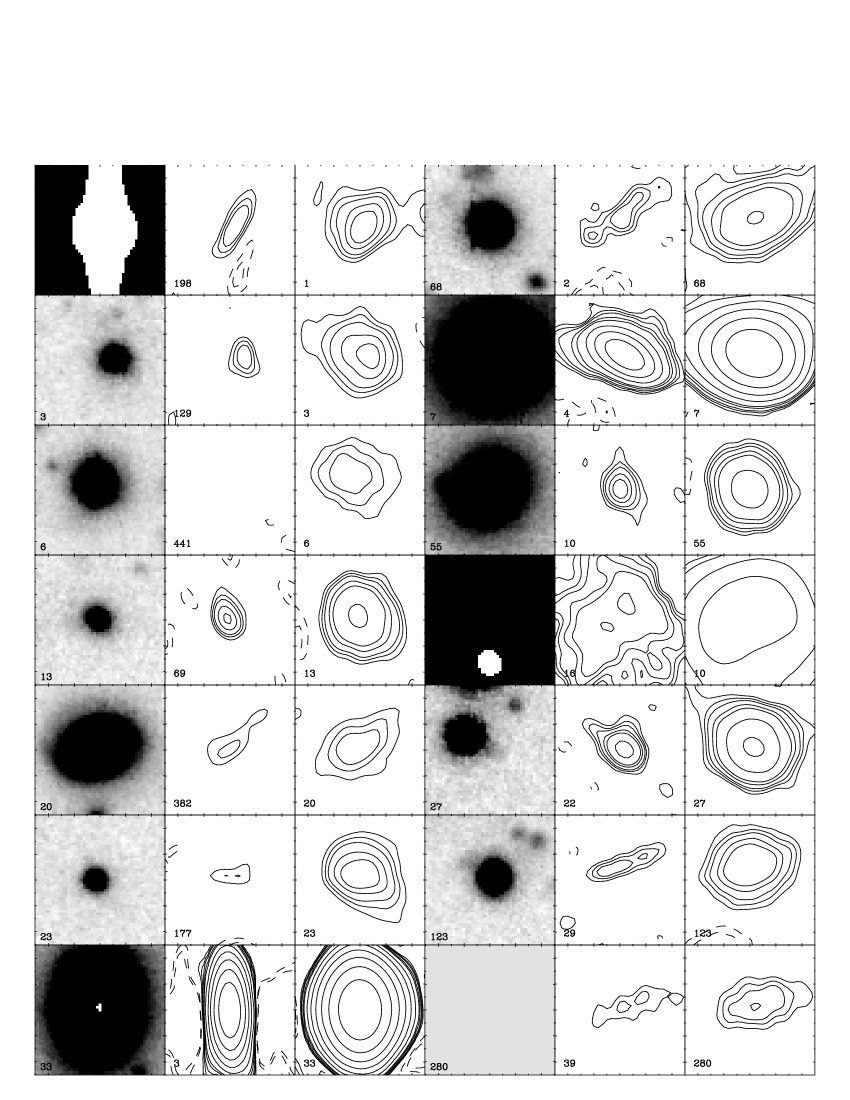
The three coordinate frames, Chandra, Subaru (tied to APM/FK5) and VLA, are independent and in excellent agreement. Our source positions are extremely accurate, Chandra and Subaru/VLA , enabling confident matching of sources in different wavebands. Of the 214 Chandra sources and 556 VLA sources in the 13hr field, 55 are common to both samples. A wide range of optical magnitudes and morphologies are found, as shown in Fig. 4, suggesting a variety of emission mechanisms.
2.1 Emission mechanisms and diagnostics
The combination of X-ray, optical and radio data is a powerful tool for determining the emission mechanism in these faint sources. Objects expected to be luminous at these wavelengths include normal broad-line AGN, obscured AGN, BL Lacs, starburst galaxies, and advective flows, each with distinct properties. For example, starburst galaxies are expected to have steep radio spectra and soft, thermal X-ray spectra, whereas obscured AGN have hard X-ray spectra and probably flat (, ) radio spectra. Radio galaxies can be either core dominated () or lobe dominated (), while BL Lacs have have a core-halo morphology with flat () radio spectra, and very steep X-ray spectra. Advective flows are characterised by a very flat X-ray spectrum, and probably a higher radio to X-ray flux ratio than normal AGN. (See eg Condon 1992; di Matteo & Fabian 1997).
2.2 Absorption line galaxies
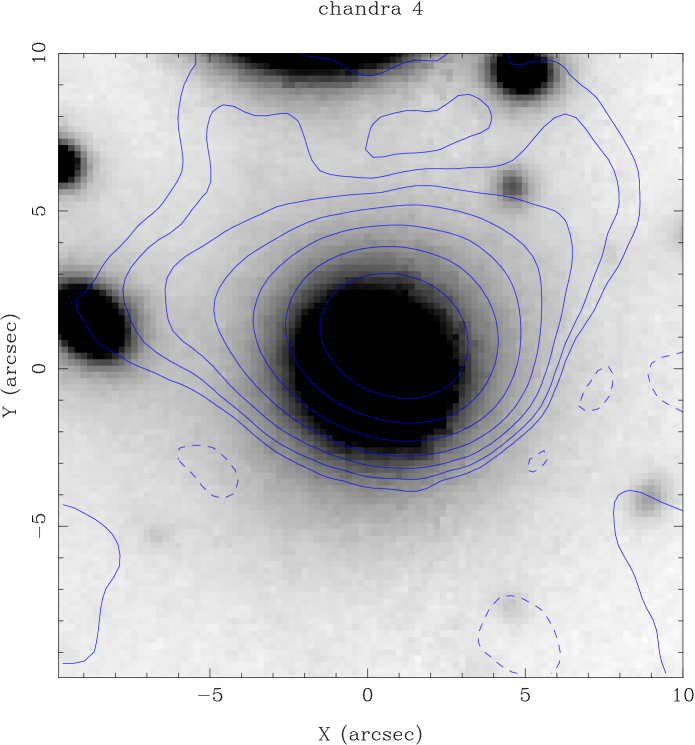
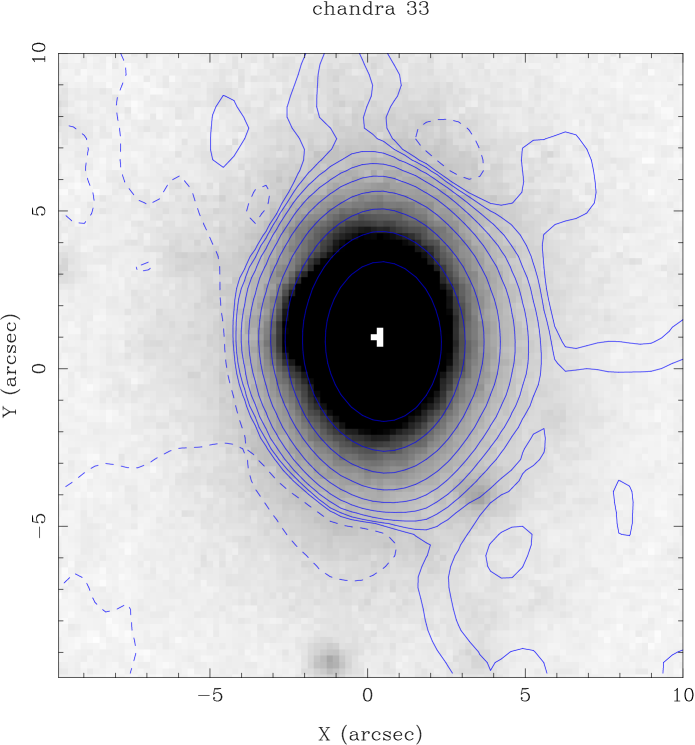
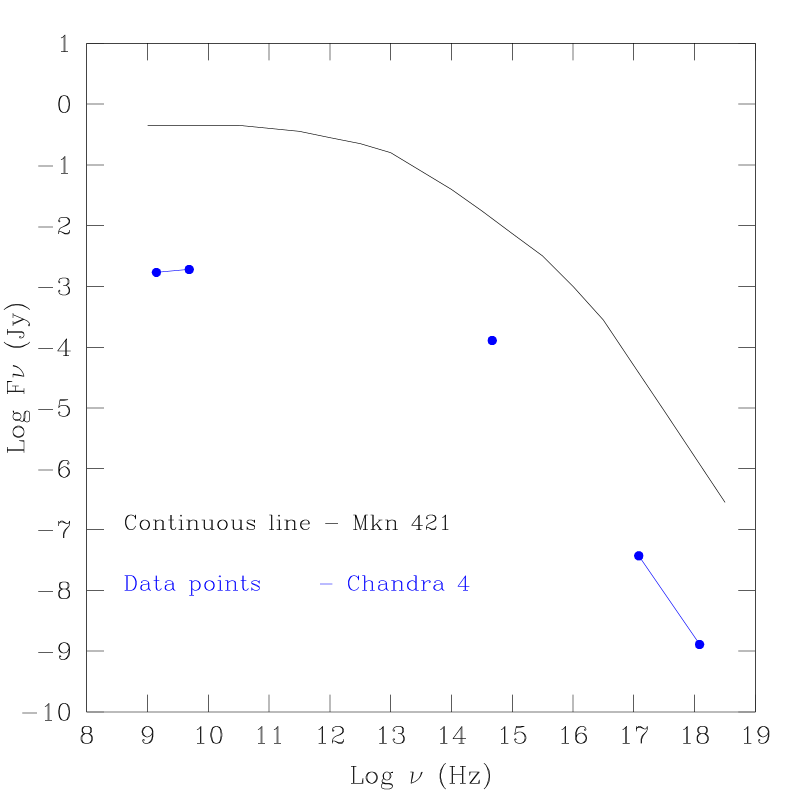
The first deep Chandra survey (Mushotzky et al. 2000) found a population of optically inactive galaxies with hard spectra, in which the X-ray emission mechanism is unknown. Similarly inactive galaxies were found in our Chandra sample with C4 and C33, the two optically brightest absorption line galaxies, each having a magnitude of . Both are elliptical galaxies with normal optical spectra. However the radio data showed flat spectra and core-halo morphologies (Fig. 5), with very steep X-ray powerlaw spectra (Fig. 6), indicating that C4 and C33 are almost certainly BL Lac objects (McHardy et al., in preparation). Furthermore, the XMM spectrum of C33 shows a small amount of intrinsic absorption, , which could mimic an intrinsic hard spectrum in a faint source for which only a Chandra two-band hardness ratio was available.


2.3 Emission line galaxies
Narrow emission line galaxies were found in deep ROSAT X-ray surveys, with their contribution rising towards faint fluxes (Almaini et al. 1995; Romero-Colmenero et al. 1996; McHardy et al. 1998). The nature of the emission, starburst or obscured AGN activity, continues to be the subject of debate, but it is becoming apparent that many sources are a mixture of the two (Page et al., this proceedings). It has been suggested that all narrow line galaxies harbour obscured AGN (Schmidt et al. 1998), however here we describe two sources for which the X-ray emission is purely due to starburst activity.
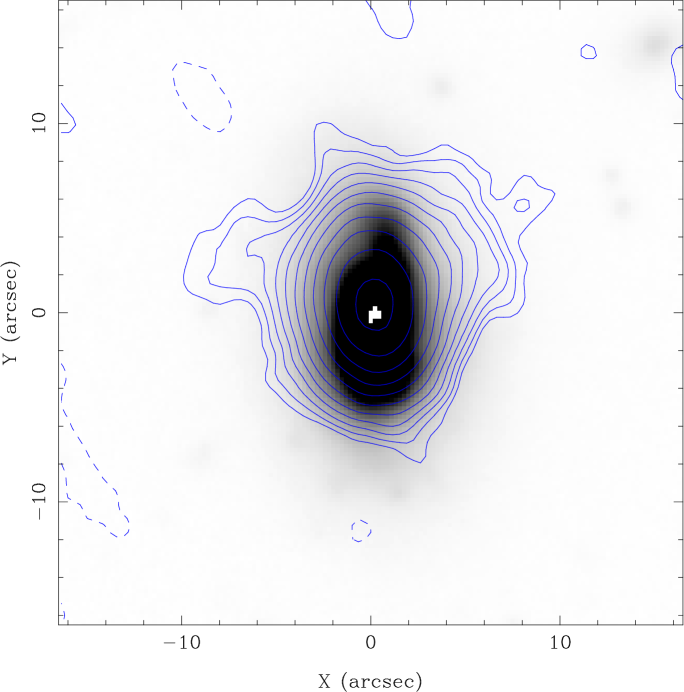
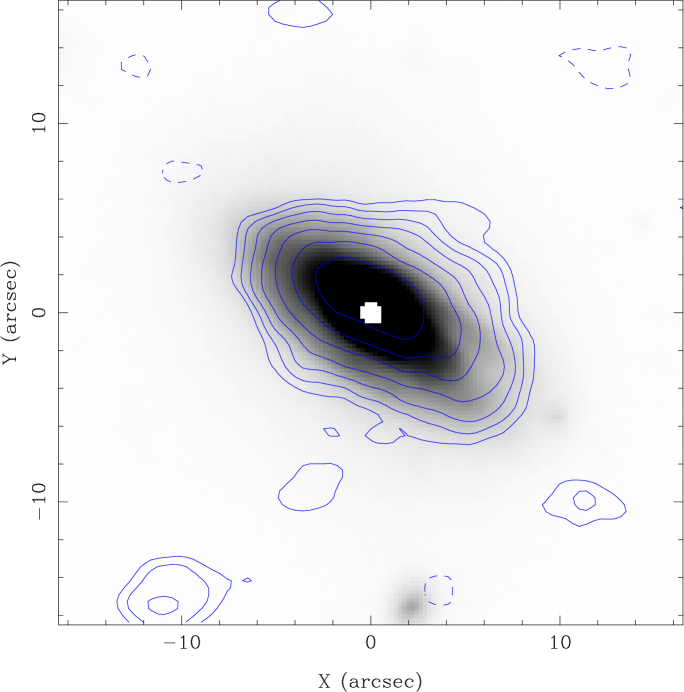
Fig. 7 shows Subaru –band images of the ROSAT source R117 (left, Gunn et al. 2001) and the Chandra source C146 (right) with radio contours overlaid. For both galaxies, which are optically bright (), X-ray faint (), ie, low , the radio emission has a steep spectrum () tracing the optical extent of the galaxy, and XMM shows a very soft thermal spectrum, consistent with a starburst origin. Furthermore, R117 is not detected by Chandra, suggesting that the X-ray emission may be extended. If R117 was a point source, it would have to be a factor of three fainter than observed with ROSAT to remain undetected by Chandra at this offaxis angle. The three optically brightest emission line galaxies in our sample are starbursts. Optically fainter emission line galaxies, however, probably contain an AGN contribution.
3 Conclusions
From our VLA data, we obtain radio spectral and morphological information which, in combination with Chandra and XMM X-ray data, enable us to show the following results:
-
•
55/214 Chandra sources are faint (28Jy peak flux) radio sources.
-
•
Faint X-ray and faint radio emission is detected from a variety of sources, including relatively ‘normal’ galaxies and QSOs.
-
•
Wide ranges of and imply a wide variety of emission mechanisms.
-
•
At least one third of X-ray/radio matches are normal broad line AGN.
-
•
The two optically brightest absorption line galaxies are almost certainly BL Lacs.
-
•
The three optically brightest emission line galaxies are starbursts.
Acknowledgements.
This work was supported by grants to a number of authors from PPARC and NASA. IMcH also acknowledges receipt of a PPARC Senior Research Fellowship.References
- [1] Almaini, O. et al.: 1995, MNRAS 277, L31
- [2] Bauer, F.E., et al.: 2002, AJ 124, 2351
- [3] Bertin, E. & Arnouts, S.: 1996, A&AS 117, 393
- [4] Condon, J.J.: 1992, ARA&A 30, 575
- [5] di Matteo, T., Fabian A.C.: 1997, MNRAS 286, L50
- [6] Gunn, K.F., et al.: 2001, MNRAS 324, 305
- [7] Ivison, R.J., et al.: 2002, MNRAS 337, 1
- [8] McHardy, I.M., et al.: 1998, MNRAS 295, 641
- [9] McHardy, I.M., et al.: 2002, MNRAS in press
- [10] Mushotzky, R.F. et al.: 2000, MNRAS 404, 459
- [11] Richards, E., et al.: 1998, AJ 116, 1039
- [12] Romero-Colmenero, E., et al.: 1996, MNRAS 282, 94
- [13] Schmidt, M., et al.: 1998, A&A 329, 495