00 \Year0000 \Month00 \Pagespan000000 \lhead[0]M.J. Page et al.: X-ray and optical properties of faint X-ray sources \rhead[Astron. Nachr./AN XXX (200X) X]0 \headnoteAstron. Nachr./AN 32X (200X) X, XXX–XXX
X-ray and optical properties of X-ray sources in the 13hr XMM-Newton/Chandra deep survey
Abstract
The 13hr XMM-Newton/Chandra deep survey is the first of two extremely deep XMM-Newton fields observed by the XMM-OM consortium. A 120 ks Chandra mosaic, covering 0.2 deg2, provides sensitive, confusion-free point source detection with sub-arcsecond positions, while the 200 ks XMM-Newton observation provides high quality X-ray spectroscopy over the same sky area. We have optical spectroscopic identifications for 70 X–ray sources. Of these, 42 are broad emission-line AGN with a wide range of redshifts. The optical counterparts of a further 23 sources are narrow emission line galaxies and absorption line galaxies. These 23 sources all lie at and typically have lower X–ray luminosities than the broad-line AGN. About half of them show significant X–ray absorption and are almost certainly intrinsically absorbed AGN. However some of them have unabsorbed, AGN-like, power-law components in their X–ray spectra, but do not show broad emission lines in their optical spectra. These sources may be weak, unobscured AGN in bright galaxies and their existence at low redshifts could be a consequence of the strong cosmological evolution of AGN characteristic luminosities.
keywords:
surveys — X–rays — galaxies: active — galaxies: evolutionmjp@mssl.ucl.ac.uk
1 Introduction
Above 1 keV, the cosmic X–ray background (CXRB) is predominantly the integrated emission of many discrete sources. In the 0.5-2 keV X–ray band, the deepest surveys with ROSAT resolved 70-80% of the X–ray background into individual sources, the majority of which are broad-line AGN (e.g. Hasinger et al. 1998, McHardy et al. 1998). However the energy density of the CXRB peaks at much higher energy, keV, and to reproduce its broadband spectral shape, CXRB synthesis models require a large population of hard-spectrum X–ray sources. The most enduring of these synthesis models invoke a large population of absorbed AGN, as expected in AGN ‘unification schemes’ (Setti and Woltjer 1989, Comastri et al. 1995, Gilli, Risaliti & Salvati 1999). Deep surveys performed with XMM-Newton and Chandra have now succeeded in resolving a large fraction of the CXRB up to 10 keV (e.g. Brandt et al., 2001, Campana et al. 2001, Hasinger et al., 2001). The X-ray and optical properties of the Chandra and XMM-Newton sources will allow us to test these synthesis models.
The 13hr deep field is a project to investigate the astrophysics of the major contributors to the CXRB, particularly sources around the break in the X–ray source counts where the contribution to the CXRB per log-flux interval peaks. In order to understand the phenomena, processes and conditions in these sources we combine the high quality X–ray spectra of XMM-Newton with the precise positions of Chandra and a host of other multi-wavelength data. The 13hr field was the location of one of the deepest ROSAT surveys (McHardy et al. 1998) and is a region of extremely low Galactic absorption ( cm-2).
2 Observations
The 13hr deep field was observed with four separate Chandra ACIS-I pointings, resulting in a mosaic of Chandra images which covers 0.2 deg2. A total of 214 point sources are detected to a limiting flux of erg cm-2 s-1 in the 0.5-7 keV energy band, and for the majority of these positions are accurate to 1′′ (McHardy et al. 2003).
XMM-Newton observations totalling 200 ks were performed in June 2001. After processing with the XMM-Newton SAS, the EPIC event lists were time-filtered to remove background flares resulting in 130ks of good data. Images and exposure maps for the three EPIC cameras combined were constructed in the energy bands 0.2-0.5 keV, 0.5-2.0 keV, 2.0-5.0 keV and 5.0-12.0 keV. Source searching was performed with the SAS EBOXDETECT and EMLDETECT tasks. Background maps were constructed by excising the sources from the images and then performing a maximum-likelihood fit with uniform, vignetted and unvignetted backgrounds. Several iterations of source-detection, source-excision and background fitting were performed to optimise the source detection. The on-axis flux limits in the individual energy bands are erg cm-2 s-1 (0.2-0.5 keV), erg cm-2 s-1 (0.5-2.0 keV), erg cm-2 s-1 (2-5 keV), and erg cm-2 s-1 (5-12 keV). In total 216 sources are detected in the XMM-Newton images; three quarters of the sources are detected independently with both XMM-Newton and Chandra. 123 XMM-Newton sources have counts, and therefore have useful X-ray spectra.


In order to identify the optical counterparts to the X–ray sources we have taken deep images on the Subaru Telescope, the William Herschel Telescope, the Isaac Newton Telescope, and the 4m at Kitt Peak. The deepest imaging comes from Suprime-Cam on Subaru and reaches 27. About 80% of the X-ray sources have optical counterparts with and with few exceptions these counterparts are unambiguous. We recently obtained multi-object optical spectroscopy with AF2/WYFFOS on the WHT and with LRIS on Keck. Combined with the existing optical spectra which were taken as part of the ROSAT survey follow up, we have optical identifications and redshifts for 70 X-ray sources, most of which have .
3 Optical and X-ray spectroscopic properties
| Optical | Number | ratio | ||
|---|---|---|---|---|
| classification | absorbed:unabsorbed | |||
| BLAGN | 42 | 1.52 | 2.1 | 3:29 |
| NELGs | 17 | 0.36 | 1.9 | 6:5 |
| Galaxies | 6 | 0.41 | 2.2 | 2:3 |
| Stars | 5 | - | - | - |
We have divided the extragalactic spectroscopically-identified Chandra sources according to their emission line properties. Sources which show broad (FWHM km s-1) emission lines (i.e. QSOs and type 1 Seyferts) are classed as broad-line AGN (BLAGN). Sources which show only narrow emission lines are classed as narrow emission line galaxies (NELGs). Sources for which no emission lines can be discerned in the optical spectra are classed simply as ‘galaxies’. Table 1 provides the current optical identification statistics. The redshift distributions of the sources are shown in Fig.1. The BLAGN cover a wide range of redshifts, but the NELGs and galaxies all have .
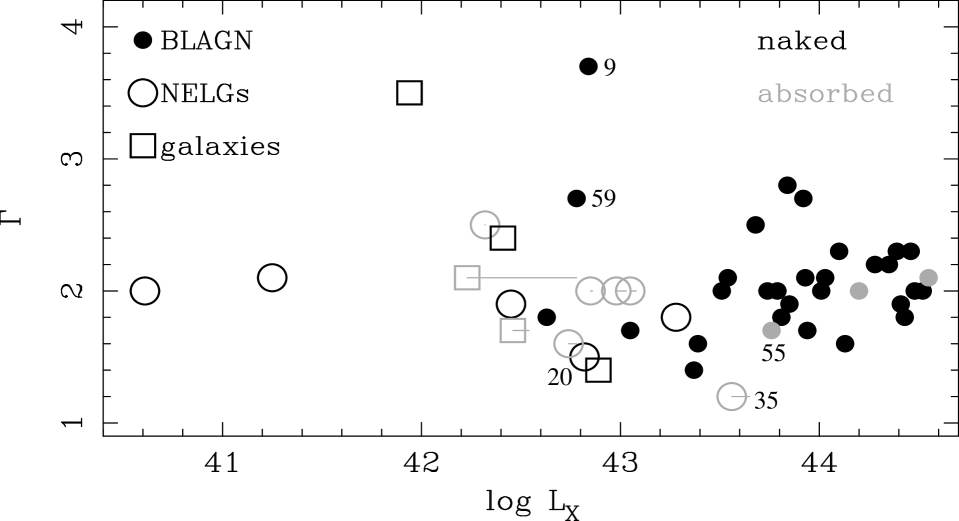
For all those identified sources with EPIC counts we have constructed and modeled the X-ray spectra (see Fig. 2). To each spectrum we have fitted an absorbed power law model. We have classified a source as absorbed if either (i) the fit without intrinsic absorption was rejected at confidence and was acceptable when absorption was included or (ii) the of the fit was significantly better with intrinsic absorption (at significance according to the F-test) than without. The best fit photon indices are shown as a function of luminosity in Fig. 3. Some of the spectra are certainly more complex than an absorbed power law, requiring e.g. an additional soft component (as seen in Fig. 2c); in these cases the photon index shown in Fig. 3 is for the dominant power law component. To calculate the luminosities of the sources we have used the 2-5 keV flux measured with EPIC because this band requires only a small correction for intrinsic absorption in most cases; this correction is shown as a horizontal line for absorbed sources in Fig. 3. All the luminosities were K-corrected using the best fit spectral slopes, and we assumed km s-1 Mpc-1 and =0.5.
4 Discussion
As seen in Fig. 3, the underlying spectral indices of the sources are scattered around the mean value of with a standard deviation of , and show no obvious dependence on luminosity, absorption, or optical classification. Furthermore, the distribution of spectral indices is remarkably similar to that found in brighter, soft X–ray selected samples (e.g. Mittaz et al. 1999). Thus the XMM-Newton spectroscopy is consistent with a picture in which the underlying power law X-ray spectra of AGN do not depend on redshift or luminosity, and are the same in the absorbed and unabsorbed sources.
In the context of the ‘standard’ picture of the X-ray populations, the majority of the NELGs and galaxies, and certainly those with erg s-1, are expected to be intrinsically absorbed AGN. As seen in Table 1 and Fig. 3, absorption is detected in of the galaxies and NELGs compared to only of the BLAGN; these latter sources have and column densities between cm-2 and cm-2 and so are similar to the luminous, X-ray absorbed, BLAGN found in the hard-spectrum ROSAT survey of Page, Mittaz & Carrera (2001). Thus a significant fraction of the NELGs and galaxies are indeed absorbed AGN, as reported for the Lockman Hole (Mainieri et al. 2002).
However, a significant fraction () of the galaxies and NELGs do not show strong evidence for X–ray absorption, but have power-law (i.e. AGN-like) X–ray spectra and the majority of them have AGN X–ray luminosities. The lack of broad emission lines in these sources is not readily explained as an absorption effect: assuming a Galactic dust to gas ratio, a column density of cm-2 is required to attenuate broad lines such as H by a factor of 10. Such column densities are readily detectable for the (mostly low-) galaxies and NELGs.

One feature that is noticeable in Fig. 3 is that the X–ray sources classified as NELGs and galaxies typically have lower X–ray luminosities than the BLAGN. This is true for both the X–ray absorbed and unabsorbed NELGs and galaxies, even after corrections for absorption: none of the NELGs or galaxies have log , but the majority of the BLAGN have log . A likely explanation for the lack of broad emission lines in the unabsorbed galaxy and NELG sources is therefore simply one of contrast: these sources are weak (e.g. factor 10 underluminous) AGN in bright host galaxies. In fact even amongst the sources which are classified as BLAGN, we can see this kind of phenomenon: Fig. 4 shows one such source, which is only recognisable as a BLAGN in the rest frame UV where the host galaxy is weak. Thus the optical classification of the lower luminosity AGN is likely to have a complex dependancy on both redshift and the host-galaxy luminosity. However, the presence of significant power law components in the X–ray spectra of NELGs and galaxies demonstrates that they do contain AGN; this has important implications for the evolution of the AGN X–ray luminosity function (e.g. see Page et al. 1997). Similar hypotheses of AGN/host-galaxy contrast have also been proposed to hide emission lines in Seyfert 2 galaxies (Lumsden & Alexander 2001; Moran, Filippenko & Chornock 2002). Another mechanism which can make broad emission lines undectable is beamed continuum emission from BL Lacs; there are at least two examples of this type of object in the 13hr field (see Gunn et al. this proceedings).
If the lack of broad lines in X–ray unabsorbed AGN is a consequence of the relative brightness of AGN and their host galaxies, the cosmological evolution of AGN may offer an explanation as to why a large fraction of NELGs and galaxies (and the equivalent sources in Rosati et al. 2002 and Mainieri et al. 2002) are found predominantly at . The characteristic luminosity (i.e. the break in the luminosity function) of AGN has declined dramatically (by a factor ) since at both X–ray (e.g. Page et al. 1997) and optical wavelengths (e.g. Boyle et al. 2000). Unless the host galaxies of AGN have declined in luminosity by a similar amount, the contrast between AGN and host galaxy will typically be smaller today than it was at high redshift.
Acknowledgements.
Based on observations obtained with XMM-Newton, an ESA science mission with instruments and contributions directly funded by ESA Member States and the USA (NASA).References
- [1] Boyle, B.J., Shanks, T., Croom, S.M., Smith, R.J., Miller, L., Loaring N., Heymans C.: 2000, MNRAS 317, 1014
- [2] Brandt, W.N., et al.: 2001, AJ 122, 2810
- [3] Campana, S., Moretti, A., Lazzati, D., Tagliaferri, G.: 2001, ApJ560, L19
- [4] Comastri, A., Setti, G., Zamorani, G., Hasinger, G.: 1995, A&A 296, 1
- [5] Gilli, R., Risaliti, G., Salvati, M.: 1999, A&A 347, 424
- [6] Hasinger, G., Burg, R., Giacconi, R., Schmidt, M., Trum̈per, J., Zamorani, G.: 1998, A&A 329, 482
- [7] Hasinger, G., et al.: 2001, A&A 365, L45
- [8] Lumsden, S.L., Alexander, D.M.: 2001, MNRAS 328, L32
- [9] Mainieri, V., et al.: 2002, A&A 393, 425
- [10] McHardy, I.M., et al.: 1998, MNRAS 295, 641
- [11] McHardy, I.M., et al.: 2003, MNRAS submitted
- [12] Mittaz, J.P.D., et al.: 1999, MNRAS 308, 233
- [13] Moran, E.C., Filippenko, A.V., Chornock, R.: 2002, ApJ in press (astro-ph/0210047)
- [14] Page, M.J., Mason, K.O., McHardy, I.M., Jones, L.R., Carrera, F.J.: 1997, MNRAS 291, 324
- [15] Page, M.J., Mittaz, J.P.D., Carrera, F.J.: 2001, MNRAS 325, 575
- [16] Rosati, P., et al.: 2002, ApJ 566, 667
- [17] Setti, G., Woltjer, L.: 1989, A&A 224, L21