Detection of HCN Direct -Type Transitions Probing Hot Molecular Gas in the Proto-Planetary Nebula CRL 618
Abstract
We report the detection of direct -type transitions towards the proto-planetary nebula CRL 618 during a study of vibrationally excited carbon chains. The transitions of HCN in its first excited bending mode were detected in absorption against the continuum of the central H ii region making use of the Effelsberg 100 m telescope and the Very Large Array. Additionally, the direct -type transition was detected in emission presumably indicating a weak maser. All lines are blueshifted with respect to the systemic velocity of CRL 618 indicating that the lines originate from a hot, expanding circumstellar envelope. The HCN column density along the line of sight in front of the continuum is cm-2.
1 Introduction
Molecules in vibrationally excited states are unique tools to study hot molecular gas in interstellar and circumstellar environments. The vibrationally excited states can be pumped by IR radiation in the dusty environment close to the exciting object (see e.g. Schilke et al. 1992, 2000 or Wyrowski et al. 1999 and references therein).
A linear molecule with atoms has vibrational modes. For HCN, this yields four vibrational modes111For the sake of clarity it should be recalled that is used to denote a certain vibrational mode or the frequency whereas denotes the vibrational quantum number., two of which are stretching modes (CN stretch , CH stretch ), and the bending mode () which is doubly degenerate since the molecule is free to bend in two orthogonal planes. If the molecule is bending and rotating simultaneously, the degeneracy is lifted giving rise to a phenomenon denoted -type doubling: The degenerate bending state can be regarded as having components of an additional angular momentum about the figure axis with . For a first excited bending mode causes the splitting of every rotational level into two sublevels. Now two different types of transitions with either or may occur, the latter being denoted direct -type transitions (cf. Figure 1). Since the splitting of the sublevels of a given is rather small, the corresponding transitions occur at low frequencies. For a molecule in a first excited bending mode those are to first order given by , where is the -type doubling constant ( MHz).
In the laboratory, direct -type transitions were first measured by Shulman and Townes (1950) for the molecules HCN and OCS. In space, rotational transitions of vibrationally excited HCN (, ; “vibrational satellites”) were first detected by Ziurys and Turner (1986) toward Orion-KL and IRC+10216. Meanwhile, HCN was also detected in much higher vibrationally excited states (e.g. , Schilke et al. 2000; Schilke and Menten 2002). A detection of the direct -type transition of HCN () in IRC+10216 has previously been reported by Cernicharo et al. (1996), although no details are given.
We started a detailed study of vibrationally excited carbon chain molecules toward the protoplanetary nebula CRL 618 at radio and millimeter wavelengths to examine their radial distribution by measuring their vibrational temperatures. In this letter, we report the first detection of seven consecutive direct -type transitions of HCN () at cm wavelengths, commencing with through 14. The results on the higher cyanopolyynes HC3N and HC5N are reported separately (Wyrowski et al., 2002; Thorwirth, 2001).
2 Observations
2.1 Effelsberg 100 m observations
The observations were performed during 8 observing sessions from 1999 March to 2002 January employing the 100 m radiotelescope of the Max-Planck-Institut für Radioastronomie at Effelsberg, Germany. As frontends the 0.65 cm, 1 cm, 1.3 cm, and 1.9 cm HEMT receivers with typical receiver temperatures from 30 to 70 K, respectively, were used. The FWHM beam widths and the frequencies of the HCN lines are given in Table 1. Pointing was checked every one to two hours on CRL 618 itself or other appropriate radio sources resulting in an average pointing accuracy of 4″. The intensity scale was established using continuum drift scans on W3(OH), NGC 7027 and 3C147 and comparing with the flux densities given by Ott et al. (1994) . Pointing scans on CRL 618 were used to determine its flux density relative to these calibration sources (Table 1).
2.2 CSO observations
Spectra of the line of HCN in its bending mode were obtained in 1999 December with the 10.4 m telescope of the Caltech Submillimeter Observatory (CSO)222The CSO is operated by the California Institute of Technology under funding from the National Science Foundation, Grant No. AST-9980846. with a system temperature of 600 K. The line was observed in the upper sideband and several different observing frequencies were used to avoid blending from lines in the lower sideband. The spectrometer and observing procedure are described by Menten and Young (1995). The CSO beamsize at 356 GHz is 26″ and we assumed a beam efficiency of 78% (taken from the CSO webpage).
2.3 VLA observations
CRL 618 was observed in the direct -type transition (cf. Table 1) with the Very Large Array (VLA333The VLA is operated by the National Astronomy Observatory, a facility of the National Science Foundation operated under cooperative agreement by Associated Universities, Inc.) in its B configuration, leading to an angular resolution of 0.12 ′′. At the time of the observations, 15 antennas were equipped with 0.7 cm receivers. A total bandwidth of 6.25 MHz was observed with 128 channels and the spectral resolution was 48.8 kHz. The total time on source was 3.5 h. Regular observations of 0555+398, 3C48 and 3C84 were used for amplitude, flux and bandpass calibration, respectively. The phase was selfcalibrated on the strong continuum emission from CRL 618.
The remaining non Q-band antennas were used to observe the direct -type transition at 4488.48 MHz. No line was detected at an RMS noise level of 4 mJy in 0.8 km/s wide channels. The total continuum flux at this frequency is mJy.
3 Results and Discussion
Figure 2 shows the direct -type lines observed toward CRL 618 and the line parameters from Gaussian fits to the spectra are given in Table 1. The direct -type transitions appear as absorption lines towards the continuum of the H ii region with line velocities of approximately km s-1. The systemic velocity of CRL 618 is 24.2 km s-1 (Wyrowski et al., 2002), hence all of the observed lines are blueshifed relative to indicating that the lines originate from a hot, expanding circumstellar envelope. To determine the physical conditions of the absorbing gas, we used a spherical LTE model of an expanding envelope, developed to interpret our observations of vibrationally excited HC3N derived by (Wyrowski et al., 2002). To fit the HCN lines we use the temperature, density and velocity structure of the expanding envelope, which fits the HC3N lines, and only vary the HCN abundance. Using a temperature of 560 K (see discussion below) a HCN column density of cm-2 is needed to cause the observed absorption. The resulting fits to the spectra are shown in Figure 3 together with a spectrum of the HC3N transition which has a similar upper energy ( K) Since no continuum flux measurements were performed at 350 GHz, the HCN spectra are shown in brightness temperature units, whereas for the other spectra the ratio of line to continuum temperature, which reduces calibration uncertainties, is shown. The deviation of the HCN model from the observed spectrum could be due to pointing and/or focus errors: a pointing error of 10″ alone would explain the difference between observation and model and cannot be excluded. The model consists of power laws for temperature, density and velocity starting at an inner radius of 0.11″ and an H ii region within that radius, which fits the continuum measurements of CRL 618. The temperature at the inner radius is 560 K. In the model, the HCN line is highly optically thick and mostly sensitive to the model temperature and the emitting size. The HCN direct -type lines, on the other hand, are optically thin and probe a combination of temperature and column density of the model. The best fit model has a HCN/HC3N abundance ratio of 3 to 6 dependent on the assumed population of the vibrational levels of HC3N which is consistent with the result obtained by mid-infrared absorption measurements by Cernicharo et al. (2001).
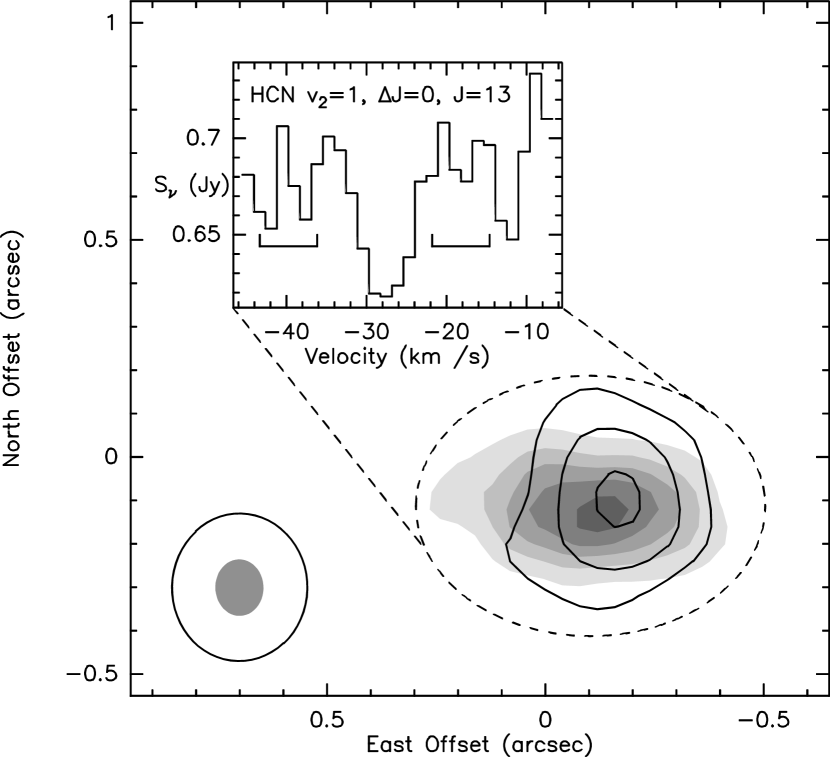
Figure 4 shows the results of the VLA observations. The total continuum flux density at 40 GHz, estimated from the flux on the shortest baselines, is 0.75 Jy with an uncertainty of 10%. The size of the continuum emission is ″, estimated from a Gaussian fit to the UV data. To increase the spectral sensitivity, every four channels were averaged together and a taper in the UV plane was applied, reducing the angular resolution to ″. The insert in Figure 4 shows the spectrum integrated over the indicated area. Line parameters of a Gaussian fit to the spectrum are given in Table 1. To image the HCN absorption the continuum was subtracted from the data using the channel ranges marked in the insert of Figure 4. The contours in Figure 4 show the HCN absorption averaged over the line.
The observed 40 GHz continuum emission compares well with the results of Martín-Pintado et al. (1993, 1995) at 23 GHz. The HCN absorption falls into the same velocity range as the hot core (HC) component seen in ammonia by Martín-Pintado & Bachiller (1992). The HCN absorption is slightly shifted to the west from the center of the continuum, which was also observed for the HC ammonia component and the hot dense disk observed by Martín-Pintado et al. (1995). However, no absorption is observed at the ammonia broad absorption velocity of 50 km which Martín-Pintado et al. (1993, 1995) interpreted as occurring from post-shocked clumps. Accordingly, the HCN absorption most likely originates from the same volume of gas as the ammonia hot core component and the dense disk.
A weak maser?
In contrast to the transitions appearing as absorption lines toward the continuum, the transition is found in emission. Blending with an unknown line cannot be ruled out entirely, but to the best of our knowledge there is no known transition of a different molecule, and no trace of a absorption (which would modify the emission-profile of the blending line) is seen. Moreover, the (blueshifted) velocity and the line width correspond well to the velocities and linewidths of the transitions. In particular the linewidth argument is compelling, since other emission lines are much broader (e.g. the linewidth of the HC7N transition is 27 km s-1, Martín-Pintado & Bachiller, 1992). These facts suggest that the transition is a weak maser amplifying the continuum. Its optical depth has a different sign, but is similar in value to the absorption lines.
How can this maser be understood? A quantitative analysis would require quite detailed modeling of the pumping mechanism, which is not feasible because many of the transition rates (in particular collision rates between vibrational states and within the vibrationally excited state) are not or only poorly known. However, one can argue as follows that this transition is easily perturbed or inverted: The splitting due to -type doubling is much smaller than the rotational splitting. Considering the rotational level system , and assuming that the excitation temperature of the is (and equal to ), while the excitation temperature for the (upper) states is taken to be (with ), one can show that inversion occurs () if the following condition is met:
| (1) |
In terms of occupation numbers, a difference = 2.5% means that for an excitation temperature of 560 K, the occupation of the level needs to be elevated in population by only 0.17% with respect to a completely thermalized distribution to invert the direct -type transition. If one considers the populations relative to the vibrational ground state, similar arguments can be made. A similar system is the ammonia molecule, where the inversion splitting is much smaller than the rotational splitting, and indeed, some masers are found for ammonia as well (see Schilke, Walmsley & Mauersberger 1991 or Madden et al. 1986). It has to be emphasized that the actual pumping mechanism is probably quite different for the ammonia masers, the similarity is that it is not difficult to produce masers in the inversion lines.
Having argued that a small perturbation is sufficient, we still have to identify a possible cause for perturbations in our -type system. One good candidate is a line overlap. Such a mechanism has been invoked successfully for pumping of OH masers (e.g. Cesaroni & Walmsley 1991), although the details of the pumping mechanism are different. One possible candidate responsible for a perturbation in the levels is an overlap of rotational lines of the vibrationally excited molecule: For the and transitions of the and states the components and are separated by only 11 and 58 MHz444, , at 712361 MHz; , , at 712372 MHz; , , at 801421 MHz; , , at 801363 MHz, respectively, corresponding to km s-1 and km s-1. Accordingly, the first overlap could occur locally whereas the second one could connect different parts of the envelope. A corresponding maser effect has been observed for SiO masers by Cernicharo et al. (1991, 1993).
HCN Direct -type transitions in High-Mass Star-Forming Regions
Initiated by the results presented here, additional searches for direct -type transitions of HCN have been performed towards high-mass star forming regions. So far, we were able to detect the transition toward Orion-KL and Sgr B2(N) and the transitions toward G10.47+0.03 using the Effelsberg 100 m telescope (Thorwirth et al., in preparation). Direct -type transitions are optically thin and hence can be used to derive reliable column density estimates of the hot gas component. Moreover, the VLA observations of CRL 618 presented here demonstrate that this special kind of transitions can be used to observe hot gas at high angular resolution and low frequencies.
4 Summary
Using the Effelsberg 100m telescope and the VLA, we have detected seven direct -type transitions of HCN in its state. All lines appear in absorption against the embedded H II region, except for the transition, which shows weak maser action. The observed line velocities agree well with those observed in vibrationally excited HC3N by Wyrowski et al. (2002), who used their extensive data to model the physical parameters of the hot, dense emission region. VLA observations of the line reveal the emission region is compact and covers only the western part of the embedded H ii region, similarly to ammonia. Since in addition to CRL 618 we detected -type HCN lines toward hot molecular cores in regions of high-mass star formation, they also represent an interesting new tool to study the immediate vicinity of young (proto-)stellar objects.
Triggered by the radioastronomical observations presented here, a laboratory investigation of direct -type transitions of HCN () has been carried out in the Cologne laboratory covering rotational quantum numbers up to at 278.7 GHz (Thorwirth et al., in preparation) The complete analysis will be presented in a following paper.
References
- Brown et al. (1975) Brown, J. M., Hougen, J. T., Huber, K.-P., Johns, J. W. C., Kopp, I., Lefebvre-Brion, H., Merer, A. J., Ramsay, D. A., Rostas, J., & Zare, R. N. (1975), J. Mol. Spectrosc., 55, 500
- Cernicharo et al. (1991) Cernicharo, J., Bujarrabal, V., Lucas, R. 1991, A&A, 249, L27
- Cernicharo et al. (1993) Cernicharo, J., Bujarrabal, V., Santarén, J. L. 1993, ApJ, 407, L33
- Cernicharo et al. (1996) Cernicharo, J., Barlow, M. J., Gonzalez-Alfonso, E., Cox, P., Clegg, P. E., Nguyen-Q-Rieu, Omont, A., Guelin, M., Liu, X.-W., Sylvester, R. J., Lim, T., Griffin, M. J., Swinyard, B. M., Unger, S. J., Ade, P. A. R., Baluteau, J.-P., Caux, E., Cohen, M., Emery, R. J., Fischer, J., Furniss, I., Glencross, W. M., Greenhouse, M. A., Gry, C., Joubert, M., Lorenzetti, D., Nisini, B., Orfei, R., Pequignot, D., Saraceno, P., Serra, G., Skinner, C. J., Smith, H. A., Towlson, W. A., Walker, H. J., Armand, C., Burgdorf, M., Ewart, D., di Giorgio, A., Molinari, S., Price, M., Sidher, S., Texier, D., & Trams, N. 1996, A&A, 315, L201
- Cernicharo et al. (2001) Cernicharo, J., Heras, A. M., Tielens, A. G. G. M., Pardo, J. R., Herpin, F., Guelin, M., & Waters, L. B. F. M. 2001, ApJ, 546, L123
- Cesaroni & Walmsley (1991) Cesaroni, R, & Walmsley, C.M. 1991, A&A, 241, 537
- Madden et al. (1986) Madden, S.C., Irvine, W.M., Matthews, H.E., Brown, R.D., & Godfrey, P.D. 1986, ApJ, 300, L79
- Maki (1974) Maki, A. G. 1974, J. Chem. Phys. Ref. Data, 3, 221
- Martín-Pintado & Bachiller (1992) Martín-Pintado, J., & Bachiller, R. 1992, ApJ, 391, L93
- Martín-Pintado et al. (1993) Martín-Pintado, J., Gaume, R., Bachiller, R., & Johnston K. 1993, ApJ, 419, 725
- Martín-Pintado et al. (1995) Martín-Pintado, J., Gaume, R. A., Johnston K. J., & Bachiller, R. 1995, ApJ, 446, 687
- Menten and Young (1995) Menten, K. M., & Young, K. 1995, ApJ, 450, L67
- Ott et al. (1994) Ott, M., Witzel, A., Quirrenbach, A., Krichbaum, T. P., Standke, K. J., Schalinski, C. J., & Hummel, C. A. 1994, A&A, 284, 331
- Schilke, Walmsley & Mauersberger (1991) Schilke, P., Walmsley, C.M., & Mauersberger, R., 1991, A&A, 247, 516
- Schilke et al. (1992) Schilke, P., Güsten, R. Schulz, A., Serabyn, E., & Walmsley, C.M. 1992, A&A, 261, L5
- Schilke et al. (2000) Schilke, P., Mehringer, D. M., & Menten, K. M. 2000, ApJ, 528, L37
- Schilke and Menten (2002) Schilke, P., & Menten, K. M. 2002, ApJ, accepted
- Shulman and Townes (1950) Shulman, R. G., & Townes, C. H. 1950, Phys. Rev., 77, 421
- Thorwirth (2001) Thorwirth, S. 2001, Dissertation, Universität zu Köln
- Wyrowski et al. (1999) Wyrowski, F., Schilke, P., & Walmsley, C.M. 1999, A&A, 341
- Wyrowski et al. (2002) Wyrowski, F., Schilke, P., Thorwirth, S., Menten, K. M., & Winnewisser, G. 2002, ApJ, submitted
- Ziurys and Turner (1986) Ziurys, L. M., & Turner, B. E. 1986, ApJ, 300, L19
| Frequency aaLaboratory frequencies taken from Maki (1974). | ||||||||||
|---|---|---|---|---|---|---|---|---|---|---|
| 4 | 4488.48 | 1067 | bbNo line detected. | 26 | (3) | |||||
| 8 | 16148.55 | 1178 | 52 | ccLine detected in absorption without valid calibration. | 26.6 (3) | 3. | 8 (5) | |||
| 9 | 20181.40 | 1217 | 42 | 22 (4) | 27.0 (3) | 4. | 7 (7) | 425 | (60) | |
| 10 | 24660.31 | 1259 | 34 | 0.11 (3) | 26.6 (3) | 4. | 4 (6) | 490 | (90) | |
| 11 | 29584.66 | 1306 | 28 | 0.05 (1) | 27.0 (2) | 4. | 8 (6) | ddNo absolute flux calibrator available. | ||
| 12 | 34953.76 | 1358 | 24 | 0.07 (2) | 27.4 (2) | 5. | 1 (4) | 680 | (140) | |
| 13 | 40766.90 | 1413 | 0.33 | 0.11 (4) | 27.3 (7) | 5. | 4 (12) | 750 | (75) | |
| 14 | 47023.20 | 1473 | 20 | 0.11 (4) | 26.7 (4) | 4. | 9 (11) | 840 | (85) | |