Molecular Abundances in Barnard 68
Abstract
Abundances for C18O, CS, NH3, H2CO, C3H2, and N2H+ and upper limits for the abundances of 13CO and HCO+ are derived for gas within the Bok globule B68 using our own BIMA array data, single-dish data from the literature, and Monte Carlo radiative transfer models. B68 has had its density structure well determined, removing a major uncertainty from abundance determinations. All abundances for B68 are lower than those derived for translucent and cold dense clouds, but perhaps only significantly for N2H+, NH3, and C3H2. CS depletion toward the extinction peak of B68 is hinted at by the large offset between the extinction peak and the position of maximum CS line brightness. C18O and N2H+ abundances derived here are consistent with recently determined values at positions observed in common.
keywords:
ISM: molecules — ISM: abundances — ISM: globules1 Introduction
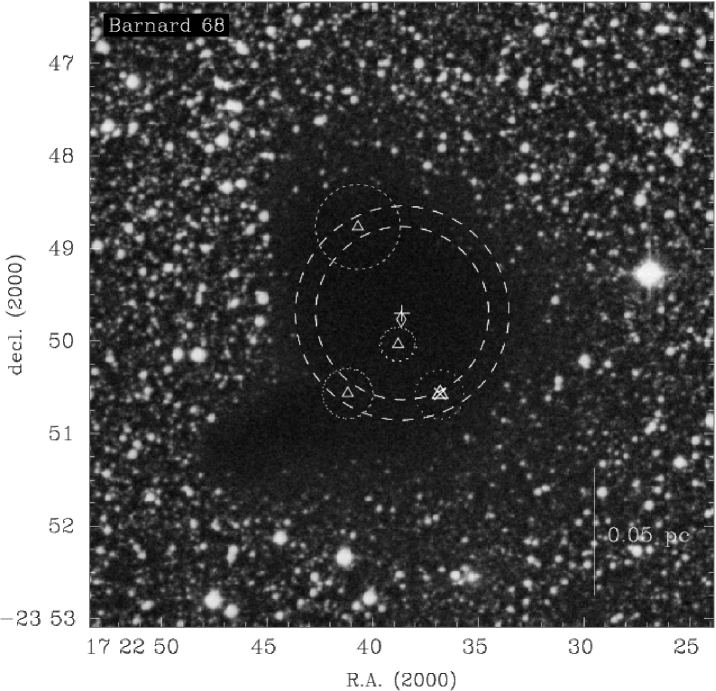
We examine the abundances of several molecular species in the Bok globule Barnard 68 (B68; Barnard 1919), located at 125 pc in Ophiuchus (de Geus, de Zeeuw, & Lub 1989) with no evidence for internal star formation. Figure 1 shows an -band image of B68 obtained from the Aladin sky atlas, revealing its compact morphology. Using the extinction of the background Galactic bulge population, Alves, Lada, & Lada (2001; ALL01) found a radial column density profile for B68 that was well matched with that of an isothermal Bonnor-Ebert sphere, specifically one with a near-critical center-to-edge density contrast of 16.5 (Bonnor 1956; Ebert 1955). This robust density determination removes a major uncertainty towards determining the molecular abundances in B68. Recently, Bergin et al. (2002) used single-dish maps of B68 in conjunction with models incorporating the ALL01 Bonnor-Ebert density structure to ascertain radial variations in C18O and N2H+ abundance, with the lowest values occurring toward the highest extinctions. We explore further abundances of these and other species in B68, also incorporating the ALL01 density structure into models.
2 Observations
Table 1 summarizes the data used to determine molecular abundances in B68, listing the lines used, the source observatory, the angular resolution, and the angular offset of the observation from the extinction peak. Figure 1 shows the position observed using the BIMA millimeter interferometer, approximately 4\arcsec north of the extinction peak. Figure 1 also shows the minimum and maximum FWHM sizes of the BIMA primary beams at the frequencies of 13CO 1–0 and HCO+ 1–0. Line emission was not detected with the BIMA array at any observed frequency or position toward B68. Table 1 also lists studies where detections of lines were made toward B68 from single-dish observations having angular resolutions 60\arcsec. Figure 1 shows the resolutions of these data and the positions where line characteristics were reported. Note that these positions, typically the locations of peak line intensity, vary widely across B68.
3 Abundances
Abundances were estimated using the 1D Monte Carlo code of Hogerheijde & van der Tak (2000) to calculate radiative transfer, molecular excitation, and line emission through a model of B68, and varying abundances until the output matched the observed data. Our B68 model had the thermal and density structures from ALL01, i.e., an isothermal sphere of T = 16 K with an outer radius of 12 500 AU and a “Bonnor-Ebert parameter” of 6.9 (i.e., center-to-edge density ratio of 16.5). The central density is 2.5 105 cm-3. Constant radial abundances were assumed. Although abundance gradients within B68 are quite possible (see Bergin et al.), they should not produce large differences in the derived abundances, given the small sizes of the beam widths relative to the spatial extent of B68. The velocity field of the gas was assumed to have a turbulent line width of 0.4 km s-1 (see Wang et al.) with no bulk motions.
To compare models with interferometer data, “visibility” datasets were produced from the model cubes using the baselines from the original data. These datasets were inverted, cleaned and restored in the same manner as the actual data, and velocity-integrated line intensities calculated. By properly accounting for spatial filtering, we estimated BIMA would have recovered only 20% of the flux emitted from an ALL01 Bonnor-Ebert sphere in B68. To compare models with single-dish data, the model cubes were convolved with Gaussians of widths appropriately representing the resolutions of the respective observations.
| Beam | Offset | |||
|---|---|---|---|---|
| Line | Site | (\arcsec \arcsec) | (\arcsec) | Ref. |
| 13CO 1–0 | BIMA | 17.1 4.7 | 4.03 | 1 |
| C18O 1–0 | BIMA | 17.7 4.5 | 4.03 | 1 |
| C18O 2–1 | CSO | 30 30 | 59.3 | 2 |
| CS 2–1 | FCRAO | 46 46 | 66.2 | 3 |
| HCO+ 1–0 | BIMA | 18.5 7.0 | 4.03 | 1 |
| N2H+ 1–0 | BIMA | 17.7 6.6 | 4.03 | 1 |
| N2H+ 1–0 | Haystack | 18 18 | 16.3 | 4 |
| NH3 (1,1) | Effelsberg | 40 40 | 54.5 | 5 |
| H2CO 312–211 | CSO | 30 30 | 59.3 | 2 |
| C3H2 212–101 | Haystack | 18 18 | 16.3 | 4 |
References — (1) this work, (2) Wang et al. 1995, (3) Launhardt et al. 1998, (4) Benson, Caselli & Myers 1998, (5) Lemme et al. 1996.
Table 2 lists the fractional abundances of the sampled molecular species at various positions toward B68. The BIMA data yield the first upper limits to the abundances of HCO+ toward the extinction peak of B68, as well as upper limits to the abundances of 13CO, C18O and N2H+ at the same location. In addition, single-dish data of B68 from the literature yield abundance values of H2CO, CS, NH3, and C3H2 toward B68 for the first time, but at positions offset from the extinction peak. Finally, other single-dish data of B68 from the literature yield new abundance values of C18O and N2H+ at some of these latter locations.
Table 2 lists fractional abundances from the literature for the species studied here, in clouds similar in character to B68. The first set, for “translucent clouds,” are those listed by Turner (2000) for round Clemens & Barvainis clouds with edge-to-center visual extinctions of 2.0. The second set, denoted for “cold dense clouds,” are those compiled by Ohishi, Irvine, & Kaifu (1992) toward TMC-1 or L134N. Turner notes that these abundances should not be regarded as universal as they can vary by an order of magnitude both between different translucent clouds and within larger, dense clouds. Every value of molecular abundance we derive for B68 is less than the lowest value derived for other clouds. However, only the N2H+, NH3, and C3H2 abundances differ by over an order of magnitude, and so only these species may be arguably depleted in B68, at least at the locations observed. However, Figure 1 and Table 2 show that less-discrepant abundances are found at positions relatively far from the extinction peak but more-discrepant abundances are found at positions closer to the extinction peak (except notably NH3). This pattern suggests C3H2 may be also depleted by some process related to extinction, e.g., the sublimation of gas-phase molecules onto grains, as suggested by Bergin et al. for C18O and N2H+. This same idea may also explain how CS and H2CO appear relatively undepleted in the outer, less-extincted radii of B68. Moreover, the lack of bright emission in CS near the extinction peak hints that CS may be also depleted at high extinction in B68.
| Translucent | ||||
|---|---|---|---|---|
| Species | B68 | Clouds | TMC-1 | L134N |
| 13CO | 1.3(-7) | 8.9(-7) | 8.9(-7) | |
| C18O | 1.3(-7) | 1.6(-7) | 1.6(-7) | |
| C18O | 3.0(-8) | 1.6(-7) | 1.6(-7) | |
| CS | 4.0(-10) | 1.1(-9) | 1(-8) | 1(-9) |
| HCO+ | 1.4(-10) | 2(-9) | 8(-9) | 8(-9) |
| N2H+ | 1.3(-10) | 1(-9) | 5(-10) | 5(-10) |
| N2H+ | 2.0(-11) | 1(-9) | 5(-10) | 5(-10) |
| NH3 | 7.0(-10) | 2.1(-8) | 2(-8) | 2(-7) |
| H2CO | 4.0(-10) | 6.3(-9) | 2(-8) | 2(-8) |
| C3H2 | 1.2(-11) | 3.6(-8) | 3(-8) | 2(-9) |
Note — Derived from 12CO abundance assuming 12C/13C = 90 or 16O/18O = 500.
Note — denotes
For their abundance estimates for B68, Bergin et al. assumed a Zucconi et al. temperature profile. They found the C18O abundance in B68 rises from very low values at 1 to a peak of 1 10-7 at = 2, and decreases to 1 10-9 at 20, a contrast of 100. Also, they found the N2H+ abundance rises from very low values at 1 to a peak of 6 10-11 at = 3, and decreases to 3 10-11 at 20, a contrast of 2. Any evidence of N2H+ depletion is remarkable, given its oft-described utility as a non-depleting probe of dense core interiors (e.g., see Tafalla et al. 2002.)
Adopting the same temperature profile in our models, derived abundances are increased by factors of 2-3 from those listed in Table 2. Our interferometer data of C18O and N2H+ do not provide much additional support for the abundance models of Bergin et al., except that the non-detection of compact line emission with BIMA suggests the low abundances found by Bergin et al. are not due to the beam dilution of small clumps of relatively abundant material. Our derived upper limits for C18O and N2H+ from the BIMA data are not particularly low, but they remain consistent with the still-lower values found by Bergin et al. throughout the core.
The single-dish C18O and N2H+ data from the literature only pertain to one line-of-sight per transition toward B68, but provide strong support for the abundances derived by Bergin et al., again assuming the same Zucconi et al. temperature profile. The C18O literature data, from a position 59\farcs4 offset from the extinction peak, yield an apparent abundance of 6–9 10-8, quite consistent with their 3–9 10-8 abundances at this position. Also, the N2H+ literature data, from a position 16\farcs3 offset from the extinction peak, yield an apparent value of 4–6 10-11, slightly larger than but still consistent with their 3–4 10-11 abundance at this position.
Acknowledgements.
JD was supported by the Radio Astronomy Laboratory. MRH was supported by the Miller Institute for Basic Research in Science. We thank Charles J. Lada, João Alves, Tracy Huard, and Jon Swift for valued discussions. This research made use of the SIMBAD database and Aladin, both operated by CDS, Strasbourg, France.References
- [\astronciteMybook1999] Alves, J. F., Lada, C. J., & Lada, E. A. 2001, Nature, 409, 159 (ALL01)
- [\astronciteMybook1999] Barnard, E. E. 1919, ApJ, 49, 1
- [\astronciteMybook1999] Benson, P. J., Caselli, P, & Myers, P. C. 1998, ApJ, 506, 743
- [\astronciteMybook1999] Bergin, E. A., Alves, J., Huard, T., & Lada, C. J. 2002, ApJ, 570, L101
- [\astronciteMybook1999] Bonnor, W. B. 1956, MNRAS, 116, 351
- [\astronciteMybook1999] Clemens, D. P., & Barvainis, R. 1988, ApJS, 6
- [\astronciteMybook1999] de Geus, E. J., de Zeeuw, P. T., & Lub, J. 1989, A&A, 216, 44
- [\astronciteMybook1999] Ebert, R. 1955, Z. Astrophys., 37, 217
- [\astronciteMybook1999] Hogerheijde, M. R. & van der Tak, F. F. S. 2000, A&A, 362, 697
- [\astronciteMybook1999] Launhardt, R., Evans, N. J., II, Wang, Y., Clemens, D. P., Henning, Th., & Yun, J. L. 1998, ApJS, 119, 59
- [\astronciteMybook1999] Lemme, C., Wilson, T. L., Tieftrunk, A. R., & Henkel, C. 1996, A&A, 312, 585
- [\astronciteMybook1999] Ohishi, M., Irvine, W. M., & Kaifu, N. 1992, in IAU Symposium 150, Astrochemistry of Cosmic Phenomena: Proceedings of the 150th Symposium of the International Astronomical Union, ed. P. D. Singh (Dordrecht: Reidel), 171
- [\astronciteMybook1999] Tafalla, M., Myers, P. C., Caselli, P., Walmsley, C. M., & Comito, C. 2002, ApJ, 569, 815
- [\astronciteMybook1999] Turner, B. E. 2000, ApJ, 542, 837
- [\astronciteMybook1999] Wang, Y., Evans, N. J., II, Zhou, S., & Clemens, D. P. 1995, ApJ, 454, 217
- [\astronciteMybook1999] Zucconi, A., Walmsley, C. M., & Galli, D. 2001, A&A, 376, 650