Fast Photometry of Quiescent Soft X-ray Transients with the Gemini-South Acquisition Camera
Abstract
We present a compilation of high time-resolution photometric observations of quiescent soft X-ray transients obtained with the acquisition camera of Gemini-South. A0620–00 was observed with a short cycle time and high precision. Superimposed on the ellipsoidal modulation we find several prominent flares together with weaker continual variability. The flares seen sample shorter timescale than those reported in previous observations, with rise times as low as 30 s or less; most flares show unresolved peaks. The power density spectrum (PDS) of A0620–00 appears to exhibit band-limited noise closely resembling the X-ray PDS of black hole candidates in their low states, but with the low-frequency break at a lower frequency. X-ray Nova Muscae 1991 shows much larger amplitude flares than A0620–00 and if a break is present it is at a lower frequency. XN Vel 1993 shows very little flaring and is, like A0620–00, dominated by the ellipsoidal modulation. We discuss the possible origins for the flares. They are clearly associated with the accretion flow rather than an active companion, but whether they originate in the outer disc, or are driven by events in the inner region is not yet resolved. The similarities of the PDS to those of low/hard state sources would support the latter interpretation, and the low break frequency is as would be expected if this frequency approximately scales with the size of an inner evaporated region. We also report the discovery of a new variable star only 14 arcsec from XN Mus 1991. This appears to be a W UMa star, with an orbital period of about 6 hrs.
keywords:
accretion, accretion discs – binaries: close – stars: individual: V616 Mon, GU Mus, MM Vel1 Introduction
Soft X-ray transients (SXTs), also referred to as X-ray novae and black hole X-ray transients, are low-mass X-ray binaries in which long periods of quiescence, typically decades, are punctuated by very dramatic X-ray and optical outbursts, often accompanied by radio activity (Tanaka & Shibazaki 1996; Cherepashchuk 2000). In outburst a number of X-ray spectral states are seen, most commonly the high/soft state and the low/hard state. An intermediate and very high state have also been identified. In the high/soft state, X-ray emission is dominated by thermal emission from an accretion disc extending to close to the last stable orbit around a black hole. In the low/hard state, the inner disc is believed to be truncated and emission appears to originate from an extended corona. Direct support for this picture is provided by the low/hard state source, XTE J1118+480 (Hynes et al. 2000), in which an inner disc radius of at least 50 RSch, and probably RSch, is required (McClintock et al. 2001; Chaty et al. 2002). A similar scenario is advanced by various advective models for the quiescent state (see Narayan, Garcia & McClintock 2001 and references therein), but with the disc truncated at larger radii, – RSch. Attempts have been made to unify these spectral states within the advective picture (Esin et al. 1997), and Esin et al. (2001) did achieve some success in fitting the broad band spectrum of the low/hard state source XTE J1118+480 with an advective model.
The states of SXTs are classified by their X-ray timing properties as well as by their spectra. With the exception of the quiescent state, these have been well studied (e.g. van der Klis 1995; Wijnands & van der Klis 1999). The high/soft state shows a low level of red noise, with no detected low frequency break. The low/hard state and very high state exhibit a higher level of band-limited noise, with a low-frequency break at 0.02–30 Hz, and sometimes superposed QPOs. Band-limited noise also appears to be seen in the Seyfert 1 galaxy NGC 3516 (Edelson & Nandra 1999), but with a much lower cutoff, Hz. This suggests an approximate scaling with black hole mass, and presumably with the scale of the accretion region. The AGN data do not extend to low enough frequencies to be confident that the break is analogous to the low frequency break in the low/hard state, however; it could actually correspond to a higher frequency turnover (Uttley 2002, priv. comm.).
Similar properties might be expected for quiescent SXTs, as the structure of the flow is believed to be similar to that in the low/hard state. Observations of quiescent state variability are much more difficult, however. Sub-orbital variability is known to be present at X-ray energies in the brightest source, V404 Cyg (Wagner et al. 1994; Kong et al. 2002), but even this is faint; only photons s-1 are detected with Chandra. Variability can be more effectively studied in the optical where reasonable count rates are possible, and several photometric (Haswell et al. 1992; Pavlenko et al. 1996; Zurita, Casares & Shahbaz 2002a) and spectrophotometric (Hynes et al. 2002) studies have been performed. The origin of the variability remains uncertain, however, with plausible possibilities including direct optical emission from an advective region, reprocessed X-ray variability, magnetic reconnection events in the disc, and flickering from the accretion stream impact point. It may be that a combination of these factors are important on different timescales, and that not all objects are dominated by the same source of variability. It is therefore important to perform a comparative study of the class as a whole to determine if there is just one type of variability or two or more with distinct characteristics. By doing this we can hope to isolate the contribution, if any, from variations in the inner flow and hence probe its nature.
Even in the optical, count rates from existing data are quite low, limiting the time-resolution achieved, and severely compromising data quality for fainter objects. As we are studying aperiodic variability, the only good solution to this problem is to increase the count rate with a larger aperture telescope. Consequently we have embarked upon a survey of fast variability with the Acquisition Camera on Gemini-South. Our main goals are to explore the bright targets on faster timescales than previously possible, and to study variability effectively even in faint objects. We present here high time resolution data on the bright prototypical SXT, A0620–00 (=V616 Mon), together with lower resolution lightcurves of the fainter objects X-ray Nova Muscae 1991 (GU Mus), and X-ray Nova Velorum 1993 (MM Vel).
2 Observations
Photometric observations of the three quiescent SXTs were obtained in service mode with the Acquisition Camera (AcqCam) on Gemini-South on 2001 December 15 and 2002 January 11 and 15. A filter was used with exposures between 6 and 60 s. The minimum dead-time was primarily dictated by the CCD readout time, 1.7 s, but a variable additional delay was involved in data transfer. The typical actual dead time between exposures was about 2.2 s. Full details are given in Table 1. Routine bias and dark subtraction and flat-fielding corrections were applied to all the data before distribution and appear satisfactory.
| Object | Date | UT range | Exposures | Airmass | Seeing | |
|---|---|---|---|---|---|---|
| A0620–00 | 2001 Dec 15 | 02:26–06:30 | s | 1.2–1.7 | 0.6–1.0 | 18.1 |
| XN Mus 1991 | 2002 Jan 11 | 04:32–08:35 | s | 1.3–1.6 | 0.5–1.1 | 20.3 |
| XN Vel 1993 | 2002 Jan 15 | 04:23–08:15 | s | 1.0–1.3 | 0.5–0.7 | 21.7 |
A0620–00 and XN Mus 1991 were relatively bright compared to the background and are not crowded (no significant contaminating stars closer than 5 arcsec.) These were therefore straightforward to analyse. Lightcurves of each object and several comparison stars were extracted using aperture photometry. For A0620–00, a weighted mean of the magnitudes of two nearby brighter comparisons was used for differential photometry; for XN Mus 1991 four brighter comparisons were used. In each case, two fainter nearby non-variable comparisons of the same brightness as the target were used to check the photometric accuracy. The photometric apertures (0.7 arcsec for A0620–00, and 0.6 arcsec for XN Mus 1991) were chosen to minimise the variance in the lightcurve of one of the faint comparison stars. From these comparisons we estimate 1 accuracies of 0.8 percent per exposure for the flux lightcurve of A0620–00 and 1.7 percent for XN Mus 1991.
XN Vel 1993 was more problematic as it lies close to a brighter star. Fortunately, the seeing was good; 0.5–0.7 arcsec FWHM for most of the run with a few images at the beginning with FWHM up to 0.9 arcsec. An additional complication was that the immediate field of XN Vel 1993 was located close to the seam between the two halves of the detector. To minimise the effect of this on sky estimates, we interpolated over the gap. XN Vel 1993 itself was not affected and we did not use any stars that were on the seam either as PSF or comparison stars. Photometry of XN Vel 1993 and a number of comparison stars was obtained by PSF fitting using the iraf111IRAF is distributed by the National Optical Astronomy Observatories, which are operated by the Association of Universities for Research in Astronomy, Inc., under cooperative agreement with the National Science Foundation. implementation of daophot. PSF fitting with AcqCam data is difficult, as the camera optics yield a position dependant PSF. This can largely be dealt with by choosing many PSF stars surrounding the objects of interest and modelling position dependence. We restricted the analysis to the immediate region of XN Vel 1993, with 7 suitable PSF stars, and allowed only linear variations (with respect to and ) in the PSF; there were too few PSF stars to use a higher order model. This process did leave small residuals in the core of the PSF of the brighter stars, but the wings are well subtracted. Fortunately, in most of our images, XN Vel 1993 is sufficiently resolved from the brighter star that the latter should not be a significant problem. For the images at the beginning of the run, however, the poorer seeing caused problems and these images were excluded from the extracted lightcurve. Excluding these points, the extracted lightcurves were insensitive to whether a variable PSF was used or not, and to the adopted fitting radius. Consequently we believe that the lightcurve of XN Vel 1993 is not significantly contaminated by difficulties in the fitting. Differential photometry was performed with respect to six nearby comparison stars, all brighter than XN Vel 1993 and relatively isolated. Another comparison star of similar brightness to XN Vel 1993 was extracted. Both the formal errors and the scatter in the comparison lightcurve give a 1 uncertainty of 0.9 percent for this star. Since XN Vel 1993 is blended, it is subject to larger errors; the formal error estimate is 1.1 percent.
For all three objects, an approximate photometric calibration was applied with respect to several standard fields observed at low airmass on the same night. Colour terms were neglected as the targets were observed in a single band only.
3 Lightcurves
3.1 A0620–00

The lightcurve of A0620–00 is shown in Fig. 1. It is clearly dominated by the ellipsoidal modulation due to the distortion of the companion star (c.f. McClintock & Remillard 1986). Since this is not associated with accretion variability we should remove this to isolate the flares. We do this in a comparable way to Zurita et al. (2002a), by approximating it with two sine waves at the orbital frequency and its first harmonic. Most of the modulation is at the first harmonic but the fundamental provides for a variation in the minima and/or maxima. For an ideal pure ellipsoidal modulation the maxima are equal, but the minima differ. In practise, lightcurves of quiescent SXTs in general, and A0620–00 in particular, often exhibit unequal maxima as well (e.g. Haswell 1996; Leibowitz, Hemar & Orio 1998). This may be due to distortion of the orbital lightcurve by light from the stream impact point, starspots, and/or persistent superhumps; the latter definitely appear to be seen in one source, XTE J1118+480, albeit in the last stages of outburst decline rather than true quiescence (Zurita et al. 2002b). We consider both cases; for the pure ellipsoidal lightcurve we fix the relative phases of the sine waves to produce equal maxima. We also allow the phases to vary independently. We fit using an iterative rejection scheme to approximately fit the lower envelope of the lightcurve, by rejecting points more than 2 above the fit, then refitting. This is repeated until no new points are rejected. We show the results of the fitting in Fig. 1. Allowing the maxima to differ does improve the fit somewhat, but the difference is not dramatic.
Superposed on the ellipsoidal modulation are many rapid flares; the strongest are shown in Fig. 2. Similar flares in A0620–00 have been reported by Haswell (1992) and Zurita et al. (2002a). We sample events of shorter duration, however; both of the previous studies had a time-resolution of 30–40 s, which would barely have resolved our shortest events. For the most prominent and distinct flares shown in Fig. 2, we have estimated some characteristics of each flare; the peak amplitude, equivalent duration (c.f. Zurita et al. 2002a), and rise and decay e-folding timescales, based on an exponential fit. These are not a representative sample, as they are selected to be the most extreme, best defined events. It can be seen that these flares lie at the extreme-low end of the distribution of equivalent durations presented by Zurita et al. (2002a). E-folding timescales are typically 30–80 s, although one event (flare 5) rises much more rapidly than this. There is no consistent asymmetry to the flares, although individual events may be asymmetric; again the most extreme behaviour is shown by flare 5. We have also characterised the activity level of the lightcurve using similar nomenclature to Zurita et al. (2002a) in Table 3.
| Flare | Peak | Equivalent | Rise | Decay |
|---|---|---|---|---|
| No. | duration (s) | time (s) | time (s) | |
| 1 | 0.05 | 2.8 | 30 | 76 |
| 2 | 0.10 | 9.5 | 29 | 69 |
| 3 | 0.05 | 4.0 | 80 | 39 |
| 4 | 0.06 | 6.2 | 7 | 81 |
| 5 | 0.12 | 7.7 | 34 | 32 |
| Object | ||||||
|---|---|---|---|---|---|---|
| A0620–00 | (H), (H) | 0.009 | 0.015 | 0.12 | 0.07 | |
| XN Mus 1991 | (5000 Å), (6400 Å) | 0.23 | 0.14 | 0.56 | 0.47 | |
| XN Vel 1993 | (6300 Å) | 0.024 | 0.023 | 0.04 | 0.04 |

3.2 X-ray Nova Mus 1991
The lightcurve of XN Mus 1991 is shown in Fig. 3. Large amplitude aperiodic variability is dominant, to the extent that any contribution from an ellipsoidal variation is not obvious in these data, and cannot be fitted. Ellipsoidal modulations have previously been reported with a full amplitude in of 0.2–0.35 mag (Remillard, McClintock & Bailyn 1992; Orosz et al. 1996). Their apparent absence is probably due to a combination of large flare amplitude, small ellipsoidal amplitude and relatively long orbital period. We show in Fig. 3 the expected modulation, assuming the ephemeris of Shahbaz et al. (1997) and a full amplitude of 0.27 mag. It clearly is not consistent with the data. However, there may be an error in extrapolating the ephemerides over several years, as appeared to be the case for A0620–00; using the formal error estimate of Shahbaz et al. (1997) this corresponds to an uncertainty of 0.06 in phase at our epoch. Fig. 3 also shows the effect of including a phase offset of 0.12 (i.e. 2 ), which is not unreasonable; the agreement with the lower envelope of the data is now acceptable, and with this allowed for our data are consistent with an ellipsoidal amplitude comparable to that previously reported. There are too few points defining the lower envelope to reliably fit a model with both the phase and amplitude variable, however, so we neglect the relatively small ellipsoidal contribution in subsequent sections unless explicitly noted. Since the flaring in XN Mus 1991 is of such large amplitude, relative to the ellipsoidal contribution, this should not introduce a large error.
Since the time-resolution was much less than for A0620–00, we cannot study rise and decay timescales of flares so readily although relatively fast timescales are clearly present. For example the large and extended flare at the end of the observation represents a net increase of about 40 percent, with an e-folding time of s. As for A0620–00, the activity level of the lightcurve is characterised in Table 3 to allow comparison with the results of Zurita et al. (2002a).
3.3 X-ray Nova Vel 1993
The lightcurve of XN Vel 1993 is shown in Fig. 4 phased on the new ephemeris of Gelino (priv. comm.). This is dominated by an apparent ellipsoidal modulation (c.f. Shahbaz et al. 1996). Superposed on the ellipsoidal modulation do appear to be some flares. The flare amplitude is much less than in XN Mus 1991, but is comparable to that seen in A0620–00. Parameters of the detrended variability are summarised in Table 3.

4 Power density spectra
4.1 A0620–00
To quantify the range of timescales present, we calculate a power density spectrum (PDS), after removing the fitted ellipsoidal modulation from the lightcurve. Since the sampling was not perfectly uniform we calculate a Lomb-Scargle periodogram (see Press et al. 1992 and references therein) and normalise it in the same way as is common for Fourier transform PDS. Following the suggestion of Papadakis & Lawrence (1993), we bin and fit the PDS in logarithmic space, i.e. each bin is evaluated as rather than and we then fit to the values of . Errors on the binned logarithmic power are estimated from the standard deviation of points within the bin. White noise has been estimated and subtracted by fitting the highest frequencies with a white noise plus red noise model, but the white noise was not large, since the photometric precision was good.
The derived PDS is shown in Fig. 5. At higher frequencies we see a well defined power-law. Below 1 mHz (i.e. (20 min)-1), this appears to flatten. The overall broken power-law form is strikingly similar to the X-ray PDS of SXTs in the low/hard state, as will be discussed in Section 6.4. To characterise it numerically, we fitted it with a model which has a red noise power-law above a break frequency and is flat below that. We derive a power-law slope of , similar to low/hard state SXTs and a break frequency at Hz.

There are a number of potential pitfalls with this analysis. In detrending the ellipsoidal modulation we may have removed low frequency accretion variability as well and hence flattened the PDS artificially. Also, with only 4 hrs of data the shape of the low-frequency PDS will be subject to fluctuations due to the individual realisations of the spectrum. Finally there may be some aliasing problems at high frequencies due to the deadtime between exposures and the non-uniformity of the sampling. To attempt to quantify these uncertainties we create simulated lightcurves with exactly the same sampling and integration times as the real data. We begin with a modelled ellipsoidal lightcurve, to ensure that the double-sine approximation used does not provide an exact match and that any systematic error introduced by the inadequacy of this model is reproduced by the simulation. This was calculated assuming M⊙, , , RL1. These are arbitrary choices and are only intended to produce a representative simulated lightcurve; this model was not used to detrend the data. With these parameters a reasonable agreement was obtained with the observations, however. To this was added a model noise lightcurve, calculated using the method of Timmer & König (1995). Several models for the PDS were tested, broken power-laws with a break close to that observed, Hz, at the edge of the useful coverage, Hz and well outside the range sampled, Hz. In each case the power-law part of the spectrum was matched to the observed slope and normalisation. Lightcurves were created with 1 s time resolution and binned up so that high frequency variability would be aliased correctly. We included lower frequency variations than are well sampled by our observations so that red noise leaks would have an effect. Finally Gaussian white noise was added using the errors derived from photometry; for the comparison star these do represent the scatter in the data accurately so the noise level should be comparable to the real data.
For each model of the PDS we calculate 1000 simulated lightcurves and analyse them in exactly the same way as we did the real data. We create individual PDS with the same logarithmic frequency binning used for the data, and then compare the range of PDS obtained with the observations. We find that if a broken power-law model fitting the observations is input, then the simulated PDS do match the observations (Fig. 6a), i.e. we would not expect such a PDS to be substantially distorted from the input form. If the break is dropped to Hz then the observed range of the PDS corresponds to an unbroken power-law. The output of the simulations preserves this form fairly well, although there is some flattening at low frequencies due to removal of some variability at the orbital frequency and its first harmonic. This flattening is at lower frequencies than the observed break in the PDS of A0620–00, and this model does not agree with the data (Fig. 6b). Only 1 simulation out of 1000 produced sufficient flattening that all bins below Hz have a power density below 0.1 Hz-1 as observed. We also ran simulations with even lower frequency breaks, at Hz, to allow for the possibility of distortion by strong red noise leaks. These also provided a very poor agreement with the observations. We can therefore reject a model in which the intrinsic PDS breaks at or below the edge of the observed range, and conclude that the break in the PDS is probably real.

4.2 X-ray Nova Mus 1991
We calculated a PDS for XN Mus 1991 in exactly the same way as for A0620–00. It is also shown on Fig. 5. The PDS of the raw lightcurve shows no sign of the break seen in A0620–00, instead possessing an unbroken power-law PDS. The slope is very similar to that of A0620–00, however, .
Of course, just as subtracting a fitted ellipsoidal modulation from A0620–00 may distort the PDS if some aperiodic power is removed as well, so also an uncorrected ellipsoidal modulation could distort the PDS of XN Mus 1991, although in the opposite sense. To test for this, we also tried subtracting the representative (not fitted) ellipsoidal modulation shown in Fig. 3 from the lightcurve before calculating the PDS. Since we cannot be confident that this is an accurate model, the resulting PDS may be no more correct that without subtraction, but the differences between them should indicate the sensitivity to the ellipsoidal contribution. We see that a break does emerge, but at a lower frequency than seen in A0620–00. Without being sure of the ellipsoidal contribution we cannot claim that this break is real, but we can say that any break in the PDS of XN Mus 1991 must be at Hz. Removing the ellipsoidal contribution also flattens the PDS somewhat, as it otherwise introduces a red leak across a range of frequencies which steepens the PDS.
4.3 X-ray Nova Vel 1993
We attempted to calculate a PDS for XN Vel 1993, but the combination of low count rate and low variability amplitude meant that it was not well-defined over a useful frequency range. There is little prospect of substantially improving on this, unless XN Vel 1993 were caught in a state showing a higher level of flaring.
5 A serendipitous variable star discovery
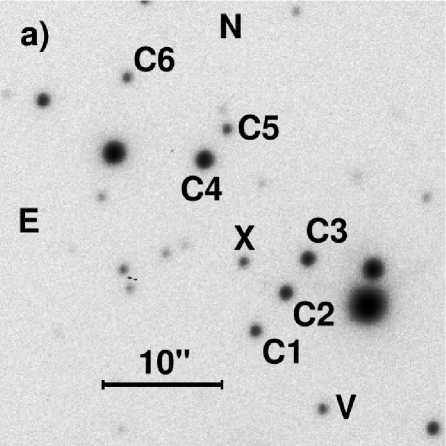
One of the potential comparison stars we examined for XN Mus 1991 was revealed to be itself a variable. This is about 14 arcsec SSW of XN Mus 1991, at RA , Dec (J2000), based on interpolation between 18 surrounding USNO A2.0 stars (Monet et al. 1998). From an approximate photometric calibration we estimate , where the average is obviously over the observed lightcurve, not a whole cycle. It displays a smooth modulation rather than erratic variability, reminiscent of W UMa contact binaries (Fig. 7). From the maximum and minimum which are fully observed, a full amplitude of 0.37 mag is measured. The later incomplete maximum, however, suggests an asymmetric higher peak, and a full amplitude of mag. Of course, if the other minimum is deeper then the full amplitude will be even larger. The period of the modulation is either hrs if single peaked, or hrs if double peaked. The latter seems more likely, given the unequal maxima observed, and is a typical period for a W UMa star (Maceroni & van’t Veer 1996). The asymmetric maxima are quite common to this class of objects (e.g. Davidge & Milone 1984 and references therein) and are often attributed to star spots on these active late type binaries. The difference we see, mag, is comparable to that seen in other systems, and indeed the same difference as in the prototype, W UMa (e.g. Maceroni & van’t Veer 1996). In short, it is most likely that this variable is a W UMa binary, or a related type. A more comprehensive study, based on several cycles of variability, would be needed to draw a more confident conclusion. Such a study would likely be possible with existing images already obtained to study ellipsoidal modulations in XN Mus 1991, as most such images should also include the new variable.

6 Discussion
6.1 What determines the variability amplitude?
Zurita et al. (2002a) compared observed levels of variability with various system parameters. The only correlation they found was with the binary inclination, but as they explain, this is somewhat misleading. This is because it actually arises from a more fundamental correlation with the veiling; the fractional variability correlates with the fractional contribution of disc light to the total. This is a very sensible result, but not trivial, since it indicates that the variability is associated with the disc, as expected, and not with activity on the companion star.
We illustrate the correlation using both our data and that of Zurita et al. (2002a) in Fig. 8. We compare the fractional variability in our detrended lightcurves () with the observed veiling fraction (). For A0620–00 and XN Vel 1993 we use the detrended lightcurves with the relative phasing of the two sinusoids left free, but the difference between this and the fixed phasing model was negligible. For XN Mus 1991, the ellipsoidal modulation is not adequately defined by the data so we do not detrend the lightcurves. Note that points from Zurita at al. (2002a), are typically for a redder bandpass than our band measurements. For the veiling we use observed values based on spectroscopy, interpolating where more than one wavelength is available. The values we use are as collated by Zurita et al. (2002a), together with Orosz et al. (1996) and Casares et al. (1997) for XN Mus 1991, and Filippenko et al. (1999) for XN Vel 1993.

A precise correlation between veiling and fractional variability would obviously depend upon a number of assumptions and violation of these, together with the uncertainty in the measurements, will introduce scatter in the plot. The comparison can only be crude anyway, as the rms variability is not ideal for comparing datasets; it is effectively an integration of the PDS, but the limits of the integration depend on the length of the observation and the time-resolution, and hence will vary from dataset to dataset. The most serious physical assumption is that the veiling source is the same as the flaring source. This might not be the case, for example, if the veiling came from the whole disc, but the flaring only from the inner edge, or the stream-impact point. If the flaring source does differ from the veiling source, it could have a different spectrum, and hence it would be invalid to combine and band observations in the same plot as we have done. There might also be differences in visibility, with, for example, the disc being foreshortened, but emission from an inner spherical flow being closer to isotropic. This would lead to an inclination-dependent scatter. Finally intrinsic variations between sources will introduce further scatter. Consequently, it is not surprising that there is significant scatter. In spite of this, a correlation is visible; certainly for objects where the veiling (i.e. the disc contribution) is small, the variability amplitude is always small as expected.
It is interesting to further extend the comparison beyond optical photometry. Time resolved observations have also been performed in H for V404 Cyg (Hynes et al. 2002). These observations are useful because unlike the optical photometry, they should not show a significant contribution from the companion star; the fractional disc contribution is near unity. We have therefore added the fractional variability from these data to Fig. 8 for comparison. These points do lie relatively close to the line; they certainly continue the sense of the extrapolation. This is not surprising given that Hynes et al. (2002) demonstrated that line and continuum flares in V404 Cyg are correlated. It is possible that all optical variability in quiescent SXTs, continuum and line, has a relatively uniform undiluted fractional variability of 20–30 percent. In fact, the Chandra X-ray observation of V404 Cyg also showed a comparable level of variability (Kong et al. 2002).
XN Vel 1993 does appear to show much less variability than expected from the very large veiling (60–70 percent) estimated by Filippenko et al. (1999). Furthermore, their estimate was done at 6300 Å, and we might expect a higher disc fraction in the band. Such a large value does, however, seem difficult to reconcile with the pronounced ellipsoidal modulation which we observe. It could be that the disc was fainter at the time of our observations than when Filippenko et al. (1999) observed it, and hence that the veiling is less. We should also consider, however, that the veiling estimate for XN Vel 1993 is probably the least certain of those in the sample. It is faint, and the existing spectra were heavily blended with the bright star (more so than for our photometry). The spectral type is not well determined; Filippenko et al. (1999) use an M0 template to estimate the veiling, but note that the spectral type could be as early as K6. The heavy blending may also result in some contamination of the spectrum of XN Vel 1993 by the brighter star, reducing the validity of the veiling determination further. Consequently, we cannot be confident that XN Vel 1993 does show significantly less variability than the trend suggested by the other sources in Fig. 8.
6.2 Lightcurves compared
Since our Gemini observations of A0620–00 and XN Mus 1991 show levels of variability consistent with their veiling, and they have similar orbital periods (7.8 and 10.4 hrs respectively), we might expect that the characteristics of the variability, such as the range of timescales present, should be similar; the only major differences between the observed variability properties should be in the amount of dilution by the non-varying light from the companion star. Some difference is already suggested by the PDS shown in Fig. 5; below 1 mHz, the PDS of A0620–00 appears to flatten, while that of XN Mus 1991 does not. Above 1 mHz, however, the PDS are similar apart from the differing normalisations. The PDS is never the whole story, however, as phase information is not preserved. We therefore should also directly compare the lightcurves. Superficially, at least, these look very different. We must be a little careful, however; in XN Mus 1991, the ellipsoidal modulation is weaker and the flaring much stronger than in A0620–00. The prolonged flares seen in XN Mus 1991 might, if scaled down in amplitude and superposed on a strong ellipsoidal modulation, appear to be undetectable or look like residuals to the fit to the modulation rather than real flares. Equally, the short, sharp flares in A0620–00 would be less striking when observed at lower time resolution. A more realistic comparison is therefore to rebin the A0620–00 lightcurve by a factor of 4 (giving a cycle time of about 32 s, the same as used for XN Mus 1991), and scale the variations seen in XN Mus 1991 down to the same red-noise power and superpose them upon an ellipsoidal modulation.

The results are shown in Fig. 9. After applying this processing to the lightcurve of XN Mus 1991, it does look more similar in character to that of A0620–00. The drop at the beginning of the lightcurve now blends indistinguishably with the synthetic ellipsoidal modulation. The strong, broad feature near the end is still visible, though less dramatic. At higher frequencies, however, one could easily believe that the two lightcurves are of the same source, in the same state. This analysis therefore supports the assertion that some of the very obvious differences between the lightcurves, at least of sources of similar orbital period, do arise from the differing amplitudes of the ellipsoidal and flaring components, which in turn are simply dependent on the viewing geometry. Differences in the low frequency PDS do suggest some real differences in the variability properties, however, and may give rise to some of the vertical scatter in the correlation plot (Fig. 8). This does not necessarily require that the origins of the variability in A0620–00 and XN Mus 1991 differ; both PDS can be accommodated in a broken power-law model, with the break out of the observable range in XN Mus 1991.
6.3 Is the variability the same as that in cataclysmic variables?
Further clues to the origin of the variability may be obtained through a comparison with cataclysmic variables (CVs). We might expect the outer regions of the disc to be rather similar in quiescent SXTs and in quiescent dwarf novae (DNe). Hence if the variability originates from magnetic reconnection in the outer disc, or from the hot spot, the variability properties should be similar. Bruch (1992) has compiled rapid photometry of many CVs. If we select from his sample only quiescent dwarf novae, a range of PDS slopes of to is seen; the best studied case is SS Cyg which spans to . These are systematically steeper than we see, but not by so much as to be conclusive; given only two well determined SXT PDS, we cannot rule out the possibility that these represent the flattest examples drawn from a similar distribution. The variations in quiescent DNe have band full amplitudes of 0.18–1.26 mag. The latter is not directly comparable to the rms we measure, but for a Gaussian distribution of magnitudes would correspond to rms variations of 6–50 percent; this is a crude comparison, but at least enough to see that the amplitudes observed are similar to those in SXTs (Fig. 8). In DNe, as in quiescent SXTs, a range of amplitudes is expected due to dilution of the variability by non-varying light, although unlike the SXT case, this usually comes from the white dwarf, not from the companion star. Unfortunately, existing observations of quiescent DNe such as those of Bruch (1992) do not adequately sample low-frequencies to test for a break in the PDS, although a break has been seen in the VY Scl type CV, KR Aur during a high state (Kato, Ishioka & Uemura 2002). Thus the PDS of quiescent DNe and SXTs appear broadly similar, although DNe may exhibit a somewhat steeper slope. This comparison is, however, inconclusive without a larger sample of well determined PDS from both classes of objects.
6.4 The significance of band-limited noise
The presence of band-limited noise in A0620–00, if not an artifact, is intriguing. This form of noise is also seen in low/hard state SXTs (see Wijnands & van der Klis 1999 and references therein). This is illustrated in Fig. 10 by comparison with the X-ray PDS of the low/hard state SXT XTE J1118+480 (Hynes et al. in preparation). The similarity of the PDS suggests that the optical variability could have a similar origin and might be associated with the central X-ray source, although we cannot say whether it represents direct emission from an advective flow (e.g. self-absorbed synchrotron as predicted by Narayan et al. 1996) or results from heating of the outer disc. Like the quiescent state, the low/hard state is often interpreted as involving a truncated accretion disc with an evaporated central region. An advective model has been successfully applied to XTE J1118+480 (Esin et al. 2001), and with spectral coverage into the EUV it was clear in this case that the disc must be truncated (Hynes et al. 2000; McClintock et al. 2001). The most thorough analysis of this dataset indicates an inner disc radius of RSch (Chaty et al. 2002), significantly less than the – RSch usually invoked for the quiescent state (e.g. Narayan, Barret & McClintock 1997).

There are differences in the two PDS shown in Fig. 10. The normalisation is clearly lower in the case of A0620–00, as a fraction of the mean flux, but this is easily understood as its optical light includes a considerable contribution both from the companion star and other parts of the accretion flow which exhibit only very low frequency variability. There does not appear to be an analogue of the QPO seen in XTE J1118+480, but this is not always present in the low/hard state, either. The most significant difference appears to be in the break frequency, which is much lower in A0620–00 than in XTE J1118+480. The origin of the break is not known, but it is plausible to expect that it approximately scales with the size of the inner region. A low break frequency in quiescence would then be expected, since the advective region is expected to be larger. This trend is supported by the much lower break frequency of Hz seen in the AGN NGC 3516 (Edelson & Nandra 1999). The simplest expectation would be that the break frequency will scale linearly with the inner disc radius, but this may not actually be the case; it will probably vary with some characteristic length scale, which could depend on the mass transfer rate or other parameters, as well as the inner disc radius. Consequently there may be additional factors of order unity. If we assume that the relationship is linear, and that the black hole masses in A0620–00 and XTE J1118+480 are similar, then the ratio of break frequencies implies an inner disc radius in A0620–00 of RSch. For comparison, advective models of quiescent SXTs, and specifically of A0620–00, assume an inner radius of – RSch (Narayan et al. 1997). Our estimate is obviously very crude, and could be off by a factor of a few, so the agreement with theoretical assumptions is reasonable.
The absence of a break in XN Mus 1991, or its lower frequency, however, challenges this interpretation. If no break is seen to a factor of three lower in frequency then one would naively expect an inner disc radius three times larger, RSch. This seems large, at least for a relatively short period system such as XN Mus 1991. Consequently, if this interpretation of the break is correct, it seems likely that the break frequency does not scale linearly with radius, and that other factors do come into play. The absence of a clear break in XN Mus 1991 would make sense if the transition radius in A0620–00 was unusually small at the time of observations. Indeed, the absence of a similar break in the PDS of Zurita et al. (2002a) requires some variation in the PDS. These considerations obviously reduce the potential value of the break frequency for measuring the transition radius, at least until the mechanism by which it arises is understood.
One mechanism proposed for explaining the flaring in low/hard state systems involves a cellular automaton model for an accretion disc (or advective flow) in a self-organised critical state (Mineshige, Ouchi & Nishimori 1994a; Mineshige, Takeuchi & Nishimori 1994b). It is assumed that material is injected into a region subject to an instability if the density rises above a critical value; when this occurs an avalanche is triggered and the energy release is manifest as a flare. This model can reproduce a band-limited noise PDS. The break frequency is related to the size of the unstable part of the disc, which has subsequently been identified with an advective region (Takeuchi & Mineshige 1997). Assuming a 10 Modot black hole, a break frequency of Hz implies the size of the region is Rsch (Mineshige et al. 1994a), comparable to that obtained by scaling relative to XTE J1118+480. This radius also depends on the temperature and viscosity of the region, so is quite uncertain. Other aspects of the flare behaviour are consistent with such a model, such as the distribution of flare amplitudes and durations (Zurita et al. 2002a) and the roughly symmetric flare profiles (Section 3.1) as modelled by Manmoto et al. (1996).
7 Conclusions
We have studied short-timescale flaring in three quiescent SXTs. This flaring is detected in all three sources, at low amplitudes in A0620–00 and XN Vel 1993, and at a much higher level in XN Mus 1991. With the large aperture of Gemini it is possible to observe at higher time resolution than in previous studies. We find that the variability extends to the shortest timescales observable, with pronounced changes sometimes seen in 30 s or less. This is also indicated by the extension of the red noise component in the PDS to 0.05 Hz or even higher.
A comparison of our observations with those of Zurita et al. (2002a) supports their conclusion that the flares are associated with the accretion flow rather than with the companion star. This is clearly shown by a correlation between the variability amplitude and the fractional disc contribution to the spectrum. The amplitude of H variations in V404 Cyg is also consistent with the correlation, and it is likely that the line and continuum variations have a related origin.
Compared to quiescent DNe, i.e. the nearest comparable systems not containing a black hole or neutron star, our sources show similar levels of variability, but perhaps with a somewhat flatter PDS. A rigorous comparison will, however, require a larger sample of objects and more intensive observations.
In A0620–00, we detect a low-frequency break in the PDS at Hz. The PDS overall looks very similar to those of low/hard state SXTs. If the break frequency scales linearly with the size of an inner evaporated region, then a comparison with XTE J1118+480 suggests that this region has size RSch in A0620–00 in quiescence, although there are likely to be other factors involved and this is an extremely crude estimate. No such break is confidently detected in XN Mus 1991; if present it must be at Hz. It may be that the break frequency varies from source to source and epoch to epoch, possibly in response to changes in the inner truncation radius of the outer disc. Again, more intensive observations are needed to explore this behaviour.
Acknowledgements
RIH would like to thank Phil Uttley for enlightening discussions on power spectral analysis and the perils of red noise leaks, and Tom Marsh for pointing out the similarity of the lightcurve of the new variable to W UMa stars. Thanks also to Wei Cui for extracting the lightcurve of XTE J1118+480 used in Fig. 10, and to the co-authors of Hynes et al. (in preparation) for permission to include this in advance of publication. This work is based on observations obtained at the Gemini Observatory, which is operated by the Association of Universities for Research in Astronomy, Inc., under a cooperative agreement with the NSF on behalf of the Gemini partnership: the National Science Foundation (United States), the Particle Physics and Astronomy Research Council (United Kingdom), the National Research Council (Canada), CONICYT (Chile), the Australian Research Council (Australia), CNPq (Brazil) and CONICET (Argentina). We would like to thank Claudia Winge for implementing the observations, performing the pipeline reductions, and advice on the data analysis. RIH, PAC, and CAH acknowledge support from grant F/00-180/A from the Leverhulme Trust. RIH is currently supported by NASA through Hubble Fellowship grant #HF-01150.01-A awarded by the Space Telescope Science Institute, which is operated by the Association of Universities for Research in Astronomy, Inc., for NASA, under contract NAS 5-26555.
References
- [1] Bruch A., 1992, A&A, 266, 237
- [2] Casares J., Martin E. L., Charles P. A., Molaro P., Rebolo R., 1997, New Astronomy, 1, 299
- [3] Chaty S., Haswell C. A., Malzac J., Hynes R. I., Shrader C. R., Cui W., 2002, MNRAS, submitted
- [4] Cherepashchuk A. M., 2000, SSR, 93, 473
- [5] Davidge T. J., Milone E. F., 1984, ApJS, 55, 571
- [6] Edelson E., Nandra K., 1999, ApJ, 514, 682
- [7] Esin A. A., McClintock J. E., Narayan R., 1997, ApJ, 489, 865
- [8] Esin A. A., McClintock J. E., Drake J. J., Garcia M. R., Haswell C. A., Hynes R. I., Muno M. P., 2001, ApJ, 555, 483
- [9] Filippenko A. V., Leonard D. C., Matheson T., Li W., Moran E. C., Riess A. G., 1999, PASP, 111, 969
- [10] Haswell C. A., 1992, Ph.D. thesis, Univ. Texas at Austin
- [11] Haswell C. A., 1996, in proc. IAU Symp. 165: Compact Stars in Binaries, Eds. J. van Paradijs, E. P. J. van den Heuvel, E. Kuulkers, Kluwer Academic Publishers, Dordrecht, p351
- [12] Hynes R. I., Mauche C. W., Haswell C. A., Shrader C. R., Cui W., Chaty S., 2000, ApJ, 359, L37
- [13] Hynes R. I., Zurita C., Haswell C. A., Casares J., Charles P. A., Pavlenko E. P., Shugarov S. Yu., Lott D. A., 2002, MNRAS, 330, 1009
- [14] Kato T., Ishioka R., Uemura M., 2002, PASJ, in press, astro-ph/0209351
- [15] Kong A. K. H., McClintock J. E., Garcia M. R., Murray S. S., Barret D., 2002, ApJ, 570, 277
- [16] Leibowitz E. M., Hemar S., Orio M., 1998, MNRAS, 300, 463
- [17] McClintock J. E., Remillard R. A., 1986, ApJ, 308, 110
- [18] McClintock J. E. et al., 2001, ApJ, 555, 477
- [19] Maceroni C., van’t Veer F., 1996, A&A, 311, 523
- [20] Manmoto T., Takeuchi M., Mineshige S., Matsumoto R., Negoro H., 1996, ApJ, 464, L135
- [21] Mineshige S., Ouchi N. B., Nishimori H., 1994, PASJ, 46, 97
- [22] Mineshige S., Takeuchi M., Nishimori H., 1994, ApJ, 435, L125
- [23] Monet D., 1998, The USNO-A2.0 Catalogue, U.S. Naval Observatory, Washington DC
- [24] Narayan R., Barret D., McClintock J. E., 1997, ApJ, 482, 448
- [25] Narayan R., Garcia M. R., McClintock J. E., 2001, in proc. IX Marcel Grossmann Meeting, eds. V. Gurzadyan, R. Jantzen, R. Ruffini, World Scientific (Singapore), astro-ph/0107387
- [26] Narayan R., McClintock J. E., Yi I., 1996, ApJ, 457, 821
- [27] Orosz J. A., Bailyn C. D., McClintock J. E., Remillard R. A., 1996, ApJ, 468, 380
- [28] Papadakis I. E., Lawrence A., 1993, MNRAS, 261, 612
- [Pavlenko et al. 1996] Pavlenko E. P., Martin A. C., Casares J., Charles P. A., Ketsaris N. A., 1996, MNRAS, 281, 1094
- [29] Press W. H., Teukolsky S. A., Vetterling W. T., Flannery B. P., 1992, Numerical Recipes in C, 2nd Edn., CUP, Cambridge
- [30] Remillard R. A., McClintock J. E., Bailyn C. D., 1992, ApJ, 399, L145
- [31] Shahbaz T., van der Hooft F., Charles P. A., Casares J., van Paradijs J., 1996, MNRAS, 282, L47
- [32] Shahbaz T., Naylor T., Charles P. A., 1997, MNRAS, 285, 607
- [33] Takeuchi M., Mineshige S., 1997, ApJ, 486, 160
- [Tanaka & Shibazaki(1996)] Tanaka, Y., Shibazaki, N., 1996, ARA&A, 34, 607
- [34] Timmer J., König M., 1995, A&A, 300, 707
- [35] van der Klis M., 1995, in X-ray Binaries, eds. W. H. G. Lewin, J. van Paradijs, E. P. J. van den Heuvel, CUP, p. 252
- [Wagner et al. 1994] Wagner R. M., Starrfield S. G., Hjellming R. M., Howell S. B., Kreidl T. J., 1994, ApJ, 429, L25
- [36] Wijnands R., van der Klis M., 1999, ApJ, 514, 939
- [37] Zurita C., Casares J., Shahbaz T., 2002a, ApJ, in press
- [38] Zurita C., et al. 2002b, MNRAS, 333, 791