The discovery of a new non-thermal X-ray filament near the Galactic Centre
Abstract
We report the discovery by XMM-Newton and Chandra of a hard extended X-ray source (XMM J1745402904.5) associated with a compact non-thermal radio filament (the Sgr A-E ‘wisp’=1LC 359.8880.086=G359.880.07), which is located within arcmin of the Galactic Centre. The source position is also coincident with the peak of the molecular cloud, M 0.130.08 (the ‘20 km s-1’ cloud). The X-ray spectrum is non-thermal with an energy index of 1.0 and column density of H cm-2. The observed 2–10 keV flux of 4erg s-1 cm-2 converts to an unabsorbed X-ray luminosity of 1erg s-1 assuming a distance of 8.0 kpc. The high column density strongly suggests that this source is located in or behind the Galactic Centre Region. Taking account of the broad-band spectrum, as well as the source morphology and the positional coincidence with a molecular cloud, we concluded that both the radio and X-ray emission are the result of synchrotron radiation. This is the first time a filamentary structure in the Galactic Centre Region has been shown, unequivocally, to have a non-thermal X-ray spectrum.
keywords:
Galaxy: centre – X-rays:ISM – X-rays:individual:XMM J1745402904.51 Introduction
The inner pc of our galaxy is a unique region. The compact radio source Sgr, which is spatially coincident with the dynamical centre of the Galaxy, marks the presence at the Galactic nucleus of a 3 solar mass, black-hole (Genzel et al. 2000; Ghez et al. 2000; Eckart et al. 2002). The bolometric luminosity of this super-massive object is extraordinarily low at the present time, although low-level X-ray flaring activity has been observed in X-rays on at least two recent occasions (Baganoff et al. 2001; Goldwurm et al. 2002). The Galactic Centre Region as a whole embodies a dense mix of molecular clouds, star clusters, H ii regions, supernova remnants, hot plasma, energetic particles and magnetic fields (e.g. see the review by Mezger, Duschl, & Zylka 1996). Arguably the most striking large-scale structures are the non-thermal filaments (hereafter NTF) seen in radio observations, some of which extend over scales of tens of parsecs, run largely perpendicular to the Galactic plane and, presumably, trace regions of either enhanced magnetic field and/or a local source of relativistic particles (e.g. Morris 1994; Mezger et al. 1996; Lang, Morris, & Echevarria 1999). At the other end of the electromagnetic spectrum, the most obvious feature of X-ray images (Sakano et al. 2002; Wang, Gotthelf & Lang 2002; Warwick 2002), in addition to a population of luminous () X-ray binaries, is a wide-spread distribution of hot ( keV), largely thermal plasma.
Here we combine recent X-ray observations of the Galactic Centre Region by XMM-Newton and Chandra with published radio data to identify a hard X-ray source coincident with a non-thermal radio filament. In general the very large scale NTFs seen in the radio band do not have obvious X-ray counterparts. However, there is evidence of X-ray emission in at least one compact NTF identified in radio observations (Wang et al. 2002; Wang 2002). Arguably, the present discovery provides the clearest example of an X-ray bright, compact NTF.
2 The X-ray Observations
A major survey of the region along the Galactic Plane within of the Galactic Centre is in progress with XMM-Newton. The full programme consists of a set of 10 overlapping pointings (plus one or two additional observations targeted at specific Galactic Centre sources). A preliminary, mosaiced image of the whole survey region after correction for the instrument background and exposure variations, including telescope vignetting, has been presented in Warwick (2002).
The current paper focuses on one of the observations from the XMM-Newton Galactic Centre programme targeted at the Sgr A complex. This observation (designated GC6) was carried out by XMM-Newton on September 4, 2001. Here we concentrate on the measurements made by the XMM-Newton EPIC cameras, which consist of two MOS CCD units (Turner et al. 2001) and one pn CCD (Strüder et al. 2001). For the Galactic Centre programme the EPIC MOS and pn cameras were operated in Full Frame Mode and Extended Full Frame Mode, respectively, with the medium filter selected. The data reduction and filtering were carried out using the Standard Analysis Software (SAS), Version 5.2. Although the instrument background was relatively stable during the GC6 observation, we rejected some time intervals based on the light curve of the full-field data above 10 keV. The resulting effective exposure times for MOS1, MOS2 and pn cameras were 22.4 ks, 24.0 ks, and 17.5 ks, respectively. For the MOS cameras we utilised pixel patterns of 0–12 (single to quadruple), whereas for the pn camera, we accepted only single (pattern 0) events111This conservative approach was adopted because of calibration uncertainties pertaining at the time of the analysis to other pn event types recorded in Extended Full Frame Mode..
We have also employed data from a Chandra observation of this region made on July 8, 2000 with the Advanced CCD Imaging Spectrometer (ACIS-I) in VFAINT Mode. In this case, data reduction and filtering were carried out with the Chandra Interactive Analysis Software (CIAO), Version 2.2. After applying standard filtering criteria, the effective exposure time was 38.7 ks.
3 Results
3.1 X-ray images and the radio counterpart
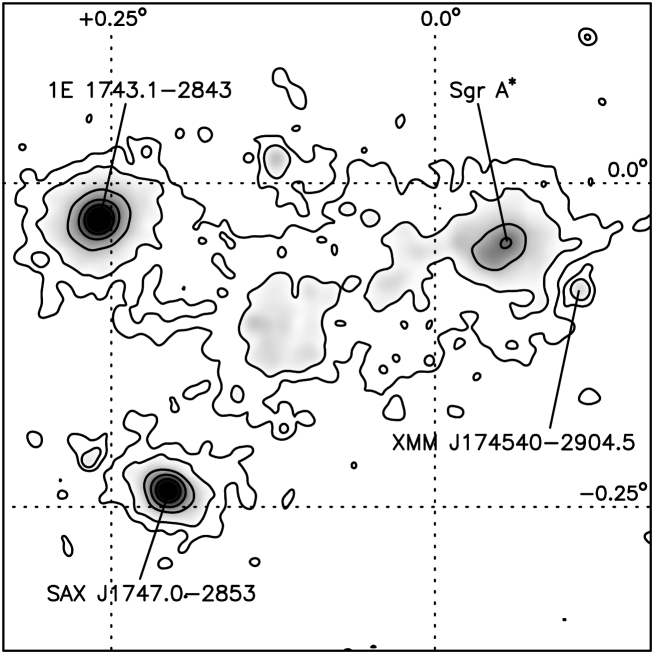
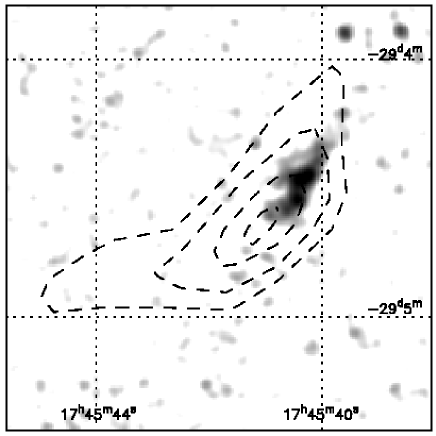
Fig. 1 shows an extract from the XMM-Newton mosaic of the Galactic Centre Region. Our attention was drawn to a discrete source seen in this image 4 arcmin to the south west of Sgr by virtue of its extremely hard X-ray spectrum. The position of this source based on the XMM-Newton data is (17h 45m 404, 29° 045) in J2000 coordinates with an error radius of 6 arcsec, and was accordingly designated as XMM J1745402904.5. The source was found to have an extent slightly greater than the point-spread function (PSF) of the XMM-Newton mirror, implying an angular size greater than arcsec. This was confirmed by reference to the Chandra image (Fig. 2), where the higher spatial resolution clearly delineates an elongated morphology on an angular scale of 15 arcsec. In the case of Chandra the astrometric accuracy of the X-ray data is better than arcsec.
The position of XMM J1745402904.5 coincides with that of an extended non-thermal radio source detected in the 2 and 6 cm wavelengths. Ho et al. (1985) refer to this source as Sgr A-E ‘wisp’ and in Fig. 2 we have overlaid several of the radio contours from the 2 cm continuum radio map shown in Fig. 2 of the Ho et al. paper. Interestingly the X-ray emission originates in a much more compact region than the radio emission and the peak in the X-ray surface brightness is offset from the corresponding feature in the radio image. Nevertheless the association of the radio and X-ray sources looks secure given the close alignment of the X-ray and radio elongation in the region of overlap.
More recently, Lazio & Cordes (1998) have catalogued the radio source as 1LC 359.8880.086 (17h 45m 41131, 29° 04′ 3643, J2000) and noted that at 1281 MHz it has an angular extent of 47 arcsec, whereas the instrumental resolution is 5 arcsec. Lang et al. (1999) confirmed this result with a 20 cm observation and designated it as G359.880.07. This position also corresponds to the peak position of a giant molecular cloud M 0.130.08 (the ‘20 km s-1’ cloud) (Mezger et al. 1986).
Combining the radio measurements at 15 GHz (2 cm), 5 GHz (6 cm) and 1.3 GHz (Ho et al. 1985; Lazio & Cordes 1998), we find all the three data points to be well fitted with a power-law model with the spectral index ().
3.2 X-ray spectra
We extracted source spectra from the XMM-EPIC MOS and pn data using a 16 arcsec radius source cell centred on XMM J1745402904.5. Corresponding background spectra were taken from a concentric annulus with an inner and outer radius of 32 and 48 arcsec respectively. For the Chandra ACIS data, we chose an elliptical source region with major and minor axis diameters of 36 and 15 arcsec and a concentric background region bounded by the source region and an outer dimension twice its size. The background-subtracted spectra were analysed using xspec version 11.1.0. Initially we tried fitting the XMM MOS 1, 2, and pn data simultaneously and also, in a separate exercise, the Chandra data alone. However, the results from the two observatories were quite consistent except for some minor normalisation differences. Therefore we next adopted the approach of simultaneously fitting all four datasets, but allowing the global normalisations for the XMM and Chandra data to be free.
We investigated both power-law continuum and thin-thermal plasma emission models, modified by absorption, and found that the plasma model was not appropriate because the 90 per cent lower-limit of the temperature was very high, i.e. keV. Note that we assume the solar abundance ratios (Anders & Grevesse 1989). Here we apply the wabs model, which is based on the cross section of Morrison & McCammon (1983) and the above-mentioned solar abundances.
Fig. 3 shows the observed spectra together with the best-fitting power-law model and the corresponding confidence contour for column density versus energy index. Table 1 summarises the results from both the separate and combined XMM and Chandra analysis. The best-fitting parameters for the power-law model are an energy index of 1.0 (0.1–2.1), a hydrogen column density of 38 (27–45) H cm-2, and a 2–10 keV observed X-ray flux of 4erg s-1 cm-2. The latter converts to a 2–10 keV unabsorbed luminosity of 1erg s-1 assuming a source distance of 8.0 kpc. We found out that the inclusion of dust scattering does not affect significantly the estimate of the absorption column or flux (This is based on the inclusion in the spectral fitting of the dust model in xspec using parameters estimated from the work of Mitsuda et al. 1990). We also tried a model including a narrow line at 6.4 keV from neutral iron. The line is, however, not detected at a statistically significant level; the derived upper limit of the equivalent width is 280 eV.
Further checks revealed no significant flux or spectral variations during the observation.
| XMM | Chandra | XMM+Chandra | Unit | |
|---|---|---|---|---|
| 33 (20–48) | 37 (24–64) | 38 (27–45) | (H cm-2) | |
| 222Energy index , where . | 0.7 (0.7–2.2) | 0.7 (0.3–3.3) | 1.0 (0.1–2.1) | |
| 3.8 | 4.2 | 4.1/3.6333XMM/Chandra | (erg s-1 cm-2; 2–10 keV) |
Numbers in parentheses are 90% confidence uncertainties for one interesting parameter.


4 Discussion
The spatial coincidence and the similar orientations of the extended morphology (see Section 3.1), provide strong evidence for the association of the X-ray and radio sources. The heavy absorption in the X-ray band further implies that this source is embedded in or beyond the molecular cloud M0.130.08, which Zylka, Mezger & Wink (1990), on the basis of infrared to radio observations, propose is actually located in front of the Galactic Centre (Sgr A∗) by several tens of parsecs. In addition, the relatively weak 6.4-keV line from the source suggests that the surrounding cloud column density is less than 3H cm-2 (for an isotropic cloud; see Inoue 1985), although, of course, the source need not be at the cloud centre and may in fact be behind it. Coil & Ho (2000) argue from their radio observations that the radio ‘wisp’ may be part of a SNR (designated as G 359.920.09) which lies to the side of and behind the M0.130.08 cloud.
The flat X-ray spectrum implies that the emission is non-thermal in origin. Non-thermal X-ray emission has previously been detected from a number of Galactic SNRs, (e.g. Koyama et al. 1995), and is generally interpreted as a synchrotron emission of relativistic electrons with energy of up to 100 TeV (e.g. Reynolds & Keohane 1999). Similarly the acceleration of electrons up to 100 TeV is also observed in pulsar wind nebulae, such as in the Crab nebula (e.g. Aharonian et al. 2000).
The lifetime of synchrotron-emitting electrons is inversely proportional to the square of the magnetic field. The observed magnetic field in the Galactic Centre Region is high, typically 1 mG (e.g. Morris 1994), although it is not known whether this strong magnetic field pervades the whole Galactic Centre Region or is more localized. Specifically in the case of the Sgr A-E ‘wisp’, Ho et al. (1985) estimated based on an equipartition argument that the magnetic field is 0.3 mG. The lifetime of the TeV electrons emitting hard X-rays through synchrotron radiation is then 7 yr. This lifetime is comparable to the observed spatial extent of the filament which is 2 light year in the X-ray band. Since the source was detected at a similar flux level on separate occasions by Chandra and XMM-Newton, spaced by a time interval of 1 yr, we can conclude that there is continuous injection (or re-acceleration) of high-energy electrons.
If we assume a constant injection of electrons with an energy spectrum , starting some time earlier, then the emitted synchrotron spectrum is in the low energy band (e.g. radio) and in the high energy band (e.g. X-ray) (see Longair 1994). In other words the spectral index in the X-ray band should be 0.5 steeper than that measured in the radio band, with a spectral break lying somewhere between the two. The spectral indices measured in the radio () and X-ray () bands are, in fact, quite consistent with this model, although other interpretations are possible due to the relatively large measurement errors. Nevertheless this is further support for the synchrotron hypothesis.
The spatial coincidence of the filament with the peak of a molecular cloud adds support to the conjecture that the source is located in the Galactic Centre Region. This assumes that the presence of the non-thermal emission is in some way related to the high-density conditions within the molecular cloud, even if the mechanism for the acceleration of particles in such an environment is not clear. Presumably the X-ray emission locates the acceleration site whereas the more extended radio source maps the extent to which GeV electrons diffuse through a region of enhanced but (according to the radio polarimetry observations of Ho et al. 1985) somewhat tangled magnetic field.
Ho et al. (1985) suggest that the radio ‘wisp’ (corresponding to XMM J1745402904.5) traces the edge of a possible SNR which is located to the south of and presumably just in front of Sgr A East. More recently, Coil & Ho (2000) have found an intriguing association between the radio 20 cm continuum and NH3 line emission at the location of the ‘wisp’ and argue that the radio ‘wisp’ may coincide with the edge of a SNR. XMM J1745402904.5, accordingly, may be at a shock front in the compressed high-density cloud and the site of the particle acceleration.
There are about 10 (isolated) radio filamentary structures known in the Galactic Centre Region (e.g. Morris 1994; LaRosa, Lazio & Kassim 2001), most of which show extended morphologies aligned perpendicular to the Galactic Plane, as is the case for the present filament. On the other hand, the detection of X-ray emission associated with such radio filaments is still rare. The best previous example of a radio and X-ray correlation is that of NTF G359.54+0.18 (Yusef-Zadeh, Wardle & Parastaran 1997) for which Wang (2002) has reported the detection by Chandra of an X-ray thread about 1 arcmin long but only 1 arcsec wide. Koyama (2001), Yusef-Zadeh et al. (2002), and Bamba et al. (2002) have also reported the detection of a number of other X-ray filaments in Chandra data, although detailed studies have not been possible due to limited count statistics and because corresponding radio filamentary structures have not been identified. This is the first clear detection of the X-ray filament which has a radio counterpart and unequivocally has a non-thermal X-ray spectrum, although it might be a part of a large SNR.
Finally we note that although our preferred interpretation of XMM J1745402904.5 is that it is the X-ray counterpart of a non-thermal filamentary structure in the Galactic Centre Region, there are other possible scenarios for its origin. For example, it could be an extragalactic background object, namely a one-sided jet emanating from a QSO, although the lack of a central point source corresponding to the QSO core somewhat weakens this argument. In this context detailed investigation of the X-ray morphology via deep Chandra imaging and high-resolution mapping in the radio band are the way forward.
Acknowledgments
The authors would like to express their thanks to all those who have contributed to the successful development and operation of XMM-Newton. In addition we should like to acknowledge the help of many colleagues at Leicester, especially R. Griffiths, R. Saxton, S. Sembay, I. Stewart and M. Turner, on matters relating to the EPIC calibration and the use of the SAS. M. S. acknowledges the financial support from the Japan Society for the Promotion of Science (JSPS) for Young Scientists.
References
- [Aharonian et al. 2000] Aharonian F.A. et al. , 2000, ApJ, 539, 317
- [Anders & Grevesse 1989] Anders E. & Grevesse N., 1989, Geochimica et Cosmochimica Acta, 53, 197
- [Baganoff et al. 2001] Baganoff F.K. et al., 2001, Nature, 413, 45
- [Bamba et al. 2002] Bamba A., Murakami H., Senda A., Takagi S., Yokogawa J., Koyama K., 2002, Proc. New Visions of the X-ray Universe in the XMM-Newton and Chandra era., in press (astro-ph/0202010)
- [Coil & Ho 2000] Coil A.L., Ho P.T.P., 2000, ApJ, 533, 245
- [Eckart et al. 2002] Eckart A., Genzel R., Ott T., Schödel R., 2002, MNRAS, 331, 917
- [Genzel et al. 2000] Genzel R., Pichon C., Eckart A., Gerhard O.E., Ott T., 2000, MNRAS, 317, 348
- [Ghez et al. 2000] Ghez A.M., Morris M., Becklin E.E.,Tanner A., Kremenek T., 2000, Nature, 407, 349
- [Goldwurm et al. 2002] Goldwurm A. et al. , ApJ, submitted (astro-ph/0207620)
- [Ho et al. 1985] Ho P.T.P., Jackson J.M., Barrett A.H., Armstrong J.T., 1985, ApJ, 288, 575
- [Inoue 1985] Inoue H., 1985, Space Science Reviews, 40, 317
- [Koyama 2001] Koyama K., 2001, in Inoue H., Kunieda H., ed., ASP Conf. Ser. Vol. 251, New Century of X-ray Astronomy. Astron. Soc. Pac., San Francisco, p.50
- [Koyama et al. 1995] Koyama K., Petre R., Gotthelf E.V., Hwang U., Matsura M., Ozaki M., Holt, S.S., 1995, Nature, 378, 255
- [Lang et al. 1999] Lang C.C., Morris M., Echevarria L., 1999, ApJ, 526, 727
- [Lazio & Cordes 1998] Lazio T.J.W., Cordes J.M., 1998, ApJS, 118, 201
- [Longair 1994] Longair M.S., 1994, High Energy Astrophysics. volume 2. second edition, Cambridge University Press, Cambridge, UK
- [Mezger et al. 1986] Mezger P.G., Chini R., Kreysa E., Gemünd H.-P., 1986, A&A, 160, 324
- [Mezger et al. 1996] Mezger P., Duschl W. J., Zylka R., 1996, A&AR, 7, 289
- [Mitsuda et al. 1990] Mitsuda K., Takeshima T., Kii T., Kawai N., 1990, ApJ, 353, 480
- [Morris 1994] Morris M., 1994, in Genzel R., Harris A.I., ed., The nuclei of Normal Galaxies. Kluwer, Dordrecht, p.185
- [Morrison & McCammon 1983] Morrison R., McCammon D., 1983, ApJ, 270, 119
- [LaRosa et al. 2001] LaRosa T.N., Lazio T.J.W., Kassim N.E., 2001, ApJ, 563, 163
- [Reynolds & Keohane 1999] Reynolds S.P., Keohane, J.W., 1999, ApJ, 525, 368
- [Sakano et al. 2002] Sakano M., Koyama K., Murakami H., Maeda Y., Yamauchi S., 2002, ApJS, 138, 19
- [Strüder et al. 2001] Strüder L. et al., 2001, A&A, 365, L18
- [Turner et al. 2001] Turner, M.J.L. et al., 2001, A&A, 365, L27
- [Wang 2002] Wang Q.D. 2002, Proc. New Visions of the X-ray Universe in the XMM-Newton and Chandra era., in press (astro-ph/0202317)
- [Wang et al. 2002] Wang Q.D., Gotthelf E.V., Lang C.C., 2002, Nature, 415, 148
- [Warwick 2002] Warwick R.S., 2002, Proc. New Visions of the X-ray Universe in the XMM-Newton and Chandra era., in press (astro-ph/0203333)
- [Yusef-Zadeh et al. 1997] Yusef-Zadeh F., Wardle M., Parastaran P., 1997, ApJ, 475, 119
- [Yusef-Zadeh et al. 2002] Yusef-Zadeh F., Law C., Wardle M., Wang Q.D., Fruscione A., Lang C.C., Cotera A., 2002, ApJ, 570, 665
- [Zylka et al. 1990] Zylka R., Mezger P.G., Wink J.E., 1990, A&A, 234, 133