Status of the BAIKAL neutrino project
Abstract
We review the present status of the Baikal Neutrino Project and present results on upward going atmospheric neutrinos, results of a search for high energy extraterrestrial neutrinos as well as preliminary results of searching for acoustic signals from EAS in water. We describe the moderate upgrade of NT-200 planned for the next years and discuss a possible detector on the Gigaton scale.
1 DETECTOR AND SITE
The Baikal Neutrino Telescope is operated in Lake Baikal, Siberia, at a depth of 1.1 km. The present stage of the telescope, NT-200 [1], was put into operation at April 6th, 1998 and consists of 192 optical modules (OMs). An umbrella-like frame carries 8 strings, each with 24 pairwise arranged OMs. Three underwater electrical cables and one optical cable connect the detector with the shore station.
The OMs are grouped in pairs along the strings. They contain 37-cm diameter QUASAR - photo multipliers (PMs) which have been developed specially for our project [2]. The two PMs of a pair are switched in coincidence in order to suppress background from bioluminescence and PM noise. A pair defines a channel.
A muon-trigger is formed by the requirement of hits (with hit referring to a channel) within 500 ns. is typically set to 3 or 4. For such events, amplitude and time of all fired channels are digitized and sent to shore. A separate monopole trigger system searches for clusters of sequential hits in individual channels which are characteristic for the passage of slowly moving, bright objects like GUT monopoles.
Lake Baikal deep water is characterized by an absorption length of (480 nm)=20 24 m, a scattering length of 30 70 m and a strongly anisotropic scattering function with a mean cosine of the scattering angle .
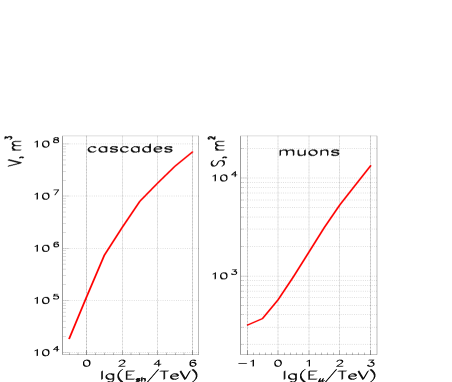
Fig.1 shows the cascade detection volume and the muon detection area of a single BAIKAL OM. Here, we define detection area and detection volume by the condition that the mean number of photoelectrons has to be 1. In contrast to underground detectors, open configurations in highly transparent media like water or ice allow to observe a huge volume beyond their geometrical boundaries. The detection volume of an OM rises from 1105 m3 for 1 TeV to 7107 m3 for 1 EeV cascade energy.
Here we present results on upward going atmospheric neutrinos, a search for high energy extraterrestrial neutrinos, and preliminary results of a search for acoustic signals from EAS in water. Also an upgrade of NT-200 towards the Gigaton scale detector is dicussed.
2 A SEARCH FOR UPWARD GOING ATMOSPHERIC NEUTRINOS
The signature of neutrino induced events is a muon crossing the detector from below. The reconstruction algorithm is based on the assumption that the light radiated by the muons is emitted under the Cherenkov angle with respect to the muon path. We don’t take into account light scattering because the characteristic distances for muons induced by atmospheric neutrinos which trigger the detector do not exceed 12 scattering lengths of light in Baikal water (see above).
The algorithm uses a single muon model to reconstruct events. We apply procedures to reject hits, which are very likely due to dark current or water luminosity as well as hits which are due to showers and have large time delays with respect to expected hit times from the single muon Cherenkov light.
Determination of the muon trajectory is based on the minimization of a function with respect to measured and calculated times of hit channels. As a result of the minimization we obtain the track parameters (, and spatial coordinates).
Since the algorithm yields a large fraction of events which are reconstructed as upward going muons, wrongly reconstructed tracks have been removed by a series of quality cuts [3, 4].
The efficiency of reconstruction and “fake” event rejection and the correctness of the MC background estimation have been tested with a sample of 1.1108 MC-generated events from atmospheric muons (that is twice the whole experimental sample, see below) and with MC-generated events due to atmospheric neutrinos. Muons passage through rock and water has been generated by transport code MUM [5].
For the MC background sample we found 3 surviving events reconstructed as upward going muons and passing the quality cuts. The analysis of these events shows that they are complex and contain one or two muons with showers (shower energy 100 GeV). These events are reconstructed close to horizon (0.3).
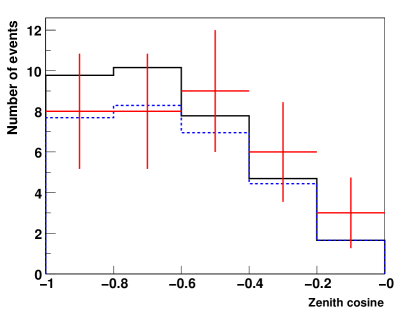
Data taken with NT-200 between April 1998 and February 1999 cover 234 days life time. From the total of 1.67108 triggers (4) recorded in 234 days, 5.3107 events with 6 at 3 strings have been selected for this analysis. These events have been reduced to 34 upward tracks. The MC estimations of the number of expected upward going events due to neutrino induced muons give 34 and 29.4 events in case of absence of neutrino oscillations and including oscillations with maximal mixing angle and 310-3 eV2, respectively. Angular distributions of both experimental and MC samples are presented in Fig.2.
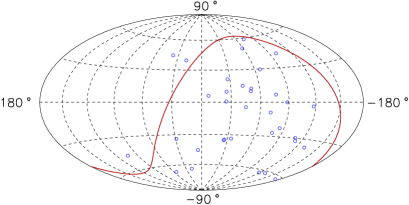
Fig.3 shows the celestial distribution of selected upward going muons with NT-200 in galactic coordinates.
3 A SEARCH FOR EXTRATERRESTRIAL HIGH ENERGY NEUTRINOS
The used search strategy for high energy neutrinos relies on the detection of the Cherenkov light emitted by the electro-magnetic and (or) hadronic particle cascades and high energy muons produced at the neutrino interaction vertex in a large volume around the neutrino telescope [6, 7]. A cut is applied which accepts only time patterns corresponding to upward traveling light signals.
For this analysis we used 1.56105 events with 10.
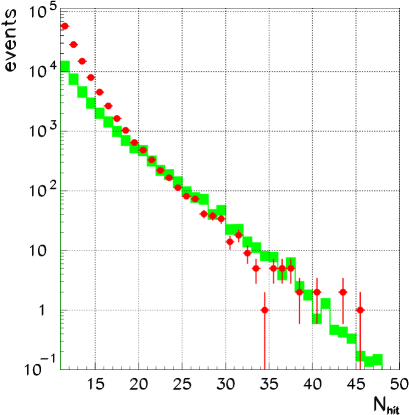
Fig.4 shows the distribution for experiment (dots) as well as the one expected for the background from brems- and hadronic high energy showers produced by atmospheric muons (boxes). The experimental distribution is consistent with the background expectation for 18. The discrepancy at lower values is caused by the contribution of atmospheric muons close to horizon as well as by low energy showers from pair production. These effects have not been included in the present MC sample, but have been taken into account in separate simulations which are consistent with experimental data. No statistically significant excess over background expectation from atmospheric muon induced showers has been observed. Since no events with 45 are found in our data, we can derive upper limits on the flux of high energy neutrinos which would produce events with 50.
The detection volume for neutrino produced events with 50 which fulfill all trigger conditions was calculated as a function of neutrino energy and zenith angle . rises from 2105 m3 for 10 TeV up to 6106 m3 for TeV and significantly exceeds the geometrical volume 105 m3 of NT-200.
Given an behaviour of the neutrino spectrum and a flavor ratio , the combined 90% C.L. upper limit obtained with the Baikal neutrino telescopes NT-200 (234 days) and NT-96 [7] (70 days) is:
| (1) |
where the upper value allows for the highest light scattering observed over many seasons.
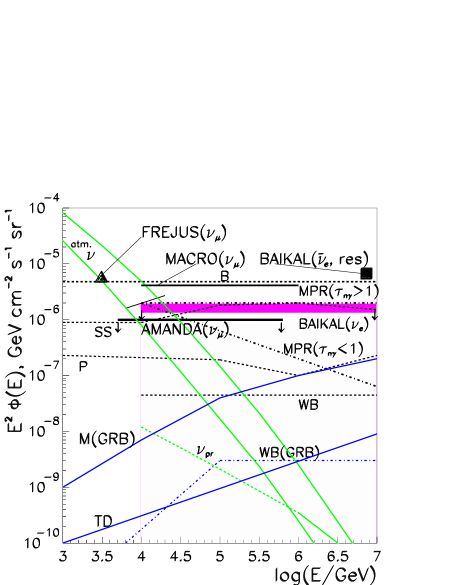
Fig.5 shows the upper limits on the isotropic diffuse neutrino flux obtained by BAIKAL (this work), AMANDA [8], MACRO [9] and FREJUS [10] (triangle) as well as the atmospheric conventional neutrino fluxes [11] from horizontal and vertical directions (upper and lower curves, respectively) and the atmospheric prompt neutrino flux [12] (curve labeled ). Also shown is the model-independent upper limit on the diffuse high energy neutrino flux obtained by Berezinsky [13] (curve labeled ’B’), and predictions for diffuse neutrino fluxes from Stecker and Salamon [14] (’SS’) and Protheroe [15] (’P’). Curves labeled ’MPR’ and ’WB’ show the upper bounds obtained by Mannheim et al. [16] as well as the upper bound obtained by Waxman and Bahcall [17], respectively. Curves labeled ’M(GRB)’ and ’WB(GRB)’ present the upper bounds for diffuse neutrino flux from GRBs derived by Mannheim [18] and Waxman and Bahcall [19]. The curve labeled ’TD’ shows the prediction for neutrino flux from topological defects due to specific top-down scenario BHS1 [20].
Our combined 90% C.L. limit at the W - resonance energy is:
| (2) |
and is given by the rectangle in Fig.5.
4 SEARCH FOR ACOUSTIC SIGNAL FROM EAS CORE IN WATER
In 2002 the Baikal collaboration has reported the observation of characteristic bipolar acoustic signal in time coincidence with an EAS detected by a scintillator array [4]. The scintillator array was placed on ice cover and the hydrophone in water, at the depth of 5 m and at a distance of 90 m from the array center. In the two years since then experiments with acoustic hydrophones triggered by the EAS array have been continued.
In both experiments the EAS array consisted of seven scintillator counters. Six counters formed a circle with radius 80 m in 2001 (50 m in 2002). The seventh counter was placed in the center of the circle. Measurements of the number of relativistic particles in each counter and the relative time delays allow reconstructing the shower parameters: arrival direction, core position and total number of electrons.
In the experiment of March/April 2001, four hydrophones were located at a distance of 34 m from the center of the EAS array and formed a square. Ten runs of measurements have been carried out. Hydrophones were placed in water at a depth of 4 m in seven runs, while they were located in air, on the ice cover, in three runs.
In the second experiment (March/April 2002), a more compact acoustic antenna was used. Three hydrophones were placed at the corners of an equilateral triangle at a distance of 1 m each from other. All three hydrophones were in water at a depth of 4 m. The fourth hydrophone was located below the triangle center at a depth of 8 m.
On top of our own anntenas, hydrophones from an ITEP/Moscow group have been operated in both experiments. ITEP’s antennas had four hydrophones of different type, placed on a vertical string and separated from each other by 5 m [21].
In order to record an acoustic signal, a multi channel digitizer was used. The EAS array triggered the data acquisition system and started the digitizers. The digitizers recorded the signal from each hydrophone during 0.1 sec with a step width of 2 sec. So, for each shower there are four time series consisting of 50 000 measurements of the amplitude of the acoustic signal.
The analysis of the time series shows that apart from Gaussian noise, which can be parameterized by average amplitude and standard deviation , there are large fluctuations lasting from tens up to hundreds microseconds. These ”perturbations” could be due to real acoustic signals produced by some source. Selecting ”perturbations” with a duration between 20 and 100 sec and an average amplitude more than 2, we have found in average 50 ”perturbations” in each channel per one event. Probably, they are mainly due to ice cracking.
Combining ”perturbations” recorded by the four hydrophones and using the known sound velocity in Baikal water, 1405 m/sec, one can reconstruct the position of the source in space and time. We have found 46 events within a time window +/-0.5 msec relative to the EAS trigger, when the hydrophones were placed in water, and 13 events in the case of hydrophone location in air.
The expected background was estimated assuming that the sound sources are independent and uniformly distributed in ice. Simple Monte Carlo calculations predict 26 and 12 events respectively. One can say there is excess of events within time window +/- 0.5 msec at the level of 2 in the case of hydrophones located in water. The analysis of the 2002 experiment is in progress.
5 NT-200 AND BEYOND
Recently derived upper limits on (AMANDA) and (BAIKAL) fluxes are about cm-2 s-1 sr-1 GeV and belong to the region of most optimistic theoretical predictions. A flux sensitivity at the level of cm-2 s-1 sr-1 GeV which would test a variety of other models, requires detection volumes of a few dozen Mtons.
We envisage an upgrade of NT-200 to the scale of a few dozen Mton by three sparsely instrumented distant outer strings. The basic principle will be the search for cascades produced in a large volume below NT-200. This configuration, christened NT-200, will not only result in an increased detection volume for cascades, but also allow for a precise reconstruction of cascade vertex and energy within the volume spanned by the outer strings.
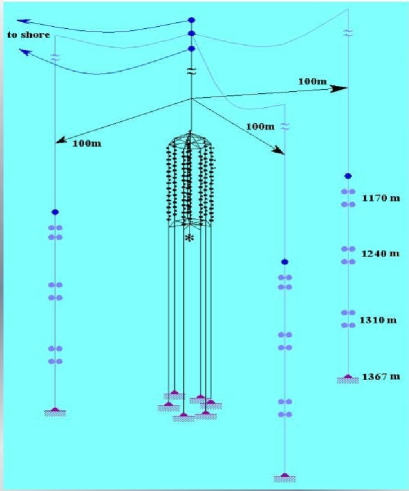
A schematic view of NT-200+ is shown in Fig.6. It will comprise the neutrino telescope NT-200 itself as well as three 140 m long outer strings with 3 pairs of OMs spaced vertically by 70 m, and two pairs of OMs spaced by 6 m and arranged at one of the eight strings of NT-200, 140 m below it. The outer strings are arranged at a distance of 100 m around NT-200 at the edges of an equilateral triangle. Their top OMs are located at the level of the bottom OMs of NT-200. A water volume of m3 is surrounded by the outer strings and NT-200.
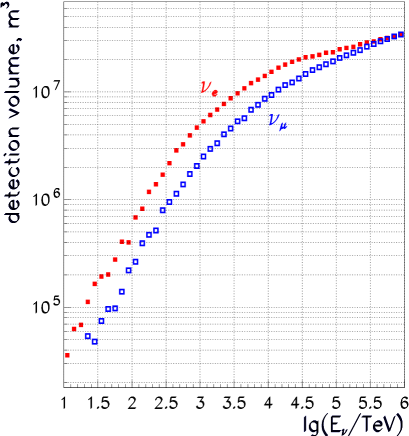
Moderate event selection requirements allow to achieve a large detection volume for neutrino events and to suppress background effectively. The detection volumes for isotropic and fluxes are shown in Fig.7. The value of for induced events rises from 7105 m3 for 100 TeV up to 4107 m3 for TeV. Normalized energy distributions of expected event rates from and fluxes following an inverse power law with spectral index are presented in Fig.8. Most of the expected events would be produced by neutrinos from the energy range TeV, with a mean energy around 1 PeV.
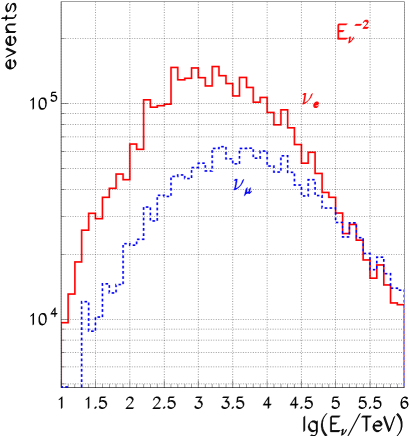
Assuming and flavor ratio and a flux of
| (3) |
a one year expectation would yield 2.4 events.
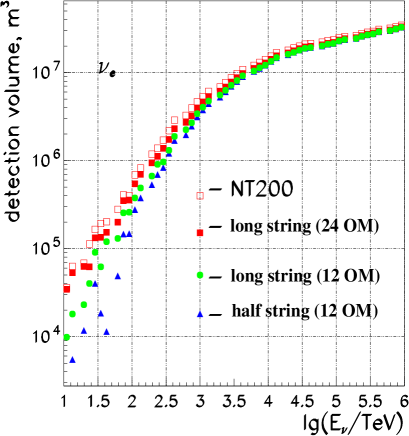
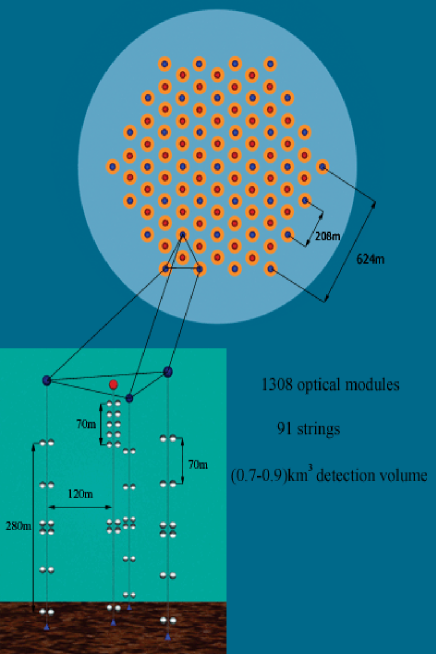
MC simulations show that the detection volume of NT-200 for PeV cascades varies only moderately, if NT-200 as the central part of NT-200 is replaced by a single string of OMs. Fig.9 gives the detection volume for different configurations as a function of cascade energy. The standard configuration of NT-200 is marked by empty rectangles. The other configurations comprises a single string instead of NT-200: a standard string of 70 m length and 24 OMs (filled rectangles), a half string with 12 OMs covering 35 m (dots), and a 70 m long string sparsely equipped with 12 OMs (triangles). The configuration with the long 12-OM string shows an energy behaviour very close to the one of NT-200. For neutrino energies higher than 100 TeV such a configuration could be used as a basic subarray of a Gigaton Volume Detector (GVD). Rough estimations show that 0.7 0.9 Gton detection volume for neutrino induced high energy cascades may be achieved with about 1300 OMs arranged at 91 strings. A top view of GVD as well as sketch of one basic subarray are shown in Fig.10. The physical capabilities of GVD at very high energies cover the typical spectrum of cubic kilometer arrays. We are presently working on simulations to optimize the response for TeV muons, maintaining at the same time the cubic kilometer scale for cascades with energy above 100 TeV.
6 CONCLUSIONS AND OUTLOOK
The deep underwater neutrino telescope NT-200 in Lake Baikal is taking data since April 1998. Using the first 234 live days, 34 neutrino induced upward going muons have been selected. The limits on the diffuse high energy () flux as well as flux at the W-resonance energy have been derived. Also limits on an excess of the muon flux due to WIMP annihilation in the center of the Earth and on the flux of fast magnetic monopoles have been obtained. The additional analyzes of the experimental data accumulated during 1999-2002 will allow to decrease these limits by a factor 3-4.
Within the next few years we plan to upgrade the Baikal neutrino telescope to the 10 Mton detector NT-200+ with a sensitivity of approximately cm-2s-1sr-1GeV for a diffuse neutrino flux within the energy range 102 TeV 105 TeV. NT-200+ will search for neutrinos from AGNs, GRBs and other extraterrestrial sources, neutrinos from cosmic ray interactions in the Galaxy as well as high energy atmospheric muons with E TeV.
In parallel to this short term goal, we started research & development activities towards a Gigaton Volume Detector in Lake Baikal.
This work was supported by the Russian Ministry of Research,the German Ministry of Education and Research and the Russian Fund of Fundamental Research ( grants 00-15-96794, 02-02-17031, 02-02-31005, 02-07-90293 and 01-02-17227) and by the Russian Federal Program “Integration” (project no. e0248).
References
- [1] I.A.Belolaptikov et al., Astropart. Phys. 7 (1997) 263.
- [2] R.I.Bagduev et al., Nucl. Instr. Meth. A420 (1999) 138.
- [3] I.A.Belolaptikov et al., Astropart. Phys. 12 (1999) 75.
- [4] V.A.Balkanov et al., Nucl. Phys. Proc. Sup. B91 (2001) 438.
- [5] I.A.Sokalski et al., Phys. Rev. D64 (2001) 074015; hep-ph/0010322.
- [6] V.A.Balkanov et al., Proc. of 9th Int. Workshop on Neutrino Telescopes. Ed. by Milla Baldo Ceoline. Venezia, March 6-9 (2001) 591; astro-ph/0105269.
- [7] V.A.Balkanov et al., Astropart. Phys. 14 (2000) 61.
- [8] E.Andres et al., Nucl. Phys Proc. Sup. B110 (2002) 510.
- [9] M.Ambrosio et al., Nucl. Phys Proc. Sup. B110 (2002) 519.
- [10] W.Rhode et al., Astropart. Phys. 4 (1994) 217.
- [11] L.Volkova, Yad.Fiz. 31 (1980) 1510.
- [12] M.Thunman et al., Astr. Phys. 5 (1996) 309.
- [13] V.S.Berezinsky et al., Astrophysics of Cosmic Rays, North Holland (1990).
- [14] F.W.Stecker and M.H.Salamon, astro-ph/9501064 (1995)
- [15] R.Protheroe, The Astron. Soc. of the Pacific 163 (1997) 585; astro-ph/9809144 (1998).
- [16] K.Mannheim et al., astro-ph/9812398 (1998).
- [17] E.Waxman and J.Bahcall, Phys. Rev. D59 (1999) 023002.
- [18] K.Mannheim, astro-ph/0010353 (2000).
- [19] E.Waxman and J.Bahcall, Phys. Rev. Lett. 78 (1997) 2292.
- [20] P.Bhattacharjee et al., Phys. Rev. Lett. 69 (1992) 567; G.Sigl, astro-ph/0008364 (2000).
- [21] V.I.Albul et al., Prib. & Tech. Eks. 3 (2001) 50.