12CO(J=21) and CO(J=32) observations of Virgo Cluster spiral galaxies with the KOSMA telescope: global properties
We present 12CO (J=21) and CO (J=32) observations of quiescent Virgo Cluster spiral galaxies with the KOSMA 3m submm telescope. The beam sizes of 80″ at 345 GHz and 120″ at 230 GHz are well suited for the investigation of global properties of Virgo Cluster galaxies. The observed sample was selected based on previous 12CO (J=10) detections by Stark et al. (1986), performed with the AT&T Bell Laboratory 7m telescope (beam size 100″). We were able to detect 18 spiral galaxies in 12CO (21) and 16 in 12CO (32). Beam matched observations of the lowest three 12CO transitions allow us to compare our results with previous high spatial resolution studies of (moderate) starburst galaxies and galactic core regions. We discuss the global excitation conditions of the ISM in these quiescent spiral galaxies. The resulting CO (3–2)/(1–0) integrated line ratios vary over a relatively narrow range of values from 0.35 to 0.14 (on a –scale) with increasing CO (2–1)/(1–0) ratio (from 0.5 to 1.1). The line ratios between the three lowest rotational transitions of CO cannot be fitted by any radiative transfer model with a single source component. A two-component model, assuming a warm, dense nuclear and a cold, less dense disc component allows us to fit the observed line ratios for most of the galaxies individually by selecting suitable parameters. The two-component model, however, fails to explain the observed correlation of the line ratios. This is due to a variation of the relative filling factor of the warm gas alone, assuming a typical set of parameters for the two components common for all galaxies.
Key Words.:
Surveys, ISM: molecules, Galaxies: ISM, Galaxies: spiral, Galaxies: clusters: individual:Virgo Cluster, Submillimeter1 Introduction
We present 12CO (J=21) and 12CO (J=32) observations of 20 spiral galaxies in the Virgo Cluster. Several surveys in 12CO have been carried out to study the properties of the cold ISM in external galaxies with large telescopes like the IRAM 30m or FCRAO 15m e.g. Young et al. (1995), Braine & Combes (1992). Most of these are limited to the lowest rotational transitions of 12CO (J=10) and (J=21) which have upper state energies above ground of 5.3 K and 17 K. Improvements in receiver and telescope technology during the last years have made it feasible to study higher CO-transitions in the submillimeter domain in order to trace the warmer and denser molecular gas. With an energy above ground state of 33 K the 12CO (J=32) transition is in the focus of the present investigation. This survey increases the extragalactic sample of higher CO transitions like 12CO (3–2), so far limited to a few mapping projects, e.g. by Wielebinski et al. (1999) and to surveys of nearby galaxies, e.g. by Devereux et al. (1994), Mauersberger et al. (1999). Because of the observational difficulties concerning weather conditions and telescope efficiencies, in most cases the mid–J CO surveys are biased towards nearby spirals with strong CO-lines and galaxies with (moderate) starbursts. These surveys were exclusively made with large (10 m) telescopes like the JCMT, HHT or CSO. The main beam of these telescopes is much smaller than the CO emitting region in the observed galaxies. Thus accurate global fluxes are difficult to determine, even for the few galaxies studied at the distance of the Virgo Cluster with CO-diameters of around 80″. With the survey observations restricted to only a few points within the sample galaxy the question arises how characteristic the deduced line properties are for the observed galaxy.
This is the first study of global properties of 12CO (2–1) and 12CO (3–2) in quiescent spiral galaxies in the Virgo Cluster. At the adopted distance of 15 Mpc (Stark et al. 1986) the beam sizes are equal to 7-10 kpc and cover at least the core region and inner disc. Most of the CO emission is thus contained in a single pointing of the telescope beam and gives us the opportunity to deduce the global properties of the bulk of the molecular ISM in the observed galaxies.
| source name | RC3 type | inclination | R.A. | DEC | vlsr | ||
|---|---|---|---|---|---|---|---|
| (deg) | (B1950.0) | (B1950.0) | (km/s) | (deg) | |||
| NGC 4192 | SAB(s)ab | 2 | 74 | 12:11:15.5 | 15:10:23 | -135 | 4.8 |
| NGC 4212 | SAc | 5 | 47 | 12:13:06.6 | 14:10:46 | -83 | 4.0 |
| NGC 4237 | SAB(rs)bc | 4 | 47 | 12:13:06.6 | 14:10:46 | 1123 | 8.0 |
| NGC 4254 | SA(s)c | 5 | 28 | 12:16:16.9 | 14:41:46 | 2405 | 3.3 |
| NGC 4298 | SA(rs)c | 5 | 67 | 12:19:00.4 | 14:53:03 | 1136 | 3.2 |
| NGC 4302 | Sc:sp | 5 | 90 | 12:19:10.2 | 14:52:43 | 1150 | 3.1 |
| NGC 4303 | SAB(rs)bc | 4 | 25 | 12:19:21.4 | 14:44:58 | 1568 | 8.2 |
| NGC 4321 | SAB(s)bc | 4 | 28 | 12:20:23.2 | 16:06:00 | 1575 | 3.9 |
| NGC 4402 | Sb | 3 | 75 | 12:23:35.8 | 13:23:22 | 234 | 1.4 |
| NGC 4419 | SB(s)a | 1 | 67 | 12:24:24.6 | 15:19:24 | -209 | 2.8 |
| NGC 4501 | SA(rs)b | 3 | 58 | 12:29:28.1 | 14:41:50 | 2284 | 2.1 |
| NGC 4527 | SAB(s)bc | 4 | 72 | 12:31:35.5 | 14:41:50 | 2284 | 9.8 |
| NGC 4535 | SAB(s)c | 5 | 43 | 12:29:28.1 | 14:41:50 | 2284 | 4.3 |
| NGC 4536 | SAB(rs)bc | 4 | 67 | 12:31:47.9 | 08:28:25 | 1962 | 10.2 |
| NGC 4567 | SA(rs)bc | 4 | 46 | 12:34:01.1 | 11:32:01 | 2277 | 1.8 |
| NGC 4568 | SA(rs)bc | 4 | 64 | 12:34:03.0 | 11:30:45 | 2255 | 1.8 |
| NGC 4569 | SAB(rs)ab | 2 | 63 | 12:34:18.7 | 13:26:18 | -236 | 1.7 |
| NGC 4647 | SAB(rs)c | 5 | 36 | 12:41:01.1 | 11:51:21 | 1422 | 3.2 |
| NGC 4654 | SAB(rs)cd | 6 | 52 | 12:41:25.7 | 13:23:58 | 1039 | 3.3 |
| NGC 4689 | SA(rs)bc | 4 | 30 | 12:45:15.2 | 14:02:07 | 1620 | 4.3 |
2 The observed sample
Our sample of spiral galaxies is based on the Virgo Cluster 12CO (1–0) survey by Stark et al. (1986), performed with the AT&T Bell Laboratory 7m telescope (beam size 100″) and the 12CO (1–0) survey by Kenney & Young (1988), performed with the FCRAO telescope (beam size 45″). Both samples are blue magnitude-limited (B=12) (de Vaucouleurs & Corwin (1976), Sandage & Tammann (1981)) and consist of spiral galaxies (morphological type Sa or later). From these two surveys the 20 strongest 12CO (1–0) sources, listed in Table 1, have been selected. We adopt a distance of 15 Mpc to the Virgo Cluster (Stark et al. 1986). For three of the galaxies, the CO (1–0) line intensities quoted by Stark et al. (1986) and Kenney & Young (1988) do not agree, so that we leave the entries blank in Table 2.
For the selected galaxies, previous papers claim a distance variation of at most 20%, so that we can directly compare the observed CO-fluxes of the different sample galaxies.
3 Observations and data reduction
The observations described in this paper have been carried out with the Kölner Observatorium für Submillimeter Astronomie (KOSMA) 3m submm telescope (Degiacomi et al. 1995) at 230 GHz during autumn 1999 and at 345 GHz in January 2000. The main beam efficiency has been determined by observing planets with a continuum backend. It was found to be 68% at 230 GHz and 345 GHz. Broadband Acousto Optical Spectrometers with bandwidths of 1 GHz, corresponding to 1300 km/s at 230 GHz and 800 km/s at 345 GHz, have been used for the observations. This is suitable even for edge-on galaxies with very broad lines of more than 500 km/s. Typical peak antenna temperatures of the observed galaxies in the Virgo Cluster are between 4 and 30 mK for 12CO (2–1) (beam size: 110″) and 12CO (3–2) (beam size: 80″).
Because of the weakness of the observed sources, integration times of typically 3–6 h were necessary to yield a low noise rms of 1.5 –3 mK for v = 10 km/s and Tsys = 150 – 200 K (DSB).
All measurements were performed in a Dual Beam Switch (i.e. chop and nod) technique, with chopper throws of 6′ in azimuth. The DBS technique yields spectra with flat baselines over the whole bandpass. For the data reduction it was sufficient to remove a linear baseline. Due to the fact that some galaxies of the sample are seen edge-on with very broad lines, the error of the line integral depends on the number of the baseline channels outside the line. Therefore the error was determined using
| (1) |
with Nline the number of channels in the line, Nbaseline the number of baseline channels, the channel width, and Trms the baseline rms per velocity channel, as already independently used by Lavezzi et al. (1999).
| Name | I(CO) | I | I(CO) | I | I(CO) | I | R2,1 | R3,2 | R3,1 | ||||
|---|---|---|---|---|---|---|---|---|---|---|---|---|---|
| NGC | (1–0) | (2–1) | (3–2) | (″) | |||||||||
| (1) | (2) | (3) | (4) | (5) | (6) | (7) | (8) | (9) | (10) | (11) | (12) | (13) | (14) |
| 4192 | 4.13 | 0.36 | 5.59 | 1.30 | 0.84 | 0.29 | 74.5 | 1.73 | 0.42 | 0.09 | 0.04 | 0.16 | 0.06 |
| 4212 | 4.66 | 0.21 | 3.10 | 0.73 | 2.11 | 0.34 | 48.0 | 0.90 | 0.22 | 0.35 | 0.10 | 0.31 | 0.05 |
| 4254 | 13.69 | 0.54 | 8.42 | 0.57 | 3.92 | 0.75 | 57.6 | 0.82 | 0.06 | 0.26 | 0.05 | 0.21 | 0.04 |
| 4298 | —– | —- | 3.38 | 0.59 | 0.75 | 0.34 | 84.0 | —- | —- | 0.14 | 0.07 | —- | —- |
| 4302 | —– | —- | 3.84 | 0.51 | 1.01 | 0.53 | 68.4 | —- | —- | 0.15 | 0.08 | —- | —- |
| 4303 | 10.16 | 0.30 | 5.58 | 0.40 | 3.45 | 0.51 | 75.6 | 0.70 | 0.05 | 0.37 | 0.06 | 0.26 | 0.04 |
| 4321 | 12.59 | 0.38 | 6.56 | 0.70 | 4.09 | 0.28 | 60.0 | 0.69 | 0.12 | 0.35 | 0.14 | 0.24 | 0.02 |
| 4402 | 4.7 | 0.28 | 4.15 | 0.59 | 1.61 | 0.17 | 90.0 | 1.10 | 0.17 | 0.25 | 0.07 | 0.27 | 0.03 |
| 4501 | 13.31 | 0.38 | 6.89 | 0.96 | 1.86 | 0.26 | 76.8 | 0.66 | 0.09 | 0.16 | 0.03 | 0.11 | 0.02 |
| 4527 | 17.77 | 0.41 | 7.69 | 0.75 | 5.22 | 0.52 | 91.2 | 0.53 | 0.05 | 0.44 | 0.06 | 0.24 | 0.02 |
| 4535 | 5.26 | 0.30 | 4.21 | 0.51 | 1.56 | 0.30 | 62.4 | 1.05 | 0.14 | 0.21 | 0.05 | 0.22 | 0.04 |
| 4536 | —– | —- | 4.93 | 1.06 | 2.62 | 0.20 | 50.4 | —- | —- | 0.28 | 0.06 | —- | —- |
| 4567 | 5.98 | 0.59 | 5.19 | 0.70 | 1.17 | 0.30 | 48.0 | 1.17 | 0.19 | 0.12 | 0.03 | 0.14 | 0.04 |
| 4568 | 8.72 | 0.50 | 5.18 | 0.66 | 4.00 | 0.33 | 68.4 | 0.77 | 0.11 | 0.45 | 0.07 | 0.35 | 0.03 |
| 4569 | 11.84 | 0.32 | 5.81 | 0.69 | 3.55 | 0.68 | 68.4 | 0.64 | 0.08 | 0.35 | 0.08 | 0.23 | 0.04 |
| 4647 | 6.3 | 0.38 | 2.10 | 0.30 | 1.52 | 0.13 | 48.0 | 0.45 | 0.07 | 0.37 | 0.06 | 0.17 | 0.02 |
| 4654 | 7.1 | 0.32 | 2.39 | 0.53 | 1.40 | 0.16 | 48.0 | 0.46 | 0.10 | 0.30 | 0.08 | 0.14 | 0.02 |
| (1) : | galaxy name (New Galactic Catalogue) |
|---|---|
| (2) : | CO (1–0) Intensity [K km/s] of the central position by Stark et al. (1986) |
| (3) : | CO (2–1) Intensity [K km/s] of the central position observed with KOSMA |
| (6) : | CO (3–2) Intensity [K km/s] of the central position observed with KOSMA |
| (8) : | gaussian HPBW of the CO (1–0) distribution observed by Kenney & Young (1988) |
| (9) : | CO (2–1)/(1–0) line ratio corrected for beam filling |
| (11): | CO (3–2)/(2–1) line ratio corrected for beam filling |
| (13): | CO (3–2)/(1–0) line ratio corrected for beam filling |
4 Results
4.1 The spectra
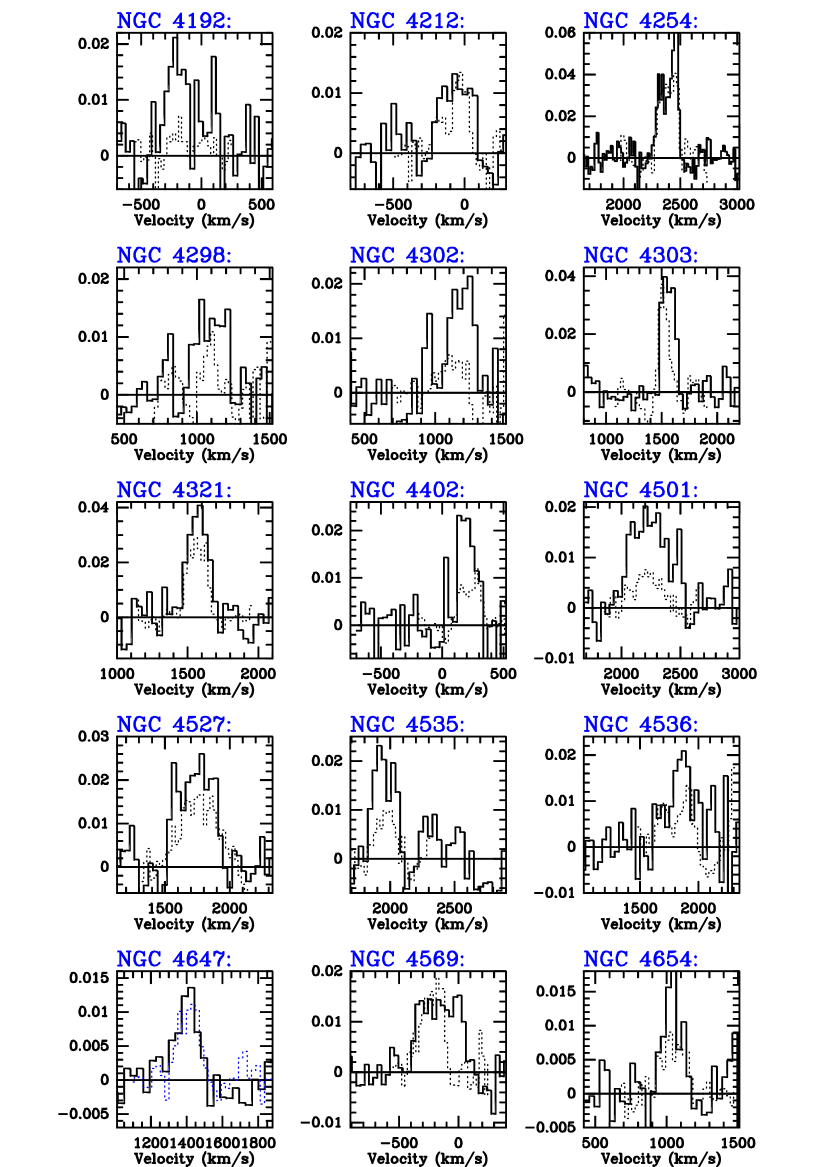
From the sample of 20 selected galaxies, we were able to detect 18 in 12CO (2–1) and 16 in 12CO (3–2) with the KOSMA 3m telescope. The results of the observations are shown in Fig. 1. The derived line intensities and intensity ratios are compiled in Table 2.
NGC 4303 and NGC 4321 were mapped at four additional points (five point cross) to estimate the 12CO (3–2) extend within the larger 12CO (2–1) beam. The spatial variation of the antenna temperature is in agreement with the adopted source sizes deduced below from the published 12CO (1–0) data.
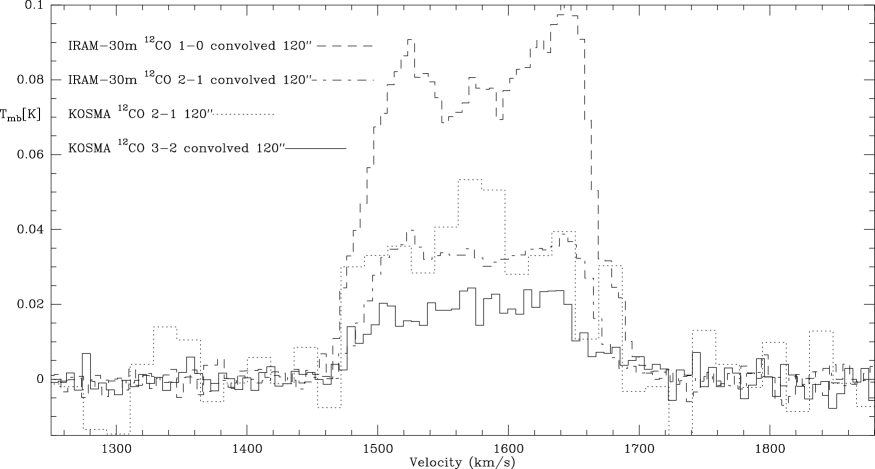
For NGC 4321 higher angular resolution data from the IRAM 30m–telescope is available (Sempere & García-Burillo 1997), which we used to cross-check the intensity calibration. Fig. 2 shows good agreement between the KOSMA 3m 12CO (2–1) data set and the convolved IRAM 30m data with regard to both, line shape and calibration.
4.2 The Line Ratios
The main goal of the present work is to derive proper line intensity ratios. The line widths in CO (1–0), (2–1), (3–2) are the same within the errors (see Fig. 1 and Fig. 2). We thus use the higher S/N velocity integrated line intensities, rather than peak brightness temperatures to derive the line intensity ratios.
To correct for the different beam sizes (80″, 100″ and 120″ beams) we have to estimate the source extent. Every galaxy of our survey was also observed in 12CO (1–0) along the major axis by Kenney & Young (1988). In order to rescale the data to a common beam size of 120″ the radial CO emission profile for each galaxy can be fitted by a Gaussian function (see Fig. 3).

Using this we can estimate the extent (Gaussian HPBW: ) of the emitting 12CO (1–0) region. Assuming that the emitting region is the same for all three observed transitions it is possible to rescale each integrated spectrum from its observed beam size to an equivalent beam size of 120″ (with for the CO(1–0) survey by Stark et al. (1986) and for the new KOSMA (3–2) results):
| (2) |
We then calculate the corrected line ratios, adopting a Gaussian source distribution and a Gaussian profile for a 120″beam:
| (3) |
| (4) |
| (5) |
The analysis is based on the assumption that the emission from all three transitions originates from the same region. This seems justified because on one hand the CO (3–2) emission is found extended beyond the nucleus and also in the discs of spiral galaxies (Walsh et al. 2002). On the other hand this is confirmed in our sample by the detailed study of NGC 4321 and NGC 4303, where we compared R3,2 with the (3–2)/(2–1) ratio when convolving the CO (3–2) map to 120″ and found both to be similar within the errors.
As our beam sizes for the observed transitions differ not that much, the error due to beam filling is rather small. Even if this assumption would not apply, the resulting error would nevertheless be relatively small: The larger scaling factor (i.e. the one for the smaller CO (3–2) beam), , varies only between 0.62 (for the typically largest source sizes around estimated from CO (1-0)) and (for compact, point like emission).
As we lack resolution to solve the problem, we will use the CO (1-0) emission profile to rescale the (3-2) emission.
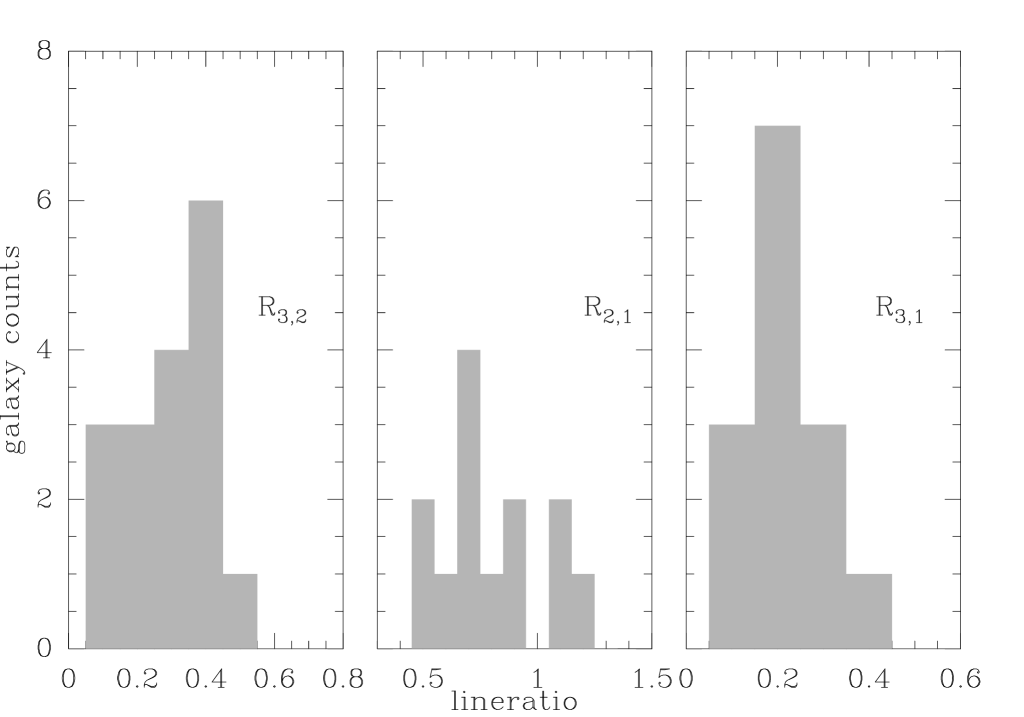
After correction for beam filling we derive (3–2)/(2–1) line ratios between 0.1 and 0.45, and (2–1)/(1–0) ratios in the range of 0.45 to 1.2 (excluding the low S/N case of NGC 4192). The complementary (3–2)/(1–0) ratios cover a relatively narrow range from 0.11 to 0.35. Table 2 lists the ratios for each source, together with the error bars estimated from the fit errors of the integrated intensities; for completeness and easier comparison with the literature, it also includes the resulting (3–2) versus (1–0) ratio . Fig. 4 shows histograms of the observed distribution of line ratios.
In comparison with this, the CO (3–2) survey of 28 nearby galaxies by Mauersberger et al. (1999) covers a range for from 0.2 to 0.7, with a tendency for the galaxies without strong star formation activity towards lower ratios. In contrast, galaxies with star formation activity such as selected in the survey of 7 nearby starburst nuclei (Devereux et al. 1994) or in the study of 8 dwarf starburst galaxies by Meier et al. (2001), cover higher values between 0.4 and 1.4. In addition, detailed mapping of the CO (3–2) emission in a sample of 12 bright and nearby galaxies by Dumke et al. (2001), shows that the CO (3–2) emission is more compact. The (3–2)/(1–0) ratio drops from values close to unity in the dense cores of these galaxies, down to values of around 0.5 with increasing distance from the galactic nucleus. As mentioned before, all these surveys have been done with the larger submm telescopes in relatively nearby sources, and thus have beams that resolve the nucleus/disc structure. In addition, the mapping typically is concentrated on the inner regions, where the CO (3–2) emission is still relatively easy to detect. Our, in this regard unbiased, survey of 20 galaxies in the distant Virgo Cluster with the comparably large beam of the KOSMA 3m telescope gives a (3–2)/(1–0) ratio towards the low end or even lower than in the other studies. This fact supports the concept of a compact, brighter core region and very weak (if present at all) CO (3–2) emission from the extended discs of galaxies. As at least a substantial fraction of our Virgo sample is unresolved both in CO (1–0) and (3–2), this ratio will not drop further if averaged over larger areas. We thus expect the average value of of 0.20 to be typical for a large fraction of galaxies. A comparable study of a sample of 33 galaxies in the Coma cluster by Lavezzi et al. (1999) in the CO (2–1) and (1–0) lines gives a range of (2–1)/(1–0) ratios of 0.5 to 1.3; this is in good agreement with the range covered by the 16 Virgo galaxies detected in the present study.
The detected (3–2)/(2–1) ratios have an average value of 0.23, which is in the order of the line ratio of the core regions of rather quiescent nearby galaxies as observed by Mauersberger et al. (1999) (e.g. IC 10, NGC 891, NGC 5907). Observations with the KOSMA 3m telescope in the galactic ring of the Galaxy (priv. comm. Brüll, PhD work) show an average (3–2)/(2–1) ratio of 0.7 0.2 .
| Model | cold | warm | ||||
|---|---|---|---|---|---|---|
| Tkin | n(H2) | N(CO)/v | Tkin | n(H2) | N(CO)/v | |
| [K] | cm | cm | [K] | cm | cm | |
| (a) | 10 | 1000 | 1.5e14 | 50 | 1000 | 1.0e13 |
| (b) | 10 | 1000 | 1.0e14 | 50 | 1.0e4 | 1.0e13 |
| (c) | 10 | 1.0e4 | 1.5e15 | 50 | 1.0e5 | 1.5e15 |
| (d) | 10 | 4.5e4 | 1.5e14 | 50 | 1.0e6 | 1.5e15 |
| (e) | 10 | 4.5e4 | 1.5e14 | 50 | 1.0e4 | 1.0e13 |
4.3 Modeling of the CO emission line ratios
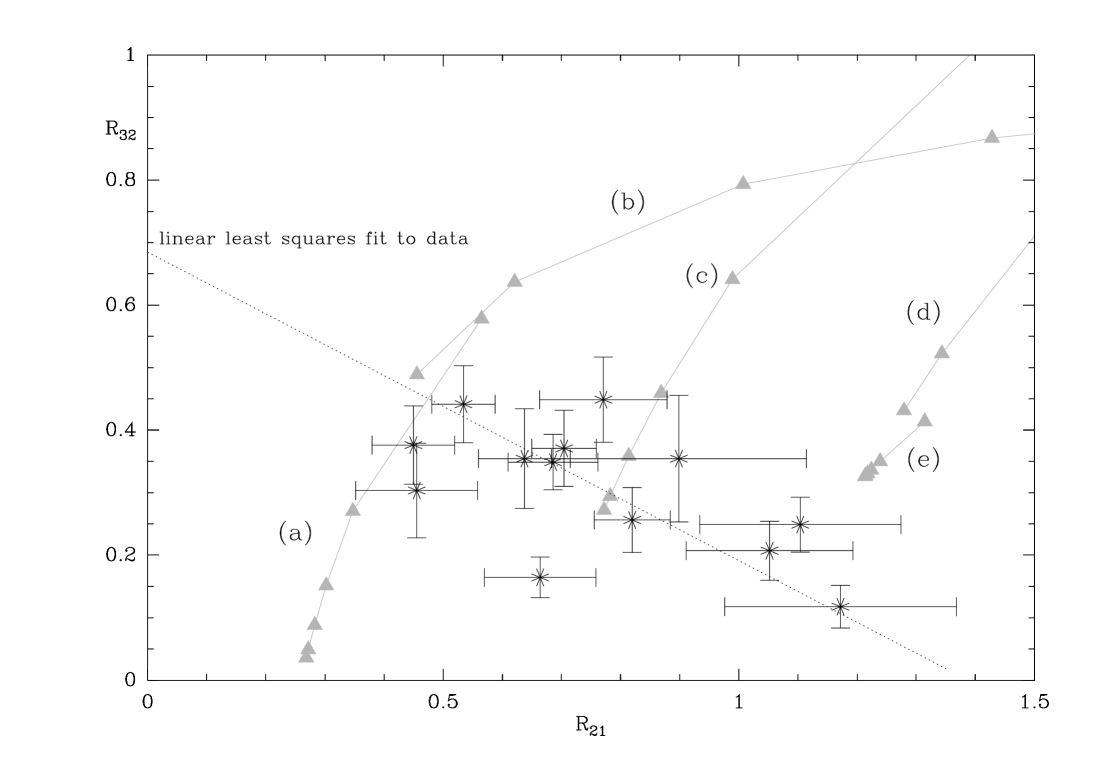
Fig. 5 shows against . The resulting correlation plot does not show any trend for growing with increasing . This would be expected in a simple model for the CO emission, where the brightness of the higher excitation lines would stay high due to the increased temperature or density of the source region. There seems to be a tendency for an anti-correlation: Fig. 5 includes the result of a linear least squares fit analysis, which gives a correlation coefficient of -0.72 . No galaxy with above unity has above 0.3, and all of the galaxies with above 0.3 have below 0.8.
Before we can interpret the observed line ratios any further, we check the data set for any correlation with other parameters of the observed sample. It is known that the Virgo Cluster galaxies are heavily HI-deficient in the central region of the cluster (van Gorkom & Kotanyi 1985), presumably caused by HI ram-pressure stripping due to the interaction of the galaxies with the cluster environment. It is important to check whether this influences the CO emission. There is no evidence for a correlation between the CO-emission strength and the distance to M 87, which is the kinematic center of the Virgo Cluster (Fig. 6). This is in agreement with the finding of Stark et al. (1986) for the CO (1–0) emission. The molecular material seems to be affected by tidal interaction between the cluster galaxies (Combes et al. 1988).
Because of the fact, that the beam covers the central regions of the galaxies and also partly their discs with various inclination angles in the sample, one might suspect that optical depth effects and self absorption of the supposedly brighter emission from the central region in the disc, might affect the observed line intensities. Regarding to Fig. 7, no correlation between the observed line ratios and the inclination angle can be found.


4.3.1 Single component models
Although the 12CO emission is almost certainly optically thick, it is not possible to explain the observed line ratios assuming LTE-excitation conditions and optically thick 12CO emission. We thus compare the observed ratios with a slightly more sophisticated excitation model, namely escape probability radiative transfer calculations for spherical clumps (Stutzki & Winnewisser 1985). In Fig. 8 the escape probability radiative transfer results are shown for kinetic temperatures of 10 K and 30 K, and the average observed line ratios with typical error bars are indicated.
At least the averaged ratios are roughly consistent with the emission being dominated by very cold gas, 8 to 15 K, at densities of around cm-3 and up to moderate column densities. However, a detailed comparison of the values for individual sources from Table 2 with the escape probability radiative transfer results shows that the model fails to explain the two observed ratios within the error bars in each individual case.
4.3.2 Two-component model
In a next step we try to model the observed ratios as originating from a superposition of two components, a warm dense and a cool less dense gas component, so that
| (6) |
T the observed brightness temperature of the observed transition , T the brightness temperature of the cold phase, that of the warm phase, the fraction of the warm material, and the overall beam filling factor of the emission (it is assumed to be the same for the observed transitions, which cancels out in the calculated ratios). Obvious choices would be a warm and dense core region filling only a fraction of the beam (and varying in size relative to the beam from source to source) and a more extended, cold, low-density component from the galactic disc. The warm, dense component may also be distributed throughout the disc in the form of many localized star forming regions. Using escape probability models we calculated the brightness temperatures for typical H2 densities and CO column densities per velocity interval, varying the filling factor of the warm phase between 0.01 and 0.5. Selected results of the models are shown in Fig. 5. The adopted ad hoc chosen parameters for the models a)e) are listed in Table 3. From Fig. 5 it is obvious that it is possible to find solutions for individual galaxies by interpolating the sample models a)e), except for the galaxies with observed (2–1)/(1–0) ratios above 1 and (3–2)/(2–1) ratios below 0.3.
The two-component model however fails to explain the apparent anti-correlation between and , which arises from the variation of the fraction alone with otherwise fixed values for the warm and cold component. The tracks of varying in each model a)e) run rather orthogonally to the / trend.
5 Conclusions
We have investigated a sample of 20 galaxies in the Virgo Cluster, which have been selected to be the the brightest CO (1–0) emitters. We observed them in the CO (3–2) and (2–1) lines using the KOSMA 3m telescope with its 120″ , respectively 80″ beam. We detected 18 galaxies in CO (2–1) and 16 in CO (3–2). This survey extends the database beyond the handful of quiescent galaxies investigated in previous surveys. The relatively large beam includes the complete CO emission in most cases, so that the correction for beam filling is relatively straight forward, and we are able to deduce relatively precise integral line ratios for these sources.
This data set is unique in the sense that it is not biased towards selecting starburst galaxies or emphasizing the brighter emission from the core region of galaxies, which has been the tendency in most of the few previous CO (3–2) studies of external galaxies. The CO (3–2) to (1–0) integrated line ratio in our Virgo sample of galaxies covers a relatively narrow range of values from 0.14 to 0.35, indicating that most normal galaxies have a line ratio much smaller than that observed in the dense core regions of nearby galactic centers or in starburst galaxies.
The observed line ratios and cannot be consistently fitted by a single-component radiative transfer model, thus indicating that at least a two-component model is necessary to explain the global CO emission properties of the galaxies observed. A straightforward two-component model, assuming a warm, dense nuclear and a cold, less dense disc component for all galaxies has a sufficiently large number of parameters to fit most of the galaxies individually. It fails, however, to explain the observed trend of line ratios within the sample galaxies, if the anti-correlation results only from the variation of the relative filling factor of the warm gas, with the parameters of the warm, dense and the cold, lower density component fixed to a set of values typical for all galaxies.
Acknowledgements.
The KOSMA 3m telescope is operated by the Kölner Observatorium für SubMillimeter Astronomie of the I. Physikalisches Institut, Universität zu Köln in collaboration with the Radioastronomisches Institut, Universität Bonn. This project was supported within SFB 301 and SFB 494 of the DFG and special funding of the Land Nordrhein-Westfalen.We thank García-Burillo for providing us the IRAM 30m data set of NGC 4321. We thank C. Kramer, M. Miller, A.R.Tieftrunk for help with the observations.
References
- Braine & Combes (1992) Braine, J. & Combes, F. 1992, Astronomy and Astrophysics, 264, 433
- Combes et al. (1988) Combes, F., Dupraz, C., Casoli, F., & Pagani, L. 1988, Astronomy and Astrophysics, 203, L9
- de Vaucouleurs & Corwin (1976) de Vaucouleurs, G. & Corwin, H. G. 1976, Second Reference Catalogue of Bright Galaxies (Austin: University of Texas Press)
- Degiacomi et al. (1995) Degiacomi, C. G., Schieder, R., Stutzki, J., & Winnewisser, G. 1995, Optical Engineering, 34, 2701
- Devereux et al. (1994) Devereux, N., Taniguchi, Y., Sanders, D. B., Nakai, N., & Young, J. S. 1994, The Astronomical Journal, 107, 2006
- Dumke et al. (2001) Dumke, M., Nieten, C., Thuma, G., Wielebinski, R., & Walsh, W. 2001, Astronomy and Astrophysics, 373, 853
- Kenney & Young (1988) Kenney, J. D. & Young, J. S. 1988, The Astrophysical Journal Supplement Series, 66, 261
- Lavezzi et al. (1999) Lavezzi, T. E., Dickey, J. M., Casoli, F., & Kazès, I. 1999, The Astronomical Journal, 117, 1995
- Mauersberger et al. (1999) Mauersberger, R., Henkel, C., Walsh, W., & Schulz, A. 1999, Astronomy and Astrophysics, 341, 256
- Meier et al. (2001) Meier, D. S., Turner, J. L., Crosthwaite, L. P., & Beck, S. C. 2001, The Astronomical Journal, 121, 740
- Sandage & Tammann (1981) Sandage, A. R. & Tammann, G. A. 1981, Revised Shapley-Ames Catalog of Bright Galaxies (Washington, DC: Carnegie Institutuion of Washington)
- Sempere & García-Burillo (1997) Sempere, M. J. & García-Burillo, S. 1997, Astronomy and Astrophysics, 325, 769
- Stark et al. (1986) Stark, A. A., Knapp, G. R., Bally, J., et al. 1986, The Astrophysical Journal, 310, 660
- Stutzki & Winnewisser (1985) Stutzki, J. & Winnewisser, G. 1985, Astronomy and Astrophysics, 144, 13
- van Gorkom & Kotanyi (1985) van Gorkom, J. & Kotanyi, C. 1985, in ESO Workshop on the Virgo Cluster, 61–66
- Walsh et al. (2002) Walsh, W., Beck, R., Thuma, G., et al. 2002, Astronomy and Astrophysics, 388, 7
- Wielebinski et al. (1999) Wielebinski, R., Dumke, M., & Nieten, C. 1999, Astronomy and Astrophysics, 347, 634
- Young et al. (1995) Young, J. S., Xie, S., Tacconi, L., et al. 1995, The Astrophysical Journal Supplement Series, 98, 219