The thermal radiation of the isolated neutron star RX J1856.5–3754 observed with Chandra and XMM-Newton
We present results of the analysis of data collected in 57-ks XMM-Newton and 505-ks Chandra observations of the nearby ( 120 pc) isolated neutron star RX J1856.5–3754. We confirm most of the statements made by Burwitz et al. (Buretal01 (2001)) who discussed the original 55-ks Chandra data. Detailed spectral analysis of the combined X-ray and optical data rules out the currently available nonmagnetic light and heavy element neutron star atmosphere (LTE) models with hydrogen, helium, iron and solar compositions. We find that strongly magnetized atmosphere models also are unable to represent the data. The X-ray and optical data show no spectral features and are best fitted with a two-component blackbody model with 63.5 eV and 4.4 (/120 pc) km for the hot X-ray emitting region, and 33 eV and 17 (/120 pc) km for the rest of the neutron star surface responsible for the optical flux. The large number of counts collected with XMM-Newton allows us to reduce the upper limit on periodic variation in the X-ray range down to 1.3% (at a 2 confidence level) in the Hz frequency range. In an attempt to explain this small variability, we discuss an one-component model with 63 eV and 12.3 (/120 pc) km. This model requires a low radiative efficiency in the X-ray domain, which may be expected if the neutron star has a condensed matter surface.
Key Words.:
stars: atmospheres – stars: individual: RX J1856.5-3754 – stars: neutron – X-rays: stars1 Introduction
1.1 Thermal radiation from isolated neutron stars
Thermal emission from the surface of an isolated neutron star (NS) could be very useful for determining the star’s mass and the radius , what in turn puts important contraints on the equation of state of matter at supranuclear densities.
Specifically, the detection of spectral features in radiation of isolated NSs may provide:
-
•
chemical composition of the NS surface,
-
•
the surface gravity from the line broadening,
-
•
the mass-to-radius ratio from measurement of gravitational redshift of the lines,
-
•
strength of the surface magnetic field.
ROSAT was the first satellite with a sufficient sensitivity in the soft X-ray band ( keV) to start a systematic search and study of isolated NSs which reveal blackbody-like thermal emission. Seven such objects emitting soft thermal X-ray spectra, having high X-ray/optical flux and invisible in radio band were detected with ROSAT (see, e. g., Zampieri et al. Zametal01 (2001) for the complete list). RX J1856.5–3754 (or RXJ1856 throughout the text) is the brightest of them in X-rays.
We use apparent temperatures and radii which are measured by a distant observer, throughout this paper. The true parameters as measured at the neutron star surface are given by = and = where = is the Schwarzschild radius of the NS.
1.2 Previous Observations
| Obs. Id. | Instrument (mode) | Obs. Start | Obs. End | Exposure | Obs. | Remark | |
| # | [UT] | [UT] | [ksec] | Type | |||
| Chandra | |||||||
| 113 | LETGS | 2000/03/10 | 2000/03/10 | 55.48 | GTO | ||
| 3382 | LETGS | 2001/10/08 | 2001/10/09 | 101.96 | DDT | ||
| 3380 | LETGS | 2001/10/10 | 2001/10/12 | 167.50 | DDT | ||
| 3381 | LETGS | 2001/10/12 | 2001/10/14 | 171.13 | DDT | ||
| 3399 | LETGS | 2001/10/15 | 2001/10/15 | 9.32 | DDT | ||
| total exposure | 505.39 | ||||||
| XMM-Newton | |||||||
| 0106260101 | EPIC-pn | (SW) | 2002/04/08 | 2002/04/09 | 57.193 | GTO | effective exposure71% = 40 ks |
| 0106260101 | EPIC-MOS1 | (TI) | 2002/04/08 | 2002/04/09 | 57.740 | GTO | no response available yet |
| 0106260101 | EPIC-MOS2 | (SW) | 2002/04/08 | 2002/04/09 | 57.996 | GTO | |
| 0106260101 | RGS1 | 2002/04/08 | 2002/04/09 | 58.546 | GTO | ||
| 0106260101 | RGS2 | 2002/04/08 | 2002/04/09 | 58.546 | GTO | ||
Walter et al. (Waletal96 (1996)) and Neuhäuser et al. (Neuetal97 (1997)) first concluded that RXJ1856 is an isolated NS. The ROSAT data showed that RXJ1856 has a non-variable X-ray flux of erg s-1 cm-2 and a soft spectrum with a blackbody temperature of eV. Very interestingly, the Planckian shape of the spectrum was confirmed later with the first high-resolution Chandra LETGS data (Burwitz et al. Buretal01 (2001); hereafter B01). Actually, the grating spectrum did not show any significant deviations from a Planckian, which are expected in spectra of NS atmospheres containing heavy chemical elements.
The faint optical counterpart with 26 mag of RXJ1856 was discovered by Walter & Matthews (WalMat97 (1997)) and confirmed by Neuhäuser et al. (Neuetal98 (1998)). Walter (Wal01 (2001)) and Neuhäuser (Neu01 (2001)) used the faintness of the optical counterpart and its large proper motion of about mas yr-1 as further arguments that RXJ1856 is indeed an isolated NS. With data from three HST observations of RXJ1856, Walter (Wal01 (2001)) determined the distance to the source to be pc. A re-analysis of the same data led to a revised distance to pc (Kaplan et al. KapKerAnd02 (2002)). One more HST observation allowed Walter & Lattimer (WalLat02 (2002)) to obtain an improved estimate on the distance, pc.
None of the previous analysis of the X-ray data yielded any significant periodicity. With the ROSAT data Pons et al. (Ponetal02 (2002)) derived an upper limit of 6% on the rotational modulation of the flux for periods in the range 0.1 s – 20 s. B01, using the data from the first 55-ks Chandra observation of RXJ1856, put a limit of 8% in the period range 25 ms – 103 s. Analysing the 505-ks Chandra data Ransom et al. (RanGaeSla02 (2002)) and Drake et al. (Draetal02 (2002)) obtained upper limits of 4.5% (10 ms – 103 s) and 2.7% (10 ms – 104 s), respectively.
| Mission | Instrument | / d.o.f. | |||||||||
|---|---|---|---|---|---|---|---|---|---|---|---|
| cm-2 | km (/120 pc) | erg/cm2/s | erg/s | ||||||||
| ROSAT | PSPC | 1.46 | 0.20 | 56.7 | 1.0 | 7.5 | 0.5 | 1.45 | 7.5 | 0.9/ | 16 |
| Chandra | LETGS | 0.95 | 0.03 | 63.5 | 0.2 | 4.4 | 0.1 | 1.14 | 4.1 | 1.2/ | 1145 |
| XMM-Newton | EPIC-pn | 0.18 | 0.03 | 62.8 | 0.3 | 4.3 | 0.1 | 1.67 | 3.7 | 2.3/ | 122 |
| XMM-Newton | EPIC-MOS2 | 0.67 | 0.02 | 62.6 | 0.4 | 4.4 | 0.1 | 1.32 | 3.8 | 6.1/ | 41 |
| XMM-Newton | RGS1+RGS2 | 0.87 | 0.08 | 63.4 | 0.3 | 4.0 | 0.2 | 0.90 | 3.3 | 1.1/ | 717 |
In this paper we describe the Chandra and XMM-Newton data (§2), the results of spectral (§3) and timing (§4) analysis, discuss implications on the nature of RXJ1856 (§5) and propose alternative models (§6).
2 Observations and data extraction
2.1 Chandra LETGS
RXJ1856 was first observed in March 2000 with the standard LETGS configuration followed by four further observations in October 2001 (see Table 1). The LETGS spectrum was extracted from the reprocessed level 2.0 event files. We used the extraction region recommended in the Proposers’ Observatory Guide111 http://asc.harvard.edu/udocs/docs/docs.html (POG) for extracting the source spectrum. For the background, large regions above and below the source extraction area were selected (see B01 and POG) The measured dispersed source count rate is 0.29 0.01 cts s-1 in the 0.15–1.00 keV range. The extracted source spectrum and the most up-to-date effective area tables (version July 2002)222http://asc.harvard.edu/cal/Links/Letg/User were used for spectral fits.
2.2 XMM-Newton
The XMM-Newton GTO observation took place on April 8, 2002 (see Table 1). The duration of the exposure for all instruments was 57 ks. The effective exposure for EPIC-pn CCD in the Small Window mode is about 70% of this giving an effective exposure of ks. The EPIC-pn and EPIC-MOS2 countrates in the 0.12-1.2 keV energy range are cts s-1 and cts s-1, respectively. Two RGS instruments detected the source at the total countrate of cts s-1.
3 Spectral analysis
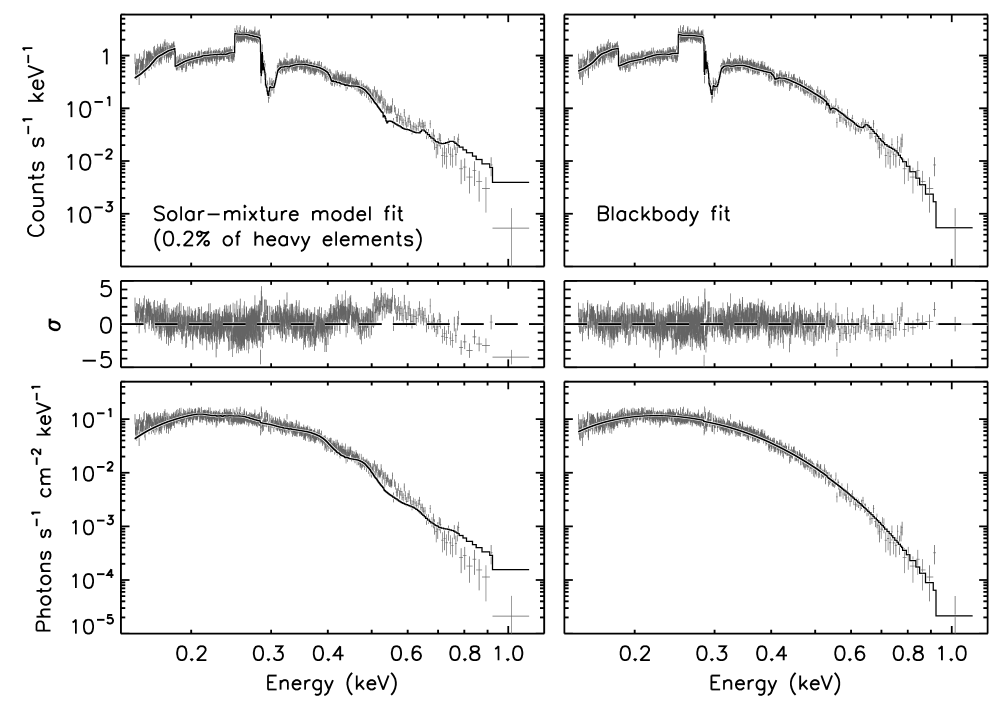
B01 found that the RXJ1856 spectrum detected with the Chandra LETGS instument in the 55-ks observation is best fitted to a blackbody model with eV and 4.4 0.5 km (/120 pc). A fit to the 505-ks LETGS spectrum yields very similar, but much more constrained values of eV and 4.4 0.1 km (/120 pc). The fit is shown in Fig. 2 (right panels).
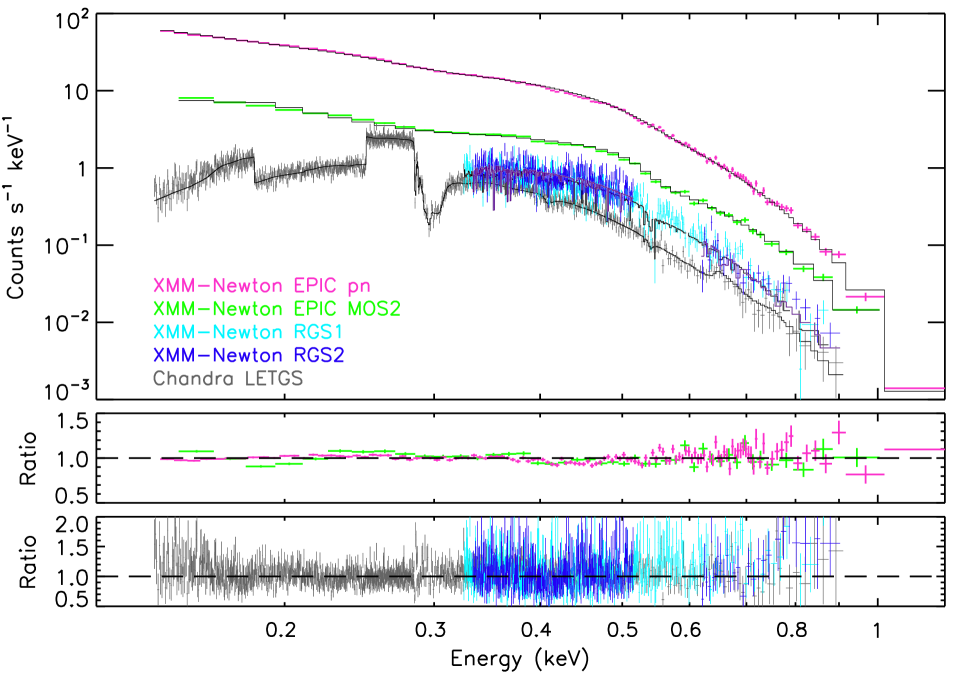
The results of individual fits with blackbody model to the spectra from different instruments are given in Fig. 1 and Table 2. The Chandra and XMM-Newton data yield temperatures well consistent with each other and significantly different from that obtained with the ROSAT PSPC. The differences in the inferred values of model parameters are attributed to systematic uncertainties in the present calibrations of the X-ray instruments.
4 Timing analysis
Details on results from the timing analysis of the Chandra data can be found in B01, Ransom, Gaensler, & Slane (RanGaeSla02 (2002)) and Drake et al. (Draetal02 (2002)). The 57-ks observation with the XMM-Newton EPIC-pn instrument provided much larger statistics (370,230 counts extracted from a 30″-radius circle centered at the source position) at a 6-ms time resolution. The standard -test (Buccheri et al. Bucetal83 (1983)) run in the Hz frequency range revealed a maximum value , that translates into an upper limit of 1.3% (at a confidence level) on variability of the detected radiation assuming a sine-like signal.
5 Discussion
Pavlov et al. (1996) and Pons et al. (2002) showed that the light element (hydrogen and helium) nonmagnetic NS atmosphere models can be firmly ruled out because they, applied to the X-ray data on RXJ1856, yield (i) too small distance estimates ( pc) and (ii) overpredict the optical flux measured from the source by a factor of . As first demonstrated by B01, no acceptable fit can be obtained with iron and standard solar-mixture atmosphere models (see Zavlin & Pavlov ZavPav02 (2002) for a recent review on the NS atmosphere modeling) at any reasonable values of gravitational redshift parameter (see B01 for a more detailed discussion). In case of the solar-mixture composition, the X-ray data rule out the models with heavy element abundances greater than 0.05%. Fig. 2 (left panels) shows an example of a spectral fit with a NS atmosphere model where heavy elements provide only 0.2% of the total mass density.
As shown in Zavlin & Pavlov (ZavPav02 (2002)), sharp features in the spectra of NS heavy-element atmospheres, primarily spectral lines, may be smeared out by a fast NS rotation at periods as short as a few milliseconds. However, this rotational broadening (the Doppler effect) of the spectral features yet leaves broad-band spectral features in the model spectra at energies around most prominent absorption edges, that make these atmosphere models fail to fit the X-ray data (Pavlov, Zavlin & Sanwal PavZavSan02 (2002); Braje & Romani BraRom02 (2002)).
Another possibility would be to fit the data with NS atmosphere models for strong magnetic fields. However, available magnetized hydrogen models, although not well elaborated yet for such rather low temperatures of interest (see Zavlin & Pavlov ZavPav02 (2002) for discussion), have the same problem as the nonmagnetic case: they overpredict the optical flux. On the other hand, the spectra emitted by magnetized iron atmospheres (Rajagopal, Romani & Miller RajRomMil97 (1997)) show numerous absorption features which should be detectable with the modern instruments of high energy resolution. We note that smearing of spectral features due to line shifts in inhomogeneous magnetic fields (for example, varying by a factor of 2 over the NS surface for a dipole magnetic field configuration) may be expected to wash away narrow-band features, but anyway, should result in broad-band deviations from the blackbody spectrum, similar to the case of a fast rotating NS, as discussed above.
We conclude that the “classic” NS atmosphere models (with assumption of radiative equilibrium) are unable to reproduce the X-ray emission of RXJ1856, which is best fitted by a simple blackbody model (see Fig. 2, right panels). The possibility of a NS atmosphere which is not in radiative equilibrium since its outer layers heated by particle or photon irradiation has been discussed by Gänsicke, Braje & Romani (GaeBraRom02 (2002)). In this case one can produce a spectrum which is close to that of a blackbody. However, this remains a pure speculation until the required source of the additional heating is identified.
An alternative possibility333Originally suggested by G. Pavlov (see B01 for a reference). is to assume a condensed matter surface — liquid or solid — which might result in a virtually featureless Planckian spectrum in the soft X-ray band. Such a situation may occur at low temperatures ( 86 eV) and high magnetic fields ( 1013 G) when hydrogen, if present on the NS surface, is expected to be in the form of polyatomic molecules (Lai & Salpeter LaiSal97 (1997); Lai Lai01 (2001)).
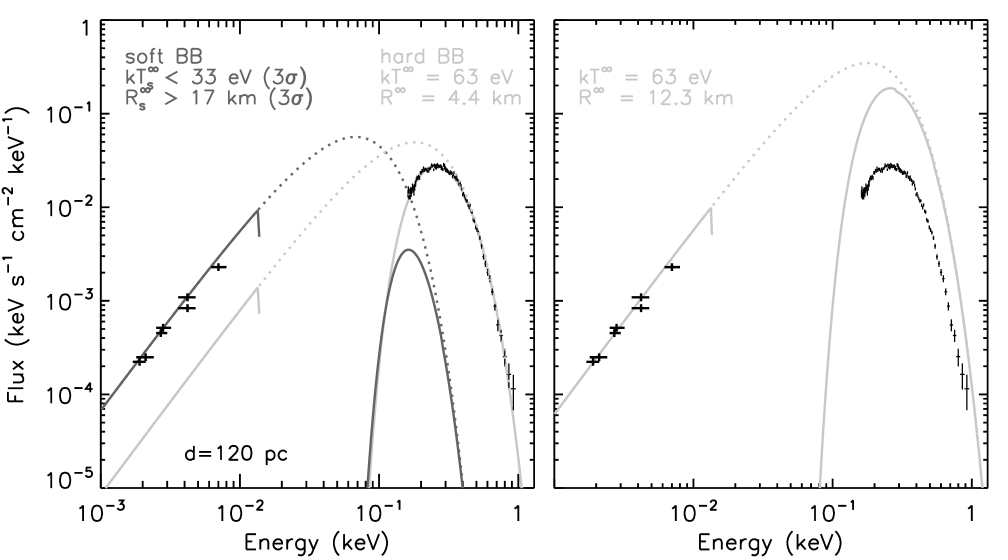
Yet another problem arises from the fact that the parameters derived from X-rays ( = 63 eV and = 4.4 (/120 pc) km) do not fit the optical data obeying the Rayleigh-Jeans law with an intensity about a factor of 7 larger than that given by the continuation of the blackbody model yielded by the X-ray data. This situation has led Pons et al. (Ponetal02 (2002)) to introduce a two-component interpretation: the model applied in the X-ray band is supplemented with an additional soft blackbody component emitted from about 80% of the NS surface and being responsible for the optical emission (c.f. Fig. 3 left). The requirement that the soft component does not contribute in the X-ray band puts an upper limit on the blackbody temperature 33.6 eV (a 3 confidence level), that restricts the stellar radius 16.3 (/120 pc) km (Pavlov, Zavlin & Sanwal PavZavSan02 (2002)). We also note that the spectral shape of the optical blackbody data puts a lower limit on the temperature of the soft component 4 eV and an upper limit on its radius 46 (/120 pc) km.
The non-observed modulation of the X-ray flux imposes severe restrictions on the viewing geometry which has been discussed quantitatively by Braje & Romani (BraRom02 (2002)). Using the previous limits on the pulsed fraction (4%) they found ”the fraction of the sky allowed by pulsed fraction constraints” (which translates into a probability of a given orientation of the rotational and viewing axes) of 2-4% for a NS radius of 16 km. The new limit established with XMM-Newton on the pulsed fraction reduces the allowed sky fraction to even smaller values (around 1%). Alternatively, RXJ1856 could rotate with a short period of a few milliseconds (the available X-ray data do not provide sufficient time resolution for seaching periodic signals at these time scales). But this seems unlikely in view of the NS age of Myr implied by its rather low surface temperature and the inferred distance from its birth place (Walter & Lattimer WalLat02 (2002)).
6 Alternative models
The absence of periodic variations and spectral features in the observed radiation imposes very stringent constraints on any model. The simplest way to produce a time constant flux would be to assume a uniform temperature distribution across the stellar surface. For a temperature of = 63 eV the measured optical spectrum requires a blackbody radius 12.3 km. Consequently, the X-ray emissivity has to be below that of a blackbody by a substantial factor. Using the parameters derived from the Chandra data (c.f. Fig. 3 right) we find this factor to be about 0.15 (it can be about 0.45 if one adopts the parameters given by the ROSAT data). This would mean that the radiating surface should have a high reflectivity as may be expected for a condensed matter surface (Lenzen & Trümper LenTru78 (1978); Brinkmann Bri80 (1980)). In this case the spectrum may be represented by a dependence ( is the Planck function), where is the absorption factor (, with being the reflection factor), which in the general case will be energy-dependent (Brinkmann 1980). We have tested this hypothesis by fitting theChandra LETGS spectrum with a Planckian multiplied by an energy dependent absorption factor = where is the photon energy. It turns out that the best fit yields , eV, and = (5.1 0.3) 1019 cm-2. This indicates that at a 4 level we find find deviations from a Planckian spectrum which may result from an energy dependent absorption factor. In this case the radius required from the optical spectrum is 13.3 km, where 1 is the absorption factor of the surface in the optical domain.
In conclusion, the two versions of our one-component model yield radii of km and 13.3 km, respectively. These are lower limits as the absorption factor may be smaller than unity in the optical band. We note that the observed radii correspond to true NS radii of 9.1 km and 10.3 km (for a NS mass of ), respectively, which are consistent with a soft equation of state. But, of course, the possible range of parameters allows stiff equations of state as well.
Two main conditions have to be fulfilled to make this model work. Firstly, the NS has to have a condensed matter surface, which requires a low temperature and a strong magnetic field. The former seems to be fulfilled in this case: with a temperature of eV RXJ1856 is the coldest one of all detected isolated NSs. But its magnetic field is still unknown. The second condition is that the condensed matter surface really exhibits the required high reflectivity () in the X-ray domain. It remains to be seen whether a detailed analysis of the optical properties of magnetically condensed matter substantiates this hypothesis.
Note added in Proof: Turolla, Zane & Drake (2002) have submitted a paper to ApJ in which they treat the emissivity of a condensed matter surface from a theoretical point of view, using the method of Brinkman (Bri80 (1980)).
Acknowledgements.
The XMM-Newton and the Chandra LETG projects are supported by the Bundesministerium für Bildung und Forschung/Deutsches Zentrum für Luft- und Raumfahrt (BMBF/DLR) and the Max-Planck Society. We would also like to thank the anonymous referee for contructive comments.References
- (1) Braje, T., M., Romani, R. W., 2002, ApJ, in press (astro-ph/0208069)
- (2) Buccheri, R., Bennett, K., Bignami, G. F., et al., 1983, A&A 128, 245
- (3) Brinkman, W., 1980, A&A 82, 352
- (4) Burwitz, V., Zavlin, V. E., Neuhäuser, R., Predehl, P., Trümper, J. Brinkman, A. C., 2001, A&A 379, L35 [B01]
- (5) Drake, J. J., Marshall, H. L., Dreizler, S., Freeman, P. E., Fruscione, A., et al. 2002, ApJ 572, 996
- (6) Gänsicke, B. T., Braje, T. M., Romani, R. W., 2002, A&A 386, 1001
- (7) Kaplan, D. L., van Kerkwijk, M. H., Anderson, J. 2002, ApJ 571, 447
- (8) Lai, D., Salpeter, E. E., 1997, ApJ 491, 270
- (9) Lai, D., 2001, Rev. of Mod. Phys. 73, 629
- (10) Lenzen, R., Trümper, J., 1978, Nature 271, 216
- (11) Neuhäuser, R., Thomas, H.-C., Danner, R., Peschke, S., Walter, F. M., 1997, A&A 318, L43
- (12) Neuhäuser, R., Thomas, H.-C., Walter, F. M., 1998, The Messenger 92, 27
- (13) Neuhäuser, R., 2001, AN 322, 3J18563
- (14) Pavlov, G. G., Zavlin, V. E., Trümper, J., Neuhäuser, R., 1996, ApJ 472, L33
- (15) Pavlov, G. G., Zavlin, V. E., Sanwal, D., 2002, in Neutron Stars and Supernova Remnants, Eds. Becker, W., Lesch, H., Trümper, J., MPE Report 278, 273 (astro-ph/0206024)
- (16) Pons, J. A., Walter, F. M., Lattimer, J. M., Prakash, M., Neuhäuser, R., An, P., 2002, ApJ 564, 981
- (17) Rajagopal, M., Romani, R. W., Miller, M. C., 1997, ApJ 479, 347
- (18) Ransom, S. M., Gaensler, B. M., Slane, P. O. 2002, ApJ 570, L78
- (19) van Kerkwijk, M. H., Kulkarni, S. R. 2001, A&A 378, 986
- (20) Walter, F. M., Wolk, S. J., Neuhäuser, R., 1996, Nature 379, 233
- (21) Walter, F. M., Matthews, L. D., 1997, Nature 389, 358
- (22) Walter, F. M., 2001, ApJ 549, 433
- (23) Walter, F. M., Lattimer, J. 2002, ApJ 576, L145
- (24) Zampieri, L., Campana, S., Turolla, R., Chieregato, M., Falomo, R., et al. 2001, A&A 378, L5
- (25) Zavlin, V. E., Pavlov, G. G., 2002, in Neutron Stars and Supernova Remnants, Eds. Becker, W., Lesch, H., Trümper, J., MPE Report 278, p. 261 (astro-ph/0206025)