00 \Year0000 \Month00 \Pagespan000000 \lhead[0]Grindlay,J. et al: Chandra Multi-wavelength Plane (ChaMPlane) Survey: Design and Initial Results \rhead[Astron. Nachr./AN XXX (200X) X]0 \headnoteAstron. Nachr./AN 32X (200X) X, XXX–XXX
2Department of Astronomy, Indiana University, Swain Hall West, Bloomington, IN 47405
3Department of Physics and Astronomy, San Francisco State University, San Francisco, CA 94132
Chandra Multi-wavelength Plane (ChaMPlane) Survey: Design and Initial Results
Abstract
The Chandra Multiwavength Plane (ChaMPlane) Survey of the galactic plane incorporates serendipitous sources from selected Chandra pointings in or near the galactic plane (12∘; 20 ksec; lack of bright diffuse or point sources) to measure or constrain the luminosity function of low-luminosity accretion sources in the Galaxy. The primary goal is to detect and identify accreting white dwarfs (cataclysmic variables, with space density still uncertain by a factor of 10-100), neutron stars and black holes (quiescent low mass X-ray binaries) to constrain their space densities and thus origin and evolution. Secondary objectives are to identify Be stars in high mass X-ray binaries and constrain their space densities, and to survey the H-R diagram for stellar coronal sources. A parallel optical imaging under the NOAO Long Term Survey program provides deep optical images using the Mosaic imager on the CTIO and KPNO 4-m telescopes. The 36′ 36′ optical images (H, R, V and I) cover 5 the area of each enclosed Chandra ACIS FOV, providing an extended survey of emission line objects for comparison with Chandra. Spectroscopic followup of optical counterparts is then conducted, thus far with WIYN and Magellan. The X-ray preliminary results from both the Chandra and optical surveys will be presented, including logN-logS vs. galactic position (l,b) and optical idenifications.
keywords:
X-ray sources – galactic surveys – X-ray binaries – white dwarfs, neutron stars, black holesjosh@cfa.harvard.edu
1 Introduction and Objectives
The remarkable angular resolution of the Chandra X-ray Observatory enables the first high sensitivity survey of low luminosity accretion sources in the Galaxy for which optical identifications, and thus source content, can be reasonably expected. The arcsec source positions allow relatively unambiguous optical (and IR) identifications even in the most crowded galactic fields (not including dense clusters), and the point source sensitivity for sources within 4′ of the field center allows sources with power law spectra (with photon index = 1.7, as expected for both low- and high-mass X-ray binaries) to be detected at galactic bulge distances (8 kpc) with “hard” X-ray luminosities (2–8keV) 21031 erg/s. This, in turn, enables the detection of the bright-half of the luminosity distribution for accreting white dwarfs (CVs), nearly the full distribution (as presently known) of qLMXBs containing either neutron stars (NSs) or black holes (BHs), and the full distribution (again, as known) of accreting high mass X-ray binaries (HMXBs) such as the accreting Be binary systems. This capability allows a major advance in previous galactic surveys, which most recently have been conducted with the ROSAT all sky survey (Voges et al 1993) and the Einstein galactic plane survey (Hertz, Bailyn, Grindlay et al 1990). XMM is of course also now able to contribute in a major way to the study of faint galactic X-ray source populations, and preliminary results have been reported by Motch et al (2002) and Warwick (these proceedings).
We have initiated the Chandra Multiwavelength Plane (ChaMPlane) survey to probe the luminosity functions and space density of cataclysmic variables (CVs) and quiescent low mass X-ray binaries (qLMXBs) containing either neutron stars (NSs) or black holes (BHs). Detecting CVs on galactic scales would constrain the origin (are they all from primordial binaries?) and evolution (which ones produce SNIa’s?) of these most common accretion-powered sources. The qLMXBs, in turn, are the reservoir of even more exotic binary evolution processes leading, alternatively, to the millisecond pulsars and the largest known samples of stellar mass black holes. Secondary objectives for ChaMPlane include measuring and mapping the other major reservoir of accreting binaries, the Be systems with NS (and possibly BH) companions; and the search for isolated BHs accreting from giant molecular clouds. Finally, ChaMPlane will acquire perhaps the largest sample of identified stellar coronal sources and enable measurements or limits of X-ray activity of stars across the H-R diagram.
2 Survey Design and Expectations
The X-ray survey is derived from serendipitous sources detected in Chandra observations of galactic fields with nominal exposure times 20–30ksec, galactic latitude 12∘, and lack of bright sources, or extended emission in the field which would reduce sensitivity. The observations are restricted to those taken with the ACIS-I or -S instruments on Chandra to allow for spectral coverage to harder energies (important for the often-absorbed galactic fields) and at least hardness ratio (X-ray colors) if not actual spectral analysis. In order to achieve significant coverage of regions of the galactic plane and to acquire significant samples, the original proposed goal was to obtain 100 Chandra fields. Given the rate at which “clean” galactic fields are being observed with Chandra, this is expected to take 5 years to acquire. The X-ray data processing is done with the same XPIPE scripts as developed (Kim et al 2003) for the high latitude ChaMP survey. Thus far data have been processed for some 40 fields (of which 15 are reported here) in the same 3 bands as for ChaMP (cf. Fig. 3 below) for analysis of X-ray fluxes and colors.
A parallel deep optical imaging survey is being conducted with the CTIO and KPNO 4m telescopes and large field (36′) Mosaic cameras under the NOAO Long Term Surveys Program (see Zhao et al, these proceedings). This provides the required deep optical image for initial source identification (and followup spectroscopy) but is also designed to do an initial selection for likely accretion-powered objects by imaging in H vs. R to look for “blue” objects in the (H–R) vs. R color magnitude diagram, given that H is a (nearly) ubiquitous feature of accretion disks or flows. To provide additional constraints on the possible counterpart’s spectral type and reddening (particularly if followup spectra are not possible), additional images in V and I are acquired so that a (V-R) vs. (R-I) plane can be constructed. Unfortunately the reddening vector is relatively closely aligned with the main sequence in this color system so that photometric classifications are relatively coarse if relative or differential reddening is not known. The red filter system (V,R,I) is itself chosen to minimize extinction and to provide the comparison R band for H. Total exposure times in H, R, V and I are 2.5h, 0.5h, 0.3h and 0.3h, respectively, to reach 5% photometry at R24 (10% in H) which allows a threshold of EW(H) 15Å for the 80Å wide H filter in the Mosaic cameras. Photometry has now been obtained on 24 fields, or 1/4 the desired total.
The CV space density has been estimated recently to be 10-5 pc-3 (Patterson 1998) but this is still uncertain by an order of magnitude (either way) and is largely based on both optical and X-ray surveys typically within 1kpc. The galactic distribution is essentially unknown but could be probed by ChaMPlane, for the brighter CVs, out to the galactic bulge. For a likely CV scale height of 200pc (e.g. Schwope et al 2002), the predicted total number interior to the Sun is 4105. The local CV space density extrapolated to the galactic center would suggest a total ChaMPlane-CV “column” of 20, of which perhaps 3–5 might be detected given and luminosity distributions. The likely much larger population of “quiescent” CVs (with probable 1030 erg/s) suggested by Howell, Rappaport and Politano (1997) and Townsley and Bildsten (2002) could be detected to 1-3kpc and contribute a comparable total.
The qLMXB estimates are based on millisecond pulsar surveys and soft X-ray transients for the NS and BH systems, respectively, with uncertainties due to both source evolution and duty cycles. The total population interior to the solar circle is probably 100 below the CV numbers, yielding perhaps 0.1–1 per ChaMPlane field, but again the uncertainties are large. Similar totals, or perhaps larger, obtain for estimates of the Be binary populations expected. The above estimates suggest that ChaMPlane could double (at least) the total numbers of accretion-powered X-ray binaries when identifications are completed with our followup spectroscopy. Expected numbers of previously unrecognized objects, such as isolated 10 BHs accreting from GMCs, are much more difficult to predict (Agol and Kamionkowski 2002) and will likely require IR photometry and spectroscopy. An important discriminant throughout between compact objects and coronal stars is the hard X-ray spectrum (2–3 keV) expected from accreting compact objects but not (except in flaring) stars.
3 Initial X-ray Results
In Figure 1 we show the galactic distribution of the first sample of 15 ChaMPlane fields analyzed.

We first derive logN-logS, the integral
number-flux counts, for comparison with other galactic and high
latitude surveys.
For initial analysis, sources selected from within the central 4′ of the Chandra field center (to minimize off-axis
degradation of point spread function and sensitivity) and
with at least 10cts in the broad band (0.3–8keV).
For each field, we derive the corresponding flux for
this detection limit and accumulate the effective sky areal
coverage as a function of flux limit. Source counts detected
are converted to flux assuming a power law spectrum ( =
1.7), appropriate for CVs, qLMXBs or AGN, and are
corrected for absorption by the nominal for that field.
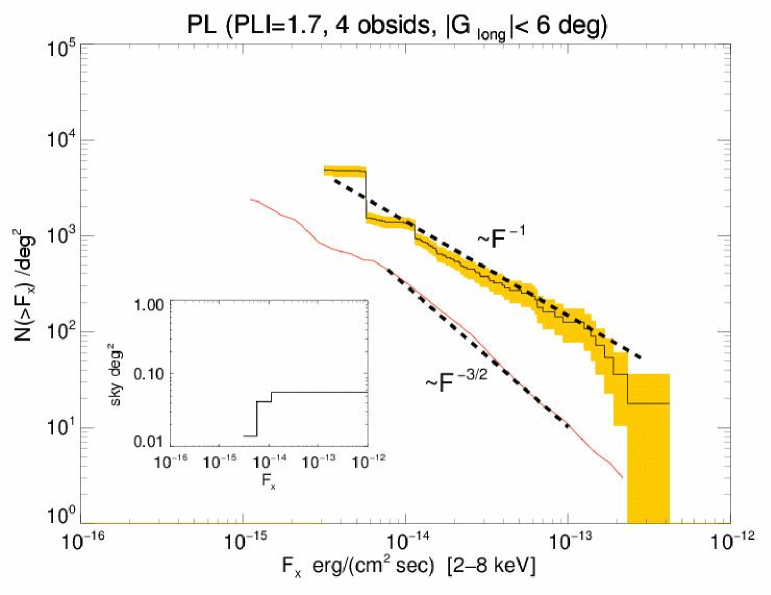
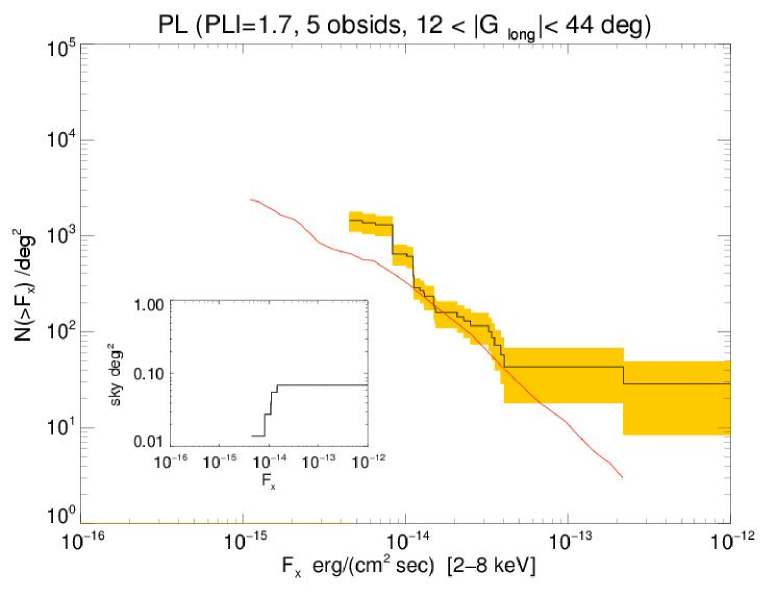
Results are shown in Figure 2 for two cuts on galactic
longitude for the 9 fields with .
The excess sources in the galactic bulge are distributed with
-1 slope appropriate to a disk distribution vs. the -3/2 slope
over the same flux range exhibited by the AGN counts from
ChaMP (Green et al, these proceedings), plotted as the
lower curve in both figures and dashed line
(top figure), which connects the Chandra Deep
Field North and brighter flux ASCA counts. The galactic
source population is at least a factor of 3-5 over the AGN
counts and is unlikely to be due to enhanced stars in the
bulge since these would be expected to be predominantly
soft sources (though pre-main sequence stars
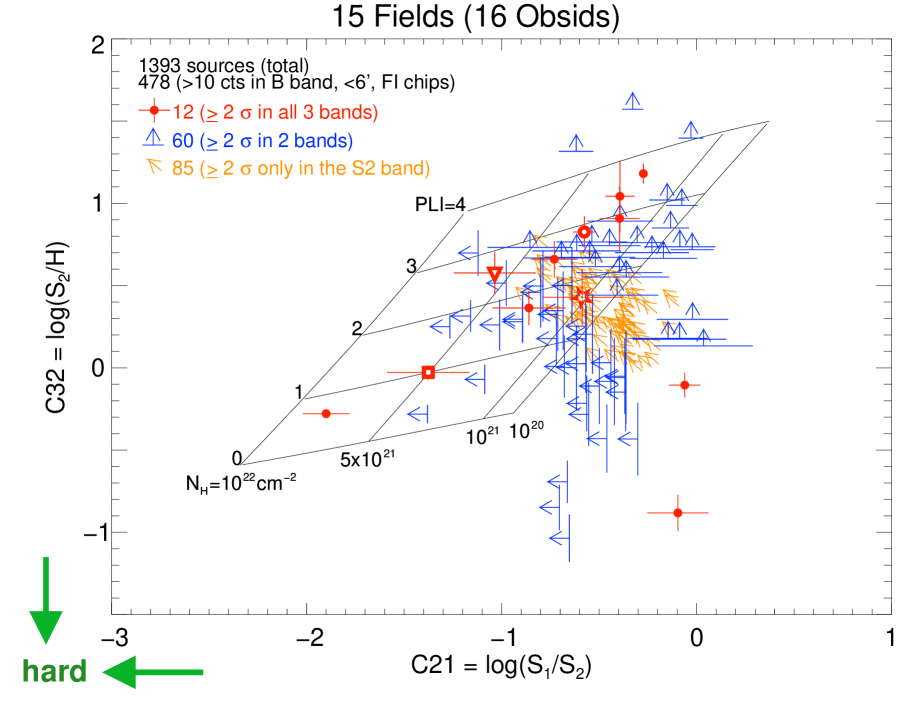
may contribute). The X-ray colors and limits plotted in Figure 3 show
that most of these bulge sources are
consistent with hard and absorbed spectra
as expected for accretion sources.
The two points at lower right may be sources with both
soft and hard spectral components, such as found in
magnetic CVs, and would be foreground sources.
4 Initial Optical Results
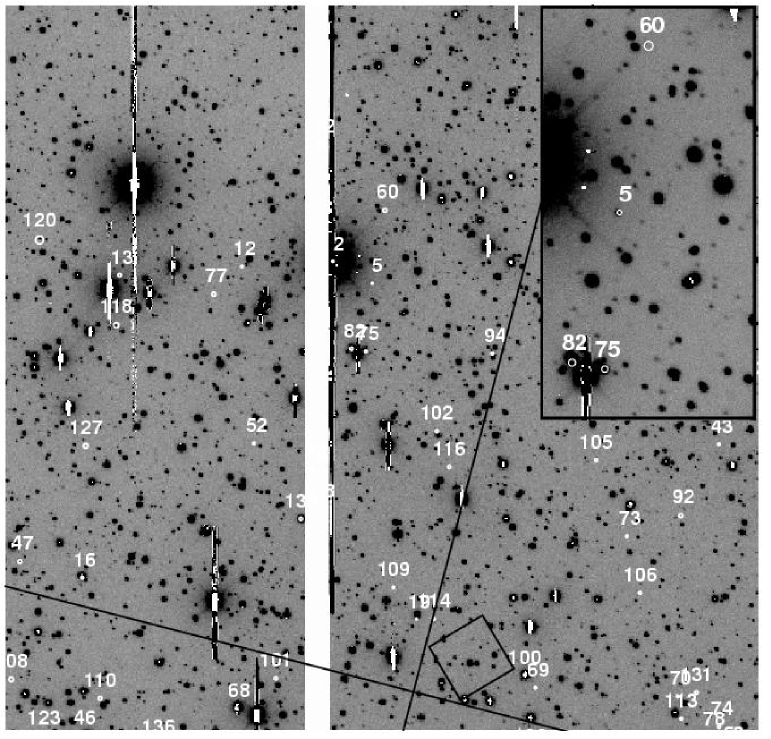
In Fig. 4 we show the partial R image for the Galactic Center Arc field (Mosaic; showing a chip gap) with ACIS-I chip overlay (black lines) and central pointing position (diamond) together with Chandra sources (numbers) and their 2 error circles. The image shows both that about half of the sources have optical IDs in this image (to R23) for which the reddening is large (log() 22.1). The (H-R) vs. R color magnitude diagram for this field (Fig. 5) shows that two Chandra sources are significant H objects.
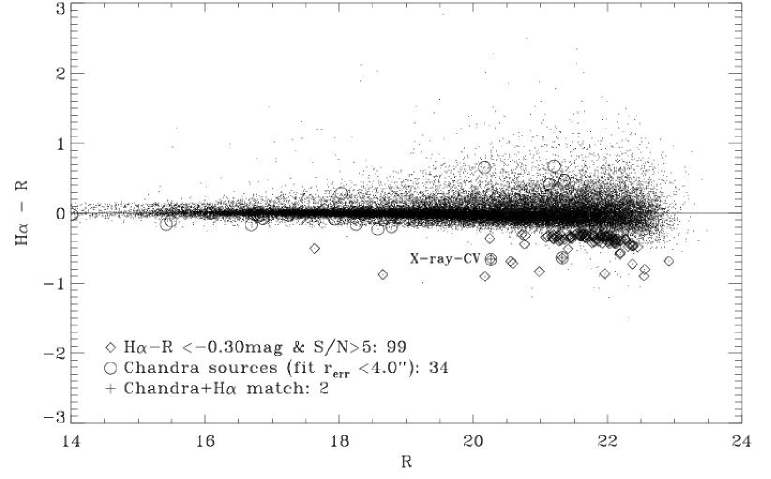
The R 20.2 object labelled X-ray CV is source #5 in Fig. 4 and enlarged in the inset in upper right corner: the 0.6 radius circle shows the excellent positional astrometry, while #60 shows a typical blank field (R 23.5) source. Source 5 is confirmed as an emission line object and probable CV in our Magellan spectrum shown in Fig. 6.

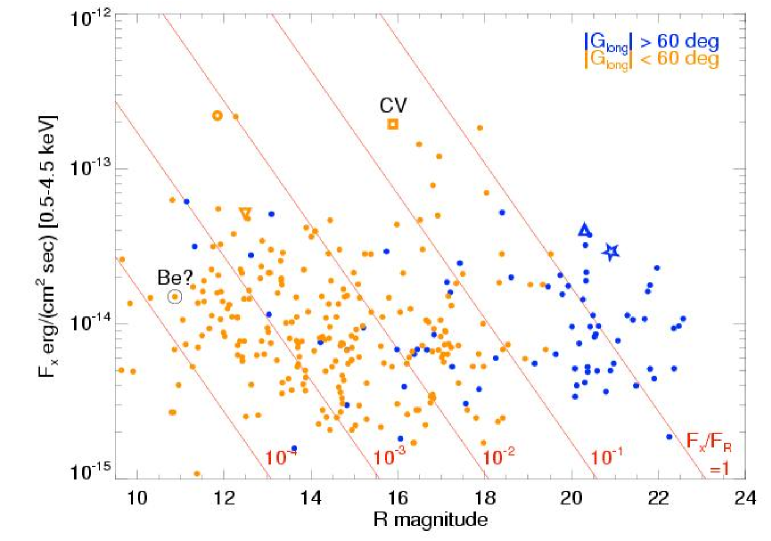
The spectrum shows Balmer line emission broadend beyond the instrumental resolution as well as weak HeI emission suggesting a reddened dwarf nova. Its X-ray/optical flux ratio is / 0.2 and is plotted vs. R in Fig. 7 as the square symbol along with values for the 300 sources identified in these 15 fields. In Fig. 3 it is consistent with a foreground CV with log() 21 and photon index 1 (or a brems spectrum). The point labelled Be? is a second spectroscopically confirmed counterpart: a probable Be HMXB system. Its relatively large value of / 0.002 suggests it is an accretion-powered source, probably containing a neutron star. The fact that the bulge sources have systematically lower / values than the anti-center sources is likely due to differential reddening: both and values were “de-absorbed” by the full in each field. The plotted R 10 magnitudes were actually observed as R 14.
5 Conclusions
ChaMPlane has found dramatic evidence for a new population of low luminosity hard X-ray sources (HXs) in the central galactic bulge. Young stellar objects, found as HXs in SgrB2 by Takagi et al (2002), may not be numerous enough but models and stellar population studies (e.g. van Loon et al 2002) are needed. The source counts at 12∘ 44∘ show a flattened disk component at 10-13 cgs that is consistent with the point source population at 21∘ found by Motch et al (2002). However this “bright” galactic disk distribution is exceeded by the steeper AGN counts at fluxes 10-13.5 cgs, only to be exceeded by the still larger normalization disk population in the central bulge. This may resolve the discrepancy between the claims for AGN dominating the faint ( cgs) galactic source distribution at = 28.5∘ (Ebisawa et al 2001) vs. an excess in the lower-sensitivity wide-field galactic center survey (Wang et al 2002). ChaMPlane will map out this distribution, and our upcoming deep pointing on Baades Window with Chandra and HST may reveal the nature of this bulge population.
Acknowledgements.
We thank ChaMP colleagues for assistance, D. Hoard, S. Wachter and T. Abbott for help at CTIO, and the NOAO Surveys and Magellan staff for support. We acknowledge Chandra grants AR1-2001X, AR2-3002A and NSF grant AST-0098683.References
- [1] Agol, E. and Kamionkowski, M. 2002, MNRAS, 334, 553
- [2] Ebisawa K. et al 2001, Science, 293, 1633
- [3] Hertz, P., Bailyn, C. & Grindlay, J. et al 1990, ApJ, 364,251
- [4] Howell, S. et al 1997, MNRAS, 287, 929
- [5] Kim, D-W. et al 2003, in preparation
- [6] Motch, C. et al 2002, astro-ph/0203025
- [7] Patterson, J. 1998, PASP, 110, 1132
- [8] Schwope, A.D. et al, astro-ph/0210059
- [9] Takagi, S., Murakami, H. & Koyama, K. 2002, ApJ, 573, 275
- [10] Townsley, D. and Bildsten, L. 2002, ApJ, 565, 35
- [11] Van Loon, J. et al, astro-ph/0210073
- [12] Voges, W. et al 1993, Adv. Sp. Res., vol. 13, no. 12, 391
- [13] Wang, Q.D., Gotthelf, E.V. and Lang, C.C. 2002, Nature, 415, 148