Studying Infall
Abstract
The study of protostellar collapse or infall has proven unusually difficult and controversial. Some historical context will be provided, against which recent advances can be measured. We now have a substantial number of objects with signatures that can be interpreted in terms of collapse, but a number of issues remain. One issue is the effect of chemical variations, especially depletion in the dense, cold interiors of cores that are likely to form low mass stars. Strategies for dealing with this issue depend on using dust emission to constrain the density and temperature distribution, leaving molecular line observations to constrain dynamics and abundance distributions. Recent progress in this area will be described and we will consider the next challenges to be overcome. Interferometeric observations, especially with future instruments, will provide a powerful tool. In combination with chemical studies coupled with dynamical models, the observations made possible by interferometers should finally put this subject on a firm foundation.
keywords:
ISM: molecules – Stars: formation1 Introduction
While gravitational collapse is the accepted explanation for star formation, the observational evidence for it is very scarce. Establishing this picture observationally is a strong reason for studying infall. This subject has long been controversial (cf. Goldreich & Kwan 1974 and Zuckerman & Evans 1974), and the burden of proof has rested heavily on those who interpret observations in terms of collapse. While it will always be difficult to rule out other explanations for observational signatures of collapse, the collapse interpretation is beginning to benefit from the principle of simplicity: other explanations are becoming increasingly contrived.
If we can establish the basic picture, we can move on to testing particular theories for how the collapse proceeds. There are many theoretical models that differ in their predictions of the density and velocity fields. In principle, these predictions may be subject to observational tests. As an example, collapse according to the Larson-Penston similarity solution (Larson 1969; Penston 1969) produces much wider linewidths than inside-out collapse from a singular isothermal sphere (Shu 1977). The line profiles expected for the Larson-Penston solution do not match data from regions forming low mass stars (Zhou 1992) but may find application in regions forming massive stars.
Finally, observational constraints on the dynamics will provide an alternative way to assess the timescales for star formation. At present, these are determined only by statistical arguments based on the number of objects in different observational classes, assumed to be an evolutionary sequence. This method is subject to a number of uncertainties, including selection biases and the possible importance of factors other than age, such as environment, etc. For example, the usual view is that protostars spend yr in the Class 0 phase and yr in the Class I phase. The former number is based on the fact that the Ophiuchus cloud has ten times as many Class I objects as Class 0 objects (André & Montmerle 1994). However, Visser, Richer, & Chandler (2001, 2002) have found as many Class 0 objects as Class I objects in a recent survey of other regions, implying a timescale for the Class 0 stage that is 10 times longer than usually assumed. Direct observation of infall speeds in various objects would provide an independent estimate of timescales.
The topic of infall has been reviewed by Zhou & Evans (1994), Myers (1997), Zhou (1999), Evans (1999), and Myers, Evans, & Ohashi (2000). In this paper, I intend mostly to update those reviews, but I will begin with some background.
2 Dark Ages and Renaissance
Partly because of the historical controversy referred to above, the study of collapse suffered through the “dark ages” from the mid-1970s to the mid-1990s. During this period, every claim to find evidence for collapse was followed by counter-claims with alternative explanations [cf. Goldreich & Kwan (1974), Liszt et al. (1974) vs. Zuckerman & Evans (1974); Snell & Loren (1977) vs. Leung & Brown (1977); Walker et al. (1986) vs. Mundy, Myers, & Wilking (1986) and Menten et al. (1987)]. For further historical discussion and references, see Evans (1991) and Myers et al. (2000). The net effect of all this contention was to make the study of infall seem disreputable.
In addition to sociological factors, physical factors have made the field difficult. Collapse motions tend to be small compared to other motions and hence easily obscured. A rough estimate of the infall speed is given by the following:
| (1) |
Thus, for low-mass stars, one needs to probe small radii to see substantial infall motion. Other motions are often substantially larger. For a sample of low-mass cores, Caselli & Myers (1995) found that the non-thermal (turbulent) contribution to the linewidth (FWHM) could be fitted by the following relation:
| (2) |
While this relation does not necessarily apply to the linewidth as a function of radius for a given region (see Goodman et al. 1998), there is some evidence that turbulent linewidths are less at small radii on average. Thus improved resolution is an obvious route to improve the detectability of infall. However, the decreases in linewidth will be limited as thermal broadening takes over. The minimum possible linewidth (aside from narrowing by maser emission) is
| (3) |
where is the gas kinetic temperature and is the mass of the species whose line is being observed. Based on this equation, one would gain by observing heavier molecules, but purely thermal broadening is not usually seen in heavier molecules. In fact, turbulence often persists at the subsonic level even on small scales. The sonic linewidth is
| (4) |
where is the mean mass per particle. In some very quiescent clouds, the turbulence is considerably less than this value.
In addition, rotational motions will increase as regions closer to the forming star are probed. If angular momentum is conserved,
| (5) |
Ohashi et al. (1997) found that angular momentum appears to be conserved inside about 6000 AU. On much smaller scales, where the circumstellar disk forms, angular momentum will be redistributed, but the rotational velocity does appear to increase with decreasing radius in the infall region.
Finally, and worst, outflows seem to begin very soon after a central source has formed, and they are very energetic at early times. These move matter at velocities ranging up to a few times 100 km s-1 in the wind and a few times 10 km s-1 in the molecular outflow. Most troubling for the study of infall is the low velocity motion of dense gas very near the base of the outflow. These motions can easily obscure or confuse infall signatures.
The renaissance in the study of infall can be traced to four developments. First, the discovery of objects in very early stages provided more fertile grounds for infall studies. Presaged by extensive surveys for dense gas in nearby dark clouds by Myers and colleagues (e.g., Myers, Linke & Benson 1983), the identification of Class 0 objects by André et al. (1993) and Class objects (also called Pre-Protostellar Cores or PPCs) by Ward-Thompson et al. (1994) was a crucial development. Second, simple models for the density and velocity fields during collapse were presented by Shu (1977), but the idea of inside-out collapse from an initial, singular isothermal sphere really came to prominence after the seminal review article by Shu, Adams, &Lizano (1987). Third, Zhou (1992) converted the theoretical models of both the inside-out collapse and the Larson-Penston solution into simulated line profiles as a function of time, clarifying the characteristic line shapes expected for collapse. Finally, a credible example of collapse was found in the small globule B335 (Zhou et al. 1993).
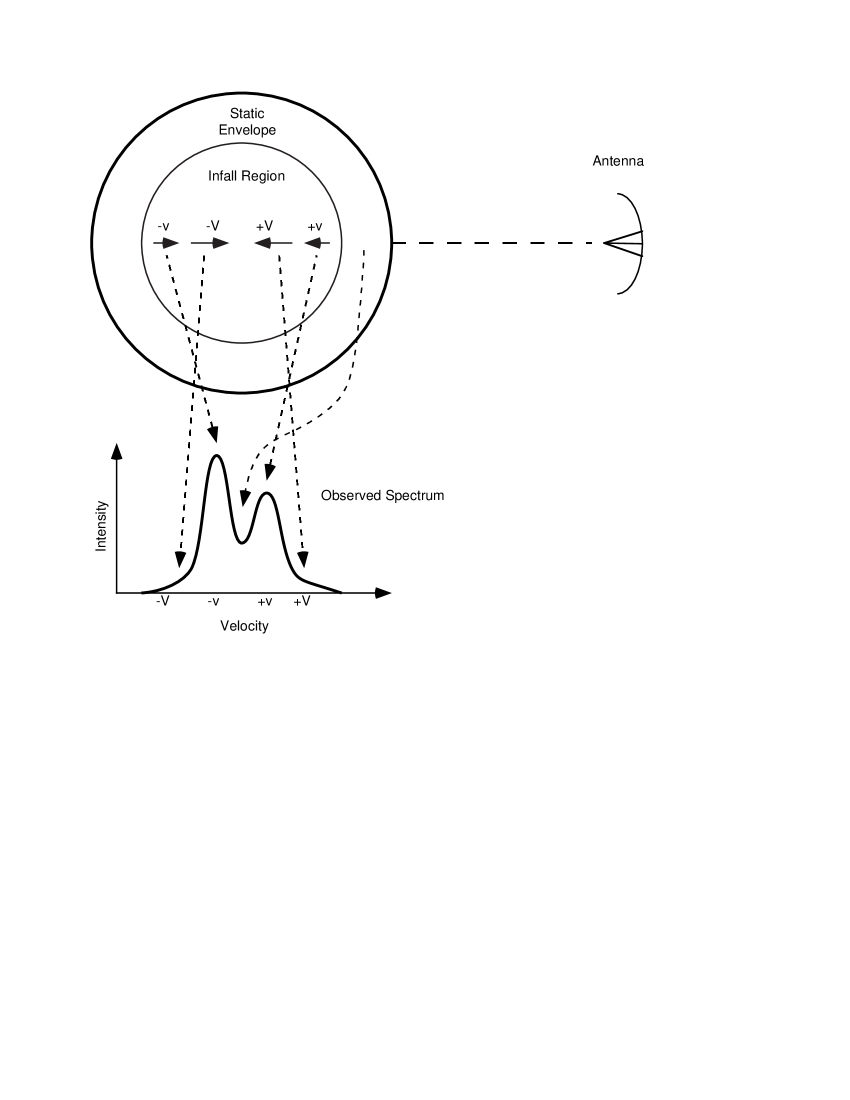
The key signature of infall is a line profile that ideally is double-peaked with a central self-absorption dip, with the blue peak being stronger than the red peak (Leung & Brown 1977, Zhou 1992, Myers et al. 1996). Cartoons that demonstrate why this signature arises can be found in Figs. 1 and 2. This signature will appear only if the line has a suitable optical depth and critical density. Observations of an optically thin line that peaks near the velocity of the self-absorption dip are necessary to rule out two separate velocity components. Some optically thick lines will not show a self-absorption dip, but will show a blue-skewed profile. The latter are referred to by Myers et al. (1996) as “red-shoulder” profiles, but they are the same as the “blue-skewed” profiles. For simplicity, I will refer to either of these as “blue profiles.”

The full double-peaked signature was seen clearly in several lines toward B335 by Zhou et al. (1993) and modeled in more detail by Choi et al. (1995). While some issues have arisen later regarding B335 (§4), it was credible enough to return some respectability to the field, and it led to the next development.
3 Surveys for Infall Signatures
One example is insufficient to verify a theory for low-mass star formation, so a number of surveys began for blue profiles. These initially used the molecular tracers that showed blue profiles in B335, CS and H2CO. Various lines were used for the optically thin tracer. In a survey of 12 globules, similar to B335, Wang et al. (1995) found 3 blue profiles using H2CO as the optically thick tracer. Mardones et al. (1997) surveyed a large number of Class 0 and I sources, finding 14 out of 37 blue profiles in CS and 15 out of 47 in H2CO. Most surprisingly, Lee et al. (1999) found blue profiles in 17/70 starless cores, using CS. In the inside-out picture, a central luminous object forms almost as soon as collapse begins, so a phase with collapse and no central luminosity would be very rare.
Meanwhile, it turned out that HCO+ showed even deeper self reversals (Fig. 3) than CS and H2CO toward B335, and searches commenced using HCO+ as the optically thick line and H13CO+ as the optically thin line. Gregersen et al. (1997) found blue profiles toward 6 out of 18 Class 0 sources. Because the study by Mardones et al. (1997) using CS and H2CO had found fewer blue profiles among the Class I sources than among Class 0 sources, it was important to put the Class 0/I searches on a common footing. A study of Class I sources by Gregersen et al. (2000) found blue profiles in 8 out of 16 Class I sources and Gregersen & Evans (2000, 2001) found blue profiles in 6 of 17 Class cores (starless cores with submillimeter emission). Clearly the phenomenon of blue profiles was widespread, but far from universal. Worse yet, some lines showed red profiles!

To quantify the results, Mardones et al. (1997) introduced the excess: , where and are the number of blue and red profiles in the total sample of objects. A line was counted as blue if the peak of the optically thick line was shifted blueward of the peak of the optically thin line by a quarter of the linewidth of the optically thin line: . Similarly, a red line would have . The excess should be zero on average if the skewing of line profiles were caused by random outflow blobs or other effects without some overall inward motion.
The surveys did reveal positive excesses, suggesting a systematic tendency toward inward motions. One question that arose was whether there was any tendency for the excess to vary with time. In some pictures, the main infall occurs during the Class 0 stage, with much less infall occurring during the Class I stage (e.g., André et al. 2000). Studies with CS and H2CO did find a lower value of among Class I sources (Mardones et al. 1997), but studies with HCO+ found the same in Class I sources as in Class 0 sources (Gregersen et al. 2000). Because HCO+ is more opaque than CS or H2CO, it may be that it was better able to reveal infall at later stages when less material remains in the envelope. Using HCO+, a surprisingly large excess was found for Class cores by Gregersen & Evans (2000), but the sample was very small. The value in Table 1 is based on counting only that are less than by at least one ; if all those with are counted, .
Another approach taken with surveys is to ask if different tracers agree. Gregersen et al. (2000) assembled a table of 40 sources, most with data in CS, H2CO, HCO+, and HCN. There were some cases in which the tracers disagreed, but considerably more in which they agreed. In quite a few cases, the HCO+ showed blue profiles, while the others showed no asymmetry. Gregersen et al. (2000) suggested that the HCO+ remained optically thick enough to develop a blue profile at later stages, when the CS and H2CO were no longer opaque enough. They presented some simple simulations of line profiles to support this suggestion. A better understanding of chemical effects in these regions is needed to put this suggestion on firmer footing.
| Class | 0 | I | |
|---|---|---|---|
| Excess | 0.30 | 0.31 | 0.31 |
4 Complications
While the surveys indicated a substantial excess of blue profiles over red profiles, the presence of red profiles raises a red flag. Without understanding those profiles, how can we be sure what the blue profiles mean? The red profiles are likely to be caused by dense clumps in outflowing gas. Clearly some of the blue profiles could be caused by the same thing. While the statistics suggest that the predominance of blue profiles indicate collapse, a blue profile in an individual core may not be a reliable signature of collapse.
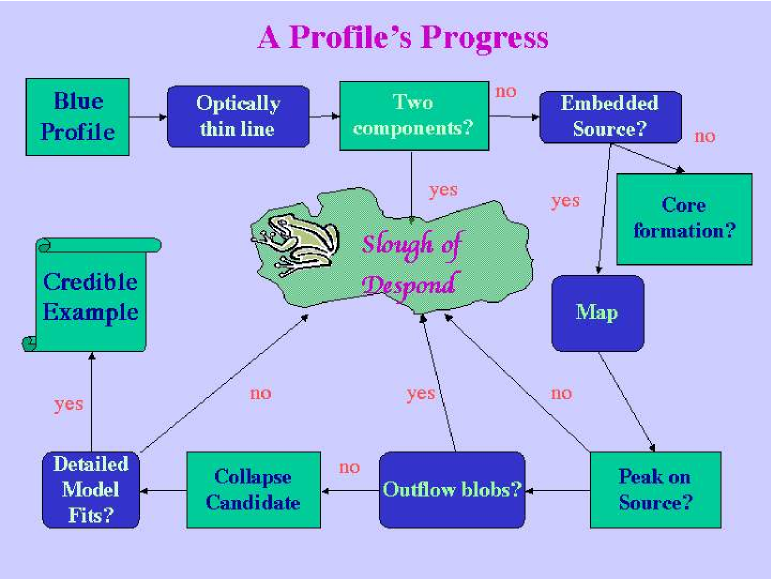
In view of the troubled history, modern students of infall have generally been quite cautious, subjecting a blue profile to a number of tests before describing it as a credible example of collapse. This process reminds me of the classic work of Puritan allegory (Bunyan 1688), so I offer a modern allegory for the “Profile’s Progress” in Fig. 4. A blue profile could just represent the presence of two velocity components, which must be ruled out by observations of an optically thin line that peaks near the dip in the optically thick line, rather than showing two peaks. If there is an embedded source (Class 0 or I), a map of the source should reveal a peak on or near the source; the peak could be in the “blueness,” measured in various ways, or in the depth of the dip. The peak of the blue component need not be on the source if rotation is also present, but a pattern consistent with expectations for rotation should be seen. Now, the hardest test appears; a blue profile must resist the temptation to just be an outflow blob! The profile that passes this test may be considered a candidate for collapse. Agreement with someone’s detailed model is required to achieve the status of a credible example. Opinions differ as to whether any regions have achieved this status.
If no embedded source is known (Class ), the path is slightly different (no outflow to worry about) and is not shown in Figure 4. First, without a source, one has to check instead that some indicator is at least centered on the peak of the submillimeter continuum emission. In these cases, one may be seeing core formation, rather than star formation, and the pattern of blue profiles may be quite extended (e.g., Tafalla et al. 1998). The blue profiles cannot be tracing infall onto a central object, so they must be compared to models of core formation by ambipolar diffusion or turbulent dissipation (e.g., Myers & Lazarian 1998) or to models of collapse before a central object forms (Lee et al. 2003).
Because infall velocities should increase at smaller radii, it seemed that interferometers might provide clearer evidence of infall. Indeed, some studies did look promising (Chandler & Sargent 1993, Zhou et al. 1996, Wilner et al. 1997). However, Choi et al. (1999) found some discrepancies. In particular, the red peak was very weak or even absent in some cases. This was an extreme example of a trend already seen in single-dish data toward higher blue/red peak ratios in the data than predicted by the models (Gregersen et al. 1997). In addition, interferometers can artificially produce what appear to be self-absorption dips by resolved out the extended emission from a static or slowly moving envelope (e.g., Gueth & Guilloteau 1999).
When the CS line was imaged in B335 by Wilner et al. (2000), they found that the line profile, while blue, was narrower than predicted from the best fitting model to the single dish data (Choi et al. 1995). At a minimum, this result suggested lower velocities at small radii than predicted from the inside-out collapse model. Even worse, the map showed that the blue emission was displaced from the infrared source and thus more likely an outflow blob.
Around the same time, it was becoming clear that many molecules can be heavily depleted in the dense, cold regions of Class sources (e.g., Caselli et al. 1999), and that these depletions might affect the line profiles strongly (e.g., Rawlings and Yates 2001) if they persist into the infalling stage.
The detection of blue profiles in many Class cores also called into question the basic model of inside-out collapse, suggesting instead that inward motions of some kind are commonly seen before formation of a central luminosity source. Maps of the lines indicated extended regions of blue profiles, inconsistent with very early stages of an inside-out collapse. (Tafalla et al. 1998; Lee, Myers, & Tafalla 1999, 2001)
All these developments suggested the need for a more robust tracer of the density structure than provided by molecular lines because detailed simulation of the line profiles required models of the density, temperature, velocity, and abundance structure.
5 Using Dust and Gas
While dust emission or absorption provides no direct information on velocities, studies of dust can be quite useful for the infall problem. Studies of dust continuum emission or absorption can constrain the distribution of density and temperature, cutting down the number of free parameters in models of line profiles. Conveniently, several new instruments became available in the late 1990s that revolutionized observations of dust emission. For low-mass, cold regions, SCUBA on the JCMT, operating at 850 and 450 m, and various bolometer arrays on the IRAM 30-m dish have provided many maps of submillimeter or millimeter emission (e.g., Shirley et al. 2000; Ward-Thompson et al. 1999; Visser et al. 2001, 2002).
Studies of cores through absorption (or scattering) by dust are complementary to emission studies. These have a long heritage, but one has to use absorption in the infrared to probe the denser regions. Studies in the near-infrared by Lada et al. (1994) and in the mid-infrared using ISO (Bacmann et al. 2000) are examples of this technique. The use of the mid-infrared will be extended by observations with SIRTF of dense cores (Evans et al. 2002a).
Proper interpretation of the emission data requires knowledge of the dust temperature distribution () because at the low temperatures around low luminosity sources, the dust emission is quite sensitive to temperature. Unlike the case of luminous sources, the emission is not in the Rayleigh-Jeans limit and the is not a power law (Shirley et al. 2000); consequently, convenient analytical approaches are inappropriate. Fortunately, there are publicly available codes to compute self-consistently for a given density distribution, including both internal and external heating (Egan, Leung, & Spagna 1988, Nenkova, Ivezić, & Elitzur 2000).
For line profile modeling, one needs to know , the distribution of gas kinetic temperature. For much of the relevant range of radii, the density is high enough that collisions of molecules with dust grains makes , but in the lower density envelope, a separate energetics calculation is needed to obtain the kinetic temperature. While one might worry that heavy depletion of molecular coolants deep in the interiors might affect , Goldsmith (2001) has shown that the effects are small. Once the density is high enough to affect the coolants significantly, it is high enough to enforce to reasonable accuracy.
The results of models with self-consistent calculations of (Leung 1975, Evans et al. 2001) show that Class cores are very cold in the center ( K) and warmer on the outside ( K if exposed to a typical interstellar radiation field). Density distributions that are constant in the center but approach power laws at large radii, such as Bonnor-Ebert spheres fit the radial intensity profile well (Ward-Thompson, et al. 1999, Evans et al. 2001). The low central decreases the emission from the center, even at millimeter and submillimeter wavelengths. When the lower temperatures in the center are accounted for, the central densities of Class cores with reasonably strong submillimeter emission range from 3 to cm-3 (Evans et al. 2001).
At the very low temperatures and high densities deep in Class cores, substantial depletion of the molecules onto dust grains is expected on relatively short timescales. The observational evidence clearly confirms this expectation (e.g., Rawlings 2000, Caselli 2002 for reviews). Many Class cores are nearly invisible in the usual molecular tracers of column density, such as C18O. Other species that form from less condensible precursors or that profit from the depletion of their primary destroyers follow the dust emission more closely (e.g., Lee et al. 2003). Especially favored are molecules derived from N2, ions, and deuterated species. On these grounds, N2D+ may be the last gaseous molecular tracer still working after the others have chilled out (Caselli et al. 2002).
This depletion makes it very hard to trace the velocity field in the interior, but studies at larger radii show widespread regions of blue profiles, as described earlier. These profiles can be successfully modeled in some cases with a Plummer-like model (Whitworth & Ward-Thompson 2001); in particular, Lee et al. (2003) have fit the HCO+ line profiles toward L1544 at several positions with such a model. The density and temperature distributions of this model are nearly identical to the best fitting Bonnor-Ebert sphere and thus predict dust emission that matches observations, but the Plummer-like model also provides a velocity distribution needed to compare to line profiles. In the case that fits L1544, the inward velocity peaks around 0.015 pc. An alternative approach (Bourke et al. 2002) to the same core treats each molecular transition with a two-layer model; when applied to different molecular transitions, one infers a velocity field larger at smaller radii, qualitatively consistent with the modeling by Lee et al. (2003). The exciting thing about these results is that we are beginning to probe velocity fields in very early stages. These will set timescales and initial conditions for the formation of central objects. However, these are only initial steps and much work remains, even to show that these motions are necessarily related to collapse.
Once a central object forms, the core is heated from the inside as well as the outside, and rises in the core. The submillimeter emission from dust becomes stronger and easier to map. Analysis of a substantial sample of Class 0 and I objects (Shirley et al. 2002; Young et al. 2003) finds that the radial intensity profile of the submillimeter emission is fitted well by power laws in density []. An interesting dichotomy appears: for sources that are nearly spherical, ; for the small number of sources that are quite elongated, typical . While the mean value of is similar to that of the singular isothermal sphere, these objects should have evolved into the inside-out collapse stage, which predicts inside . No sign of a shift to a smaller value of at small radii is apparent in the data from single dishes, which probe AU, in Class 0 sources (Shirley et al. 2002). More surprisingly, most Class I sources also show no sign of a change in outside 2000 AU (Young et al. 2003), even though should be larger in these sources.
For B335, the inside-out collapse model that fits the molecular line data (Choi et al. 1995) does not fit the dust continuum data, which prefer a power law density. Studies of extinction in the near-infrared using HST observations (Harvey et al. 2001) find a power law with in the outer parts of B335, with some evidence for a turnover near the found by Choi et al. (1995). The extinction method runs out of stars inside AU, but recent studies of dust emission with the IRAM interferometer probing scales from 500 to 5000 AU were fitted well by a power law with (Harvey et al. 2002). These results suggest that the inside-out model does reproduce the density distribution, returning the issue to the models of molecular lines.
Combining the constraints from dust continuum emission with those of molecular lines in a single, coherent model is clearly necessary. Hogerheijde & Sandell (2000) demonstrated the power of this technique; they found good fits to models of inside-out collapse for three of four sources. The fourth source, L1489 IRS, was later modeled as a more evolved object with a rotating, contracting disk (Hogerheijde 2001). Such studies are clearly necessary to reduce the large number of free parameters once molecular depletion is considered.
6 The Role of Interferometers
While data from interferometers must be interpreted with care (see discussion in §4), they provide the only probe of the velocity fields on small scales. Choi (2002) has explored some of the systematic effects and simulated line profiles from infall as seen by interferometers such as the SMA. As interferometers acquire more antennae, their imaging fidelity will improve, but it will remain important to account for extended emission.
In addition to looking for infall signatures in optically thick lines, interferometers have been used to probe velocity fields in optically thinner tracers (e.g., Ohashi et al. 1996, Ohashi 1997, Momose et al. 1998). The signature of infall is a velocity gradient along the projected minor axis of a flattened structure that is larger than the disk. Rotation produces a velocity gradient along the projected major axis, allowing one to separate these two motions. Typically, both infall and rotation are inferred from the data. As always, confusion with the outflow is a problem, but this technique is likely to prove powerful as we begin to understand which species do not trace the outflow.
In addition to studies of emission, interferometers provide a new possibility. Because they are sensitive to emission from disks, the continuum emission from the disk can serve as a background lamp and, with even higher spatial resolution and sensitivity, an occulting disk for the back half of the cloud (Evans 2001). For disk emission that is sufficiently bright, the front of the cloud will appear in absorption while the rest of the cloud appears in emission, producing an inverse P-Cygni profile. With instruments like ALMA, one may be able to resolve the opaque part of the disk, occulting the back of the cloud altogether, leaving only the absorption line from the front of the cloud. A redshift in this absorption line is the “smoking gun” for collapse. Hints of this absorption were seen toward NGC 1333 IRAS 4A by Choi et al. (1999), but the IRAM observations of Di Francesco et al. (2001) show a much more dramatic inverse P-Cygni profile. The remaining question in this source is whether the absorption arises from the infalling envelope or from a foreground cloud that just happens to be redshifted. Whatever the outcome in this particular case, this technique will be routine with instruments like ALMA and will allow detailed study of the velocity field (Evans 2001).
7 Studies of the Velocity Field
For the moment, most studies of the velocity field are still done with single dishes. By matching line profiles to models over a map of a source or by modeling the line profiles toward the center for lines with different excitation and opacity, it is possible to decode the velocity field, albeit with ample uncertainties, in part due to unknown depletion profiles. There are two general approaches to this problem. One is to take a well-defined theoretical model and try to constrain it with many observations to determine whether it fits the data with any reasonable set of input parameters (e.g., Zhou et al. 1993, Choi et al. 1995, Lee et al. 2003). The other approach is to decode the velocity field empirically by treating each molecular line in a fairly simple way, but using the ensemble to constrain .
The latter approach forms the basis for a study of IRAM 04191 by Belloche et al. (2002); this paper represents the current state of the art. This source appears to be in a very early stage of infall. The line profiles of optically thick, hard-to-excite lines toward the center show blue profiles, with the self-absorption dip moving farther redward as the excitation requirements of the line increase. By excitation requirements, I mean some combination of temperature and density. Belloche et al. interpret these line profiles in terms of a constant km s-1 for AU, and increasing inward for AU. From line profiles away from the center, they find evidence of rotation as well, with increasing with decreasing radius in to AU, but constant (with large uncertainties) inside 3500 AU. This source is destined to become one of the standard test cases for infall studies, along with B335 and L1544.
8 Future Prospects
While many questions remain and skepticism is justified, the field seems to be moving from arguing about infall to studying it. The combined constraints of dust and molecular line data will be important, as will a deeper theoretical understanding of the depletion of molecules and other chemical effects. Future study of velocity fields, just getting under way, will require self-consistent modeling tools, especially 2D or 3D radiative transfer. Observations will need to probe a wide range of spatial scales, and theory will have to provide testable models that can be generated by observers from publicly available codes to compare against their data. If we acquire a better understanding of infall in regions forming low mass stars, we may be in a position to address the question in the much more complex regions forming massive stars.
Acknowledgements.
I am grateful to M. Choi, T. Bourke, P. Myers, and J. Di Francesco for providing early versions of work in progress and for comments. L. Loinard provided helpful discussions. I thank the State of Texas, NASA (Grant NAG5-7203), and the NSF (AST 9988230) for support.References
- [Andre & Montmerle(1994)] André, P. & Montmerle, T. 1994, ApJ, 420, 837
- [Andre, Ward-Thompson, & Barsony(1993)] André, P., Ward-Thompson, D., & Barsony, M. 1993, ApJ, 406, 122
- [Andre, Ward-Thompson, & Barsony(2000)] André, P., Ward-Thompson, D., & Barsony, M. 2000, Protostars and Planets IV, 59
- [Bacmann et al.(2000)] Bacmann, A., André, P., Puget, J.-L., Abergel, A., Bontemps, S., & Ward-Thompson, D. 2000, A&A, 361, 555
- [Belloche, André, Despois, & Blinder(2002)] Belloche, A., André, P., Despois, D., & Blinder, S. 2002, A&A, 393, 927
- [Bourke et al. (2002)] Bourke, T., Caselli, P., Crapsi, A., Lee, C. W., Myers, P. C., Tafalla, M., & Wilner, D. J. 2002, in prep.
- [Bunyan, John] Bunyan, J. 1688, Pilgrim’s Progress, pt. 1, as reprinted in 1907, Cambridge University Press.
- [Caselli(2002)] Caselli, P. 2002, in Planetary and Space Science special issue, Deuterium in the Universe, in press (astro-ph/0204127)
- [Caselli & Myers(1995)] Caselli, P. & Myers, P. C. 1995, ApJ, 446, 665
- [Caselli et al.(1999)] Caselli, P., Walmsley, C. M., Tafalla, M., Dore, L., & Myers, P. C. 1999, ApJ, 523, L165
- [Caselli et al.(2002)] Caselli, P., Walmsley, C. M., Zucconi, A., Tafalla, M., Dore, L., & Myers, P. C. 2002, ApJ, 565, 344
- [Chandler & Sargent(1993)] Chandler, C. J. & Sargent, A. I. 1993, ApJ, 414, L29
- [Choi(2002)] Choi, M. 2002, ApJ, 575, 900
- [Choi, Evans, Gregersen, & Wang(1995)] Choi, M., Evans, N. J., II, Gregersen, E. M., & Wang, Y. 1995, ApJ, 448, 742
- [Choi, Panis, & Evans(1999)] Choi, M., Panis, J. ;., & Evans, N. J., II 1999, ApJS, 122, 519
- [Di Francesco et al.(2001)] Di Francesco, J., Myers, P. C., Wilner, D. J., Ohashi, N., & Mardones, D. 2001, ApJ, 562, 770
- [Egan, Leung, & Spagna(1988)] Egan, M. P., Leung, C. M., & Spagna, G. R. 1988, Comput. Phys. Commun., 48, 271
- [Evans(1991)] Evans, N. J. 1991, ASP Conf. Ser. 20: Frontiers of Stellar Evolution, 45
- [Evans(1999)] Evans, N. J., II 1999, ARA&A, 37, 311
- [Evans(2001)] Evans, N. J., II 2001, ASP Conf. Ser. 235: Science with the Atacama Large Millimeter Array, 25
- [Evans et al.(2002a)] Evans, N. J., II, et al. 2002a, in prep.
- [Evans et al.(2002b)] Evans, N. J., II, Rawlings, J. M. C., & Choi, M. 2002b, in prep.
- [Evans, Rawlings, Shirley, & Mundy(2001)] Evans, N. J., II, Rawlings, J. M. C., Shirley, Y. L., & Mundy, L. G. 2001, ApJ, 557, 193
- [Goldreich & Kwan(1974)] Goldreich, P. & Kwan, J. 1974, ApJ, 189, 441
- [Goldsmith(2001)] Goldsmith, P. F. 2001, ApJ, 557, 736
- [Goodman, Barranco, Wilner, & Heyer(1998)] Goodman, A. A., Barranco, J. A., Wilner, D. J., & Heyer, M. H. 1998, ApJ, 504, 223
- [Gregersen & Evans(2000)] Gregersen, E. M. & Evans, N. J., II 2000, ApJ, 538, 260
- [Gregersen. E. M. & Evans(2001)] Gregersen. Erik M. & Evans, N. J.,II 2001, ApJ, 553, 1042
- [Gregersen, Evans, Mardones, & Myers(2000)] Gregersen, E. M., Evans, N. J., II, Mardones, D., & Myers, P. C. 2000, ApJ, 533, 440
- [Gregersen, Evans, Zhou, & Choi(1997)] Gregersen, E. M., Evans, N. J., II, Zhou, S., & Choi, M. 1997, ApJ, 484, 256
- [Gueth & Guilloteau(1999)] Gueth, F. & Guilloteau, S. 1999, A&A, 343, 571
- [Harvey et al.(2001)] Harvey, D. W. A., Wilner, D. J., Lada, C. J., Myers, P. C., Alves, J. ;., & Chen, H. 2001, ApJ, 563, 903
- [Harvey et al.(2002)] Harvey, D. W. A., Wilner, D. J., Myers, P. C., Tafalla, M., & Mardones, D. 2002, ApJ, in press (astro-ph/0210081)
- [Hogerheijde(2001)] Hogerheijde, M. R. 2001, ApJ, 553, 618
- [Hogerheijde & Sandell(2000)] Hogerheijde, M. R. & Sandell, G. ;. 2000, ApJ, 534, 880
- [\astronciteLarson1969] Larson, R. B. 1969, MNRAS, 145, 271
- [Lada, Lada, Clemens, & Bally(1994)] Lada, C. J., Lada, E. A., Clemens, D. P., & Bally, J. 1994, ApJ, 429, 694
- [Lee, Myers, & Tafalla(1999)] Lee, C. W., Myers, P. C., & Tafalla, M. 1999, ApJ, 526, 788
- [Lee, Myers, & Tafalla(2001)] Lee, C. W., Myers, P. C., & Tafalla, M. 2001, ApJS, 136, 703
- [\astronciteLee et al.2003] Lee, J.-E., Evans, N. J., II, Shirley, Y. L., & Tatematsu, K. 2003, ApJ, 583, in press (astro-ph/0210182)
- [Leung(1975)] Leung, C. M. 1975, ApJ, 199, 340
- [Leung & Brown(1977)] Leung, C. M. & Brown, R. L. 1977, ApJ, 214, L73
- [Liszt et al.(1974)] Liszt, H. S., Wilson, R. W., Penzias, A. A., Jefferts, K. B., Wannier, P. G., & Solomon, P. M. 1974, ApJ, 190, 557
- [Mardones et al.(1997)] Mardones, D., Myers, P. C., Tafalla, M., Wilner, D. J., Bachiller, R., & Garay, G. 1997, ApJ, 489, 719
- [Menten, Serabyn, Guesten, & Wilson(1987)] Menten, K. M., Serabyn, E., Guesten, R., & Wilson, T. L. 1987, A&A, 177, L57
- [Momose et al.(1998)] Momose, M., Ohashi, N., Kawabe, R., Nakano, T., & Hayashi, M. 1998, ApJ, 504, 314
- [Mundy, Myers, & Wilking(1986)] Mundy, L. G., Myers, S. T., & Wilking, B. A. 1986, ApJ, 311, L75
- [Myers(1997)] Myers, P. C. 1997, Star Formation Near and Far, 41
- [Myers, Evans, & Ohashi(2000)] Myers, P. C., Evans, N. J., II, & Ohashi, N. 2000, Protostars and Planets IV, 217
- [Myers & Lazarian(1998)] Myers, P. C. & Lazarian, A. 1998, ApJ, 507, L157
- [Myers, Linke, & Benson(1983)] Myers, P. C., Linke, R. A., & Benson, P. J. 1983, ApJ, 264, 517
- [Myers et al.(1996)] Myers, P. C., Mardones, D., Tafalla, M., Williams, J. P., & Wilner, D. J. 1996, ApJ, 465, L133
- [Nenkova, Ivezić, & Elitzur(2000)] Nenkova, M., Ivezić, Ž., & Elitzur, M. 2000, ASP Conf. Ser. 196: Thermal Emission Spectroscopy and Analysis of Dust, Disks, and Regoliths, 77
- [Ohashi(1997)] Ohashi, N. 1997, Star Formation Near and Far, 93
- [Ohashi et al.(1996)] Ohashi, N., Hayashi, M., Ho, P. T. P., Momose, M., & Hirano, N. 1996, ApJ, 466, 957
- [Ohashi et al.(1997)] Ohashi, N., Hayashi, M., Ho, P. T. P., Momose, M., Tamura, M., Hirano, N., & Sargent, A. I. 1997, ApJ, 488, 317
- [\astroncitePenston1969] Penston, M. V. 1969, MNRAS, 144, 425
- [Rawlings(2000)] Rawlings, J. M. C. 2000, Astrochemistry: From Molecular Clouds to Planetary, 197, 15
- [Rawlings & Yates(2001)] Rawlings, J. M. C. & Yates, J. A. 2001, MNRAS, 326, 1423
- [Shirley, Evans, Rawlings, & Gregersen(2000)] Shirley, Y. L., Evans, N. J., II, Rawlings, J. M. C., & Gregersen, E. M. 2000, ApJS, 131, 249
- [Shirley, Evans, & Rawlings(2002)] Shirley, Y. L., Evans, N. J., II, & Rawlings, J. M. C. 2002, ApJ, 575, 337
- [\astronciteShu1977] Shu, F. H. 1977, ApJ, 214, 488
- [Shu, Adams, & Lizano(1987)] Shu, F. H., Adams, F. C., & Lizano, S. 1987, ARA&A, 25, 23
- [Snell & Loren(1977)] Snell, R. L. & Loren, R. B. 1977, ApJ, 211, 122
- [Tafalla et al.(1998)] Tafalla, M., Mardones, D., Myers, P. C., Caselli, P., Bachiller, R., & Benson, P. J. 1998, ApJ, 504, 900
- [Visser, Richer, & Chandler(2001)] Visser, A. E., Richer, J. S., & Chandler, C. J. 2001, MNRAS, 323, 257
- [Visser, Richer, & Chandler(2002)] Visser, A. E., Richer, J. S., & Chandler, C. J. 2002, AJ, 124, 2756
- [Walker et al.(1986)] Walker, C. K., Lada, C. J., Young, E. T., Maloney, P. R., & Wilking, B. A. 1986, ApJ, 309, L47
- [Wang, Evans, Zhou, & Clemens(1995)] Wang, Y., Evans, N. J., II, Zhou, S., & Clemens, D. P. 1995, ApJ, 454, 217
- [Ward-Thompson, Scott, Hills, & Andre(1994)] Ward-Thompson, D., Scott, P. F., Hills, R. E., & André, P. 1994, MNRAS, 268, 276
- [Ward-Thompson, Motte, & Andre(1999)] Ward-Thompson, D., Motte, F., & André, P. 1999, MNRAS, 305, 143
- [Whitworth & Ward-Thompson(2001)] Whitworth, A. P. & Ward-Thompson, D. 2001, ApJ, 547, 317
- [Wilner, Mardones, & Myers(1997)] Wilner, D. J., Mardones, D., & Myers, P. C. 1997, Star Formation Near and Far, 109
- [Wilner, Myers, Mardones, & Tafalla(2000)] Wilner, D. J., Myers, P. C., Mardones, D., & Tafalla, M. 2000, ApJ, 544, L69
- [\astrociteYoung et al.2003] Young, C. H., Shirley, Y. L., Evans, N. J., II, & Rawlings, J. M. C. 2003, ApJ, in press (astro-ph/0210330)
- [\astrociteZhou1992] Zhou, S. 1992, ApJ, 394, 204
- [Zhou(1999)] Zhou, S. 1999, ASSL Vol. 241: Millimeter-Wave Astronomy: Molecular Chemistry (Kluwer Academic Publishers) Physics in Space., 199
- [\astrociteZhou & Evans1994] Zhou S., Evans N. J., II 1994, ASP Conf. Ser. 65: Clouds, Cores, and Low Mass Stars, 183
- [\astrociteZhou, Evans, Koempe, & Walmsley1993] Zhou, S., Evans, N. J., II, Koempe, C., & Walmsley, C. M. 1993, ApJ, 404, 232
- [Zhou, Evans, & Wang(1996)] Zhou, S., Evans, N. J., II, & Wang, Y. 1996, ApJ, 466, 296
- [\astronciteZuckerman & Evans1974] Zuckerman, B. & Evans, N. J., II 1974, ApJL, 192, L149