The Most Massive Clusters in the Universe
Abstract
Clusters of galaxies need to be investigated using complementary approaches combining all currently available observational techniques (X-ray, gravitational lensing, dynamics, SZ) on homogeneous samples if one wants to understand their evolution and physical properties. This is particularly important in order to relate the observable quantities to the cosmologically important cluster mass. We present here a number of on-going projects that aim at studying cluster physics for samples based on currently available all-sky X-ray surveys such as XBACs, BCS and MACS.
Observatoire Midi-Pyrénées, 14 avenue Édouard Belin, 31400 Toulouse, France
1. Introduction
Clusters of galaxies are important probes for cosmology. In hierarchical scenarios for structure formation in the Universe they are the latest class of gravitationally bound objects to have formed and their formation and evolution can be observed at fairly low redshifts, . The mass function of clusters of galaxies depends on the mean mass density in the Universe, , as well as on the normalisation of the density fluctuation power spectrum, . Measurements of the local cluster mass function constrain the combination ; the degeneracy is broken through observations of the evolution of the mass function with redshift (e. g. Eke et al. 1996). The evolution of the mass function is strongest, and hence in principle most easily observable, at the high-mass end.
The mass distribution within clusters depends on the type and properties of the elusive dark matter. In cold dark matter scenarios, numerical simulations indicate the existence of a universal dark matter profile (Navarro, Frenk, & White 1997), which falls off as at large radius and has a central cusp of limiting slope between and (Navarro et al. 1997, Moore et al. 1998, Ghigna et al. 2000). Warm or self-interacting dark matter would result in more extended central mass distributions, i. e. a central flat core (e. g. Spergel & Steinhardt 2000). Probing the central mass distribution in clusters on scales of can thus provide valuable information on the properties of the dark matter, although flat cores can be mimicked or created by projection effects or line-of-sight cluster mergers (Czoske et al. 2002). The slope of the total mass profile is also strongly affected by the presence of baryons and particularly galaxies (stars) that suffer collisions unlike CDM particles, so we do not expect that the actual slope of the mass profile in the very centre follows an NFW-like profile. This effect is difficult to model and few numerical simulations have attacked this problem so far. Lensing measurements of central mass profiles can provide valuable clues on the behaviour of baryons in cluster size dark matter halos. Massive clusters are particularly interesting in this context because their high central mass density enables them to multiply image suitably placed background galaxies (strong lensing, see below), thus providing a means to accurately reconstruct the central mass distribution at high resolution.
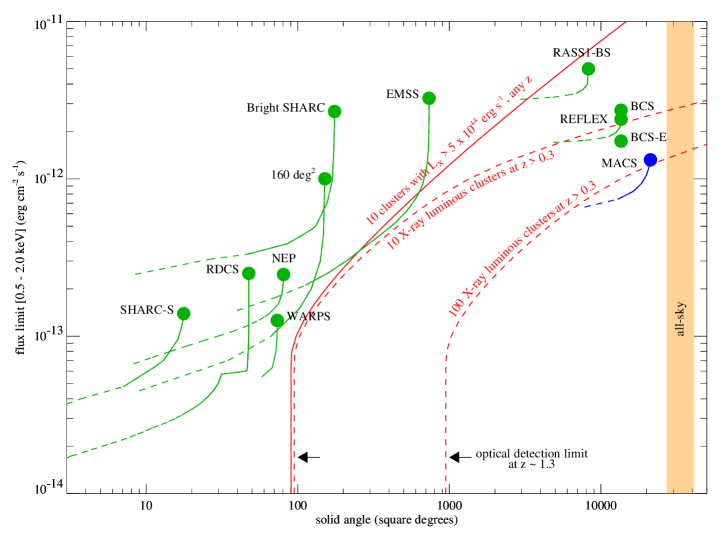
Traditionally, clusters of galaxies have been found through optical (Abell 1958, Zwicky et al. 1961, Las Campanas Distant Cluster Survey, EDISCs, Red-Sequence Cluster Survey) or X-ray methods. While optical methods yield larger samples, their selection criteria are not as closely related to cluster mass as is X-ray luminosity. Furthermore, optical searches are prone to projection effects. X-ray surveys are much less affected by projection because the surface brightness varies as the square of the gas density and thus directly probes gas trapped in deep potential wells. The most massive clusters are therefore most reliably selected from X-ray surveys (Fig. 1). Since massive clusters are rare objects, X-ray surveys need to cover large areas on the sky, so that (nearly) all-sky surveys such as Reflex (Böhringer et al. 2001) or BCS (Ebeling et al. 1998) are needed to construct large samples of very massive clusters, with only the on-going MACS survey (Ebeling et al. 2001) providing sufficient depth to find massive clusters at high redshift (). For the future, weak lensing and Sunyaev-Zeldovich (SZ) surveys will provide new cluster catalogues. Whereas weak lensing surveys will select clusters directly by (projected) mass (Miyazaki et al. 2002), their survey areas will be too small to yield complete samples of the most massive clusters. Furthermore, since weak lensing analyses require large numbers of background galaxies, the clusters found by this method will probably be restricted to a redshift range of (Ellis 2001). The SZ effect is independent of redshift and thus holds great promise for constructing cluster catalogues particularly at high redshift. However, a large cluster catalogue won’t be available until the all-sky SZ survey conducted by the Planck mission.
Every cluster selection method also provides a way to estimate cluster masses. The most direct route to the total mass distribution in clusters of galaxies is provided by the gravitational lens effect which is sensitive to the total mass independent of the nature of the matter (dark or baryonic) or its dynamical state. Lensing is however sensitive to the weighted sum of all mass between the observer and the source, hence the interpretation of the measured mass as a cluster mass can be problematic in the presence of several mass concentrations along the line of sight (e. g. Czoske et al. 2002). Also, substructure in the vicinity of the cluster can bias masses determined from gravitational lensing (Metzler et al. 2001).
The X-ray emission from clusters of galaxies comes from hot gas confined within the cluster potential well and is less sensitive to projection effects than optical and lensing methods. However, in order to estimate the total cluster mass from X-ray observations (temperature, surface brightness distribution), one generally assumes that the gas is in hydrostatic equilibrium and that the cluster is spherically symmetric. The assumption of hydrostatic equilibrium can be strongly violated in particular in merging clusters in the presence of shock waves. Another problem with the interpretation of X-ray observations is that the observed relation between X-ray luminosity and X-ray temperature, differs from the theoretically expected relation if the gas is heated purely through gravitational collapse, so that other, non-gravitational heating mechanisms have to be invoked (e. g. Henry, this volume). In the absence of a complete theoretical understanding of these heating mechanisms the relations between X-ray observables and cluster mass have to be calibrated observationally (Smith et al. 2003).
Gravitational lensing gives rise to a diverse phenomenology that allows to probe the mass distribution in clusters over a wide range of length scales (see the contribution by M. Bartelmann, this volume). The central parts of clusters are characterised by their large surface mass density capable of producing multiple images of suitably placed background galaxies. Positions and flux ratios of these multiple images allow a detailed reconstruction of the central projected mass distribution at resolutions of typically . If multiple image systems at different source redshifts are present in the same cluster, it is possible to constrain the geometry of the Universe and measure the cosmological parameters and (Golse, Kneib & Soucail 2002). Further away from the cluster centre, the gravitational shear, i. e. the distortion of background galaxy shapes introduced by the lens potential, is weak, at best of the order of the intrinsic scatter in galaxy ellipticities, and hence only measurable statistically, by averaging over large numbers of background galaxies. Consequently the spatial resolution of weak shear mass reconstructions is poor; on the other hand, coherent shear signals can be detected out to distances of from the cluster centre.
In this contribution we present a number of projects aiming at studying the properties of the most massive clusters through gravitational lensing and other methods.
2. Panchromatic High- Survey
This project aims at compiling as complete data sets as possible for a homogeneously selected sample of X-ray luminous, hence presumably massive, clusters of galaxies. In order to minimise evolutionary effects, the clusters were chosen to lie within a narrow range of redshifts around . The observational corner stones of the project include high-resolution imaging with HST/WFPC2, multi-colour wide-field imaging with the CFH12k camera on CFHT, and X-ray imaging and spectroscopy with XMM/Newton (Marty et al. 2002). The data are complemented by optical multi-object spectroscopy, as well as near-IR imaging with UKIRT and VLT.
2.1. Sample Selection
The clusters were selected from the XBACs catalogue of Ebeling et al. (1996). This catalogue is a flux-limited compilation of Abell clusters identified in the Rosat All-Sky Survey data. While this catalogue is based on the optically selected Abell catalogue which is known to be incomplete at high redshift, comparison with the purely X-ray selected BCS (Ebeling et al. 1998) shows that more than 80% of the BCS clusters are indeed Abell clusters and included in XBACs. Sample completeness is a minor concern for this project which rather aims at compiling a homogeneous data set for a representative cluster sample. Fig. 2 shows the location of this sample within the XBACs catalogue.

2.2. Strong Lensing
The excellent resolution of the WFPC2 images of the central parts of the clusters in our sample allows a detailed study of the giant arc systems which are present in the majority of the clusters. Eight clusters of the sample (A 68, A 209, A 267, A 383, A 773, A 963, A 1763, A 1835) were observed in Cycle 8 (P. I. J.-P. Kneib) through the F702W filter with three orbits per cluster. Images for the remaining four clusters were taken from the HST archive.
A strong lensing model for Abell 383 was presented by Smith et al. (2001). This regular cluster shows a multitude of giant arcs and arclets which allowed a detailed determination of the radial density profile of the cluster and to assess the influence of individual galaxies which break up the arcs to the south of the cD galaxy. The presence of two radial arcs at distances of and (corresponding to and at the cluster redshift) imposes strong constraints on the slope of the density profile at these distances. Fig. 3 shows the reconstructed three-dimensional density profile in Abell 383; approaching the centre the profile first flattens as expected for a CDM type profile, reaching a slope of at the position of the outer radial arc, but then steepens again, reaching a slope of at the position of the inner radial arc. Similar profiles are observed in most of the other clusters in our sample (Smith et al. 2003). The steepening is most likely due to the contribution of the stars in the cD galaxies, which is not accounted for in numerical simulations involving only dark matter.

2.3. Weak Lensing
Panoramic ground based images of all the clusters in the sample (with the exception of Abell 773) were obtained during three observing runs at CFHT during 1999/2000. The images were taken in the , and filters with the CFH12k camera, a mosaic camera of 12 CCD chips of pixels each. The field of view of the camera is , or at . The data reduction is described in Czoske (2002). The most critical step in the reduction is the astrometric registration of the dithered exposures of a given field and the assembly of the images from the 12 individual chips into one contiguous image. Our registration pipeline achieves a final rms deviation of object positions between the exposures of down to , corresponding to 1/20 of the CFH12k pixel scale.
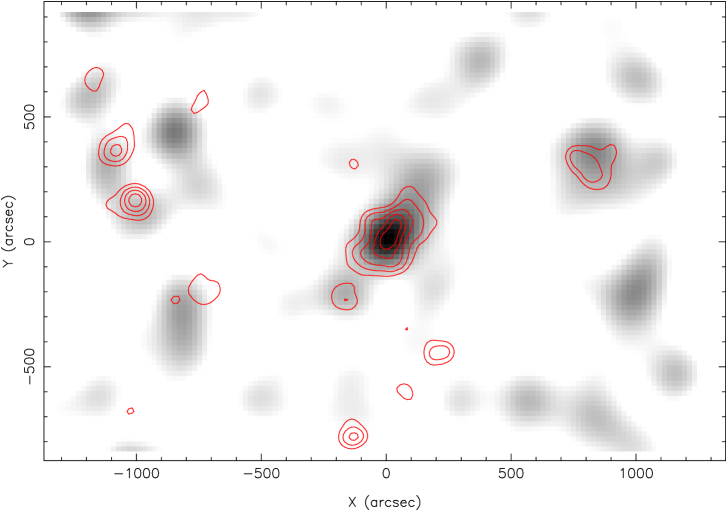
Galaxy shape measurements are done using the im2shape software by S. Bridle which models the galaxy and PSF shapes as the sum of 2-dimensional Gaussian profiles. Mass maps are constructed from the shear field of background galaxies using LensEnt, a method based on the maximum entropy principle (Bridle et al. 1998, Marshall et al. 2002). Fig. 4 shows the surface mass density field around Abell 68, reconstructed from CFH12k -band image. Apart from the cluster itself the reconstruction reveals a number of additional mass concentrations, most of which correspond to overdensities in the galaxy distribution. Redshifts for these overdensities are needed in order to calibrate the absolute masses associated with them and to establish a possible connection to the main cluster. The numbers of serendipitously found mass concentrations in our fields is consistent with the dedicated survey by Miyazaki et al. (2002).
2.4. Redshift distribution
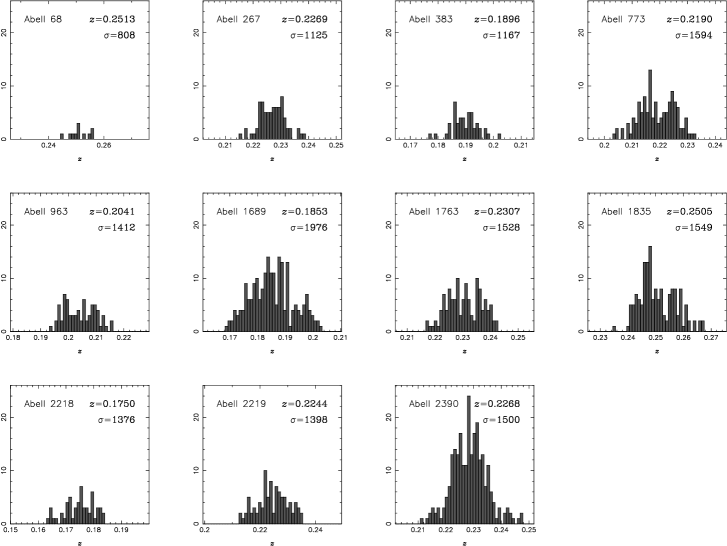
Gravitational lensing yields direct and robust mass measurements, but it is important to note that these are always weighted sums over all mass contributions along the line of sight between the observer and the sources, and therefore care must be taken if one wants to interpret two-dimensional lensing masses in terms of three-dimensional cluster masses. A striking example of how the projection of two clusters along the line of sight can indicate a spurious large cluster mass has been provided through the wide-field spectroscopic survey of the cluster Cl0024+1654 at by Czoske et al. (2001, 2002). In this case the complicated line-of-sight structure of the cluster was only revealed through the redshift distribution and was not visible in any other type of observation. In order to investigate the presence of substructure in our cluster sample we obtain sizable samples of galaxy redshifts for all of our clusters. The redshift histograms are shown in Fig. 5. As can be seen, several of our clusters do indeed show signs of substructure which has to be taken into account in the interpretation of the gravitational lensing results. In the cases where no substructure is present the redshift distribution provides a valuable additional independent mass estimate for the cluster.
3. Other XBACs/BCS follow-up projects
3.1. XBACS/BCS VLT/Gemini survey
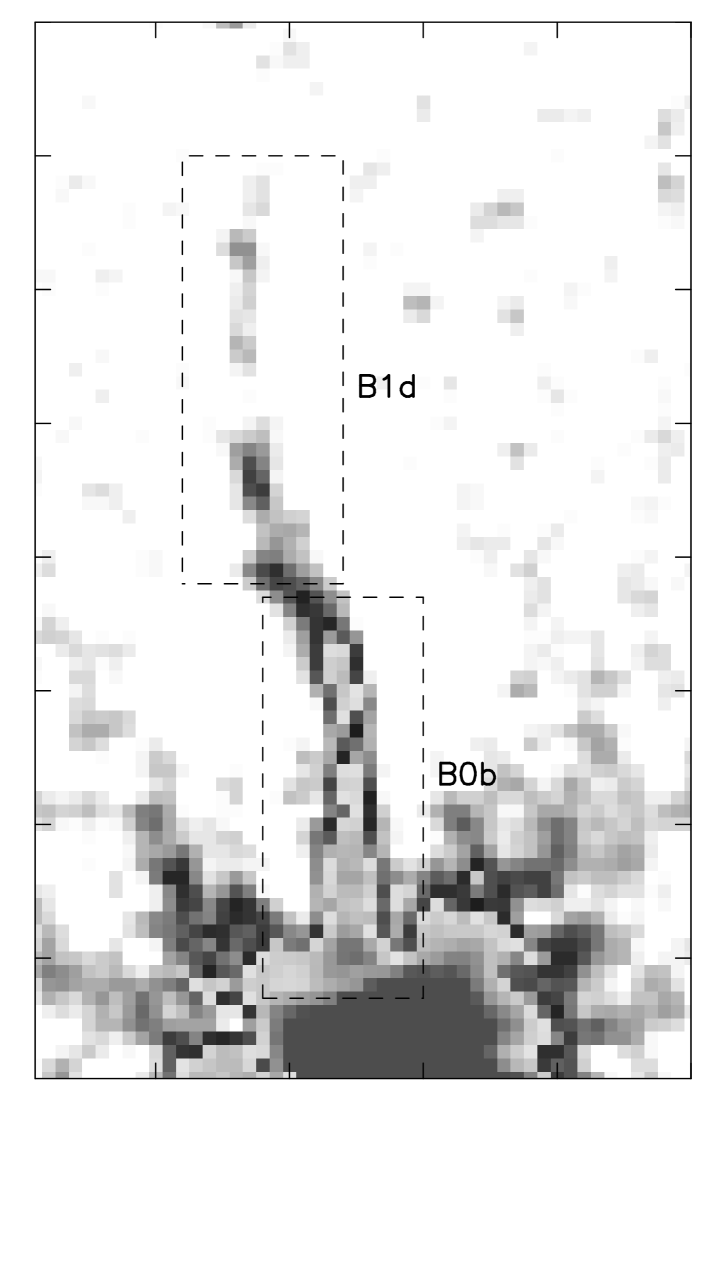
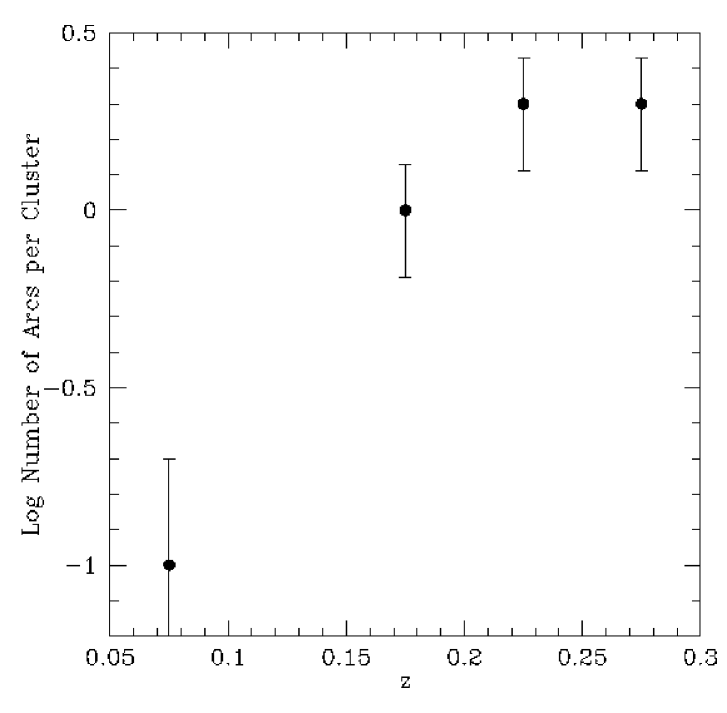
In this project (Cypriano et al. 2002) shallow exposures of 24 clusters at and are observed in the , and bands with VLT/FORS1; a further 8 clusters were observed with Gemini/GMOS in , and . The sample lends itself to test predictions on the numbers of gravitational arcs expected depending on the mass profile of the cluster. As shown by Meneghetti et al. (2002), profiles that are shallower than a singular isothermal sphere (such as the NFW profile) lead to a marked decrease in the number of arcs seen behind low-redshift clusters (), whereas the isothermal sphere would have a roughly constant cross section for arc formation down to very low redshifts. First results from the XBACS subsample show that the number of arcs per cluster is indeed smaller for the low-redshift clusters () than for the higher-redshift clusters () by a factor , indicating that cluster profiles are shallower than isothermal (Fig. 6, Cypriano et al. 2002).

3.2. HST BCS Snapshot Survey
An HST Snapshot Survey of the central galaxies of more than 50 clusters taken from the BCS is being conducted by A. Edge and collaborators. The primary goal of this project is to study in detail the optical morphology on small scales of a complete sample of these most massive stellar systems. However, these shallow images can also used to detect gravitational arcs and arclets in the centres of these clusters, thus providing an unbiased sample suitable for arc statistics.
3.3. Keck spectroscopy of central cluster galaxies
In a project led by T. Treu and R. Ellis, Keck spectroscopy of central cluster galaxies and surrounding arcs and arclets is used to compare the velocity dispersion of stars in the central galaxies with masses derived from lensing. Arc redshifts are essential for accurate mass determinations from strong lensing; since arcs have low surface brightness 10m class telescopes are necessary in order to be able to determine their redshifts. Comparing stellar velocity dispersions to lensing masses allows an assessment of the importance of the mass contribution from stars in the cluster centre relative to the dark matter contribution (Sand, Treu & Ellis 2002).
4. The Ultimate MACS Survey
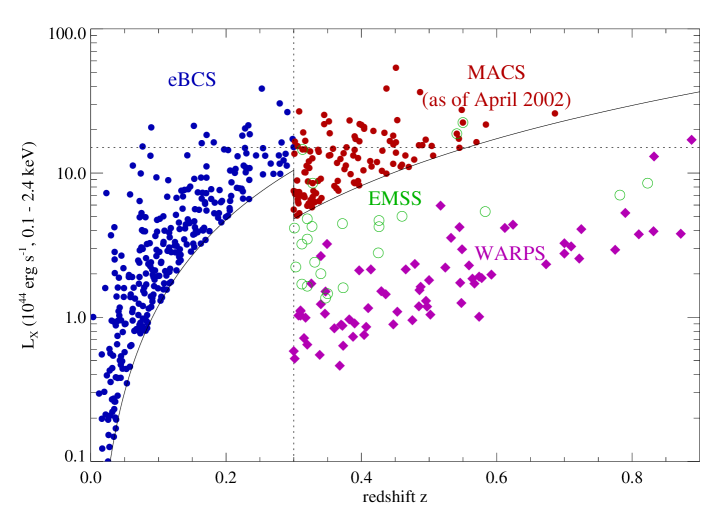
The MACS survey (Ebeling et al. 2001) is an all-sky X-ray survey based on the Rosat All-Sky Survey data that for the first time combines sufficient depth and sky-coverage to find the most X-ray luminous clusters at high redshift (). Previous surveys that were looking for high-redshift clusters, such as EMSS or WARPS, were restricted to small sky-area and thus missed the rare high- objects, as shown in Fig. 7. At present, 119 MACS clusters at are known; most of these are to be observed with Chandra. MACS clusters are being imaged with Subaru/Suprime to conduct weak lensing analyses; in addition, spectroscopic follow-up observations are being conducted to investigate cluster dynamics and to look for substructure. Unfortunately, there is no HST imaging yet.
5. Conclusions
Clusters of galaxies are complex systems. Each cluster is an individual and we need to study large homogeneous samples in order to properly assess the diversity of the cluster populations. We have presented a number of on–going projects which aim at studying such samples of the most massive clusters from a variety of viewpoints, using all currently available observational techniques. These parallel/complementary approaches, combining X-ray, lensing, dynamics, SZ etc., are important in order to investigate the physics of clusters. The aims of these studies are to understand the mass distribution of clusters and to probe the cluster mass evolution with redshift from to ; to understand the importance of the physical processes in clusters and the relation of observable properties to mass; to assess the frequency of substructure and mergers and how they affect the statistical properties of cluster catalogues; and, finally, to relate these results to the cosmological framework (Smith et al. 2003). We plan to conduct studies similar to the sample (Sect. 2) at different redshifts, , and , the latter based on subsamples of MACS.
Acknowledgments.
This contribution presents work done in collaboration with many colleagues: Ian Smail, Graham Smith, Harald Ebeling, Sarah Bridle, Alastair Edge, Luis Campusano, L. Sodré, Eduardo Cypriano, Phil Marshall. OC thanks the organizers for giving him the opportunity to attend this meeting.
References
Abell, G. O. 1958, ApJS, 3, 211
Böhringer, H. et al. 2001, A&A, 369, 82
Bridle, S. L. et al. 1998, MNRAS, 299, 895
Czoske, O. et al. 2001, A&A, 372, 391
Czoske, O. 2002, Ph D thesis, Université Paul Sabatier, Toulouse
Czoske, O. et al. 2002, A&A, 386, 31
Ebeling, H. et al. 1996, MNRAS, 281, 799
Ebeling, H. et al. 1998, MNRAS, 301, 881
Ebeling, H. , Edge, A. C. & Henry, J. P. 2001, ApJ, 553, 668
Eke, V. R., Cole, S., & Frenk, C. S. 1996, MNRAS, 282, 263
Ellis, R. S. 2001, astro-ph/0112540
Ghigna, S. et al. 2000, ApJ, 544, 616
Golse, G., Kneib, J.-P., & Soucail, G., 2002, A&A, 387, 788
Marshall, P. J. et al. 2002, MNRAS, 335, 1037
Marty, Ph. et al. 2002, astro-ph/0209270
Meneghetti, M. et al. 2002, astro-ph/0201501
Metzler, C. A., White, M. & Loken 2001, ApJ, 547, 560
Miyazaki, S. et al. 2002, ApJ, 580, L97
Moore, B. et al. 1998, ApJ, 499, L5
Navarro, J. F., Frenk, C. S., & White, S. D. M. 1997, ApJ, 490, 493
Sand, D. J., Treu, T. & Ellis, R. S. 2002, ApJ, 574, L129
Smith, G. P. et al. 2001, ApJ, 552, 493
Smith, G. P. et al. 2003, astro-ph/0211186
Spergel, D. N. & Steinhardt, P. J. 2000, Phys.Rev.Lett, 84, 3760
Zwicky, F., Herzog, E. & Wild, P. 1961, “Catalogue of galaxies and clusters of galaxies”, Caltech, Pasadena