11email: dietrich@astro.ufl.edu, hamann@astro.ufl.edu 22institutetext: current address: Department of Physics & Astronomy, Georgia State University, One Park Place South SE, Suite 700, Atlanta, GA 30303, USA 33institutetext: Landessternwarte Heidelberg–Königstuhl, Königstuhl 12, D–69117 Heidelberg, Germany
33email: iappenze@lsw.uni-heidelberg.de,jheidt@lsw.uni-heidelberg.de,swagner@lsw.uni-heidelberg.de 44institutetext: Universitätssternwarte Göttingen, Geismarlandstraße 11, D–37083 Göttingen, Germany
44email: jaeger@uni-sw.gwdg.de 55institutetext: Department of Astronomy, The Ohio State University, 140 West 18th Av., Columbus, OH 43210-1173, USA
55email: vester@astronomy.ohio-state.edu
Elemental Abundances in the Broad Emission Line Region of Quasars at Redshifts larger than 4 ††thanks: Based on observations collected at the VLT-UT1 operated on Cerro Paranal (Chile) by the European Southern Observatory
We present observations of 11 high redshift quasars () observed with low spectral resolution in the restframe ultraviolet using FORS 1 at the VLT UT 1. The emission-line fluxes of strong permitted and intercombination ultraviolet emission lines are measured to estimate the chemical composition of the line emitting gas. Comparisons to photoionization calculations indicate gas metallicities in the broad emission line region in the range of solar to several times solar. The average of the mean metallicity of each high-z quasar in this sample is . Assuming a chemical evolution time scale of Gyrs, we derive a redshift of for the onset of the first major star formation episode (H km s-1 Mpc-1, , ), corresponding to an age of the universe of several yrs at this epoch. We note that this epoch is also supposed to be the era of re-ionization of the universe.
Key Words.:
active galaxies – quasars – elemental abundance – star formation history1 Introduction
Quasars are among the most luminous objects known in the universe. Due to their high luminosity they are excellent tools to probe their galactic environment up to the highest redshifts. There is growing evidence that quasar activity and the formation of their host galaxies, in particular of massive spheroidal systems, are closely related. The detection of dark massive objects (DMOs) in the center of nearly every galaxy with a significant spheroidal subsystem provides further strong support for the relationship between galaxy formation and quasar activity (Kormendy & Richstone 1995; Magorrian et al. 1998; Kormendy & Gebhardt 2001). It has been shown that the mass of the DMOs, most likely supermassive black holes, is closely correlated to the bulge mass of the host galaxy (Gebhardt et al. 2000; Kaspi et al. 2000; Merritt & Ferrarese 2001; Tremaine et al. 2002). The evolution of the star formation rate indicates that it was more than one order of magnitude larger at epochs than in the local universe (Lilly et al. 1996; Connolly et al. 1997; Tresse & Maddox 1998; Steidel et al. 1999). Strong evidence for the relationship of quasar activity to galaxy formation accompanied by intense star formation is provided by the detection of large amounts of dust ( M⊙) and molecular gas ( M⊙) in high redshift quasars (Andreani, La Franca, & Cristiani 1993; Isaak et al. 1994; Omont et al. 1996, 2001; Carilli et al. 2001). Several galaxy evolutionary models have been suggested which show that galactic spheroids can easily reach solar or supersolar gas-phase metallicities on time scales shorter than Gyr (Arimoto & Yoshii 1987; Hamann & Ferland 1993; Gnedin & Ostriker 1997; Friaça & Terlevich 1998; Cen & Ostriker 1999; Salucci et al. 1999; Kauffmann & Haehnelt 2000; Granato et al. 2001; Romano et al. 2002). As a result, quasars at high redshift are valuable probes for dating the first star formation in the early universe. In particular, quasars probe a cosmic era when the universe had an age of less than % of its current age (assuming km s-1 Mpc-1, , ).
The prominent emission-line spectrum of quasars contains valuable information to estimate the gas metallicity at early epochs due to star formation (for a review, see Hamann & Ferland 1999). Early studies to estimate the abundances in broad emission line region (BELR) gas were based on several generally weak intercombination lines like N iv], O iii], N iii], and C iii] (Shields 1976; Davidson 1977; Baldwin & Netzer 1978; Osmer 1980; Gaskell, Shields, & Wampler 1981; Uomoto 1984) and indicated already higher than solar metallicity for the BELR gas. Recent studies of the emission line and intrinsic absorption line properties of () quasars provide evidence for enhanced metallicities up to an order of magnitude above solar (Hamann & Ferland 1992, 1993; Petitjean et al. 1994; Ferland et al. 1996; Hamann 1997; Pettini 1999; Dietrich et al. 1999; Dietrich & Wilhelm-Erkens 2000; Hamann et al. 2002; Warner et al. 2002; Dietrich et al. 2002 in prep.). These high metallicities require a preceding intense star formation phase.
To estimate the chemical composition of the gas in quasar BELRs, nitrogen as a secondary element is of particular interest. Providing that the secondary nitrogen production, i.e., the synthesis of nitrogen from existing carbon and oxygen via CNO burning in stars (Tinsley 1979, 1980; Wheeler, Sneden, & Truran 1989), is the dominant source for nitrogen, we can expect the relation , i.e., . This scaling of with metallicity has been confirmed for many H ii-regions (Shields 1976; Pagel & Edmunds 1981; van Zee et al. 1998; Izotov & Thuan 1999).
As suggested by Shields (1976), and later developed by Hamann & Ferland (1992, 1993) and Ferland et al. (1996), emission line ratios involving N v are especially valuable. Generally, N v is stronger than expected in the spectra of high redshift quasars compared to predictions of standard photoionization models assuming solar metallicity. Hamann & Ferland (1992, 1993) showed that N v/C iv and N v/He ii are useful metallicity indicators. Recently, Hamann et al. (2002) presented results of a detailed study of the effects of metallicity and the spectral shape of the photoionizing continuum on emission line ratios. They revised the metallicity dependence of line ratios involving intercombination lines, recombination lines, and collisionally excited lines. They suggest that the most robust indicators of the gas chemical composition are the line ratios N iii]/O iii] and N v/(O viC iv).
We observed a small sample of high redshift quasars () with the Very Large Telescope (VLT) to extend prior studies to higher redshift and hence to earlier epochs in the cosmic evolution, approaching an age of the universe of Gyr. This sample is supplemented with the observation of SDSS 0338+0021 (; Dietrich et al. 1999; Fan et al. 1999).
In section 2 we describe the observations and the data analysis. In section 3 we present the results of the analysis of the emission line spectra. We estimate the elemental abundance of the line emitting gas based on the line ratios of several diagnostical emission lines (Hamann et al. 2002). The overall mean metallicity of the high redshift quasars amounts to . These results are discussed and are compared with recent studies in section 4. The chemical composition of the BELR gas provides further evidence that the first major star formation epoch started at a redshift of , corresponding to an age of the universe of several yrs. This result is in
good agreement with recent model predictions relating quasar activity with the formation of early type galaxies. We assumed km s-1 Mpc-1, , and .
2 Observations and Data Analysis
We observed the restframe wavelength region Å for 11 quasars with (Table 1), which contains the valuable diagnostic ultraviolet emission lines (e.g., O vi, Ly, N v, N iv], C iv, He ii, O iii], N iii], and C iii]). The quasars were observed on Dec. 26, 1998, July 16 – 20, and August 14 – 15, 1999. The total exposure times are ranging from 15 to 60 minutes, typically 30 minutes. All observations were carried out using FORS 1 (focal reducer and low-dispersion spectrograph; Möhler et al. 1995) at the Cassegrain focus of the VLT UT 1 Antu. The observations were performed under non-photometric conditions. The seeing was ″ on December, and varied between 08 and 26 during the observations in July and between 10 and 19 in August. A Tektronix CCD detector with pixels (pixel size ) and grating G150I (230 Å/mm) were used in connection with a blocking filter GG435 to suppress contamination of the spectra by the second order for Å. With this setting an observed wavelength range of approximately Å was achieved. The quasar spectra were recorded in the multi-object spectroscopy (MOS) mode, in the () or 11th () of the 19 slitlets. The position angle of the slit was set perpendicular to the horizon to minimize light losses caused by differential refraction. With the exception of APM 1335-0417, the quasars were observed close to the meridian (airmass less than ). The other slits were used to observe spectra of faint objects in the close environment of the quasars which appear slightly extended on the Palomar Observatory Sky Survey (POSS). These serendipity data will be presented and discussed in an upcoming paper. The standard stars EG 21, LTT 1788, and LTT 7379 (Hamuy et al. 1992) were observed for relative flux calibration each night, with exposure times of typically 60 seconds.
The quasar and standard star spectra were processed using standard MIDAS111Munich Image Data Analysis System, trade-mark of the European Southern Observatory software. Cosmic-ray events were removed manually by comparing multiple exposures for each object. The night sky component of the 2 D-spectra was subtracted by fitting third order Legendre polynomials perpendicular to the dispersion, along each spatial row of the spectra using areas on both sides of the object spectrum which were not contaminated by the quasar or other objects. The 1 D-spectra were extracted using an optimal extraction algorithm (Horne 1986). The width of the spatial extraction windows was adjusted to match the seeing recorded during the observation. The helium-argon wavelength calibration frames, taken for each quasar MOS-setting, yield a dispersion of 5.4 Å/pxl with an internal error of Å. The strong night sky emission lines [O i] , [O i] , and [O i] indicate an absolute uncertainty of Å ( km s-1). The FWHM spectral resolution measured from these lines is Å.
We corrected each quasar spectrum for the atmospheric c-band, b-band, and A-band absorption, caused by , and the atmospheric water vapor absorption bands ( Å, Å, Å), using the standard stars observed during the same nights. The spectra were corrected for atmospheric extinction applying the standard curve of La Silla (Schwarz & Melnick 1993) and for interstellar extinction using the values of Burstein & Heiles (1982) and the extinction curve of Savage & Mathis (1979).
The sensitivity functions, based on individual standard stars, differ by less than % from the mean sensitivity function for all nights.
3 Results
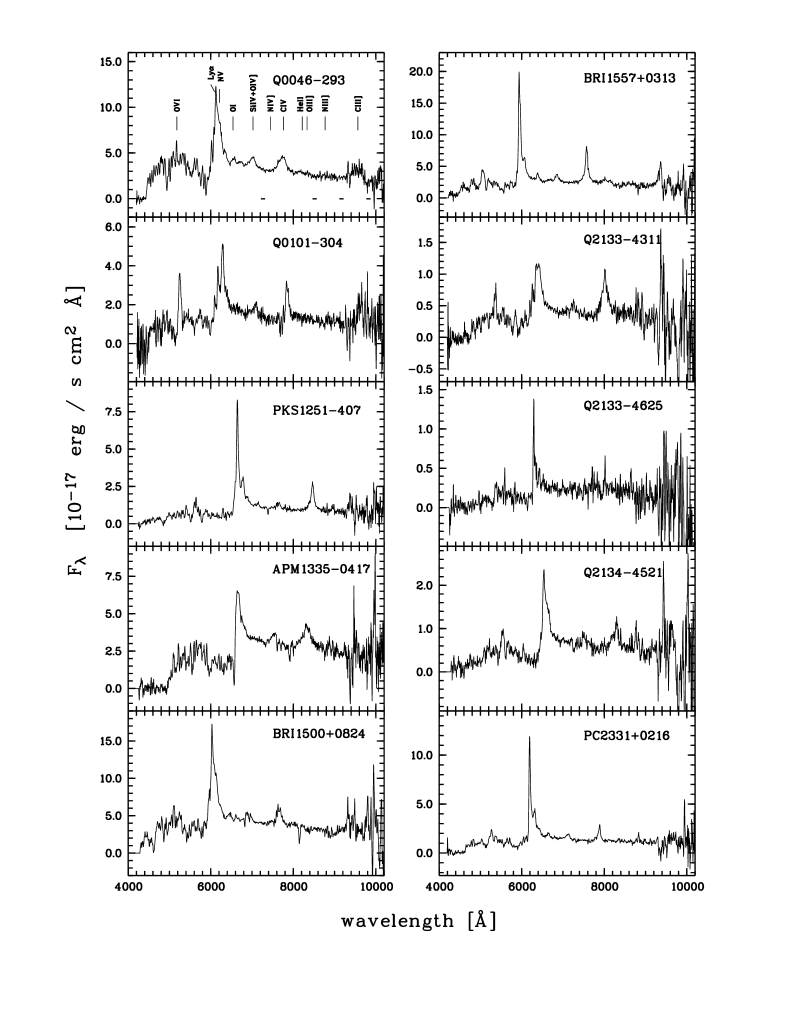
The flux calibrated quasar spectra are shown in Figure 1, with the observed flux in units of erg s-1 cm-2 Å-1. The strongest lines in the spectra are Ly and C iv. The broad and moderately strong Å feature which consists of the Si iv and the O iv] multiplet is quite prominent in these quasar spectra. This feature will be refered as Si iv in the following. In addition to these emission lines, several important diagnostic lines like O vi, He ii, O iii], N iii], and C iii] are visible and marked in Figure 1.
The observed quasar spectra were transformed to their restframe using the redshifts given in Table 1. To determine the redshift we fit a Gaussian profile to the upper part of the the C iv emission line ( % of the peak intensity).
We employed a multicomponent fit to the quasar spectra to determine the power-law continuum, , the contribution of Fe ii and Fe iii emission, and the weak contribution of the Balmer continuum emission (see Dietrich et al. 2002a,b). The power-law continuum was fitted using small spectral regions, each 10 to 20 Å wide, centered at Å, Å, Å, Å, Å, and Å which are free of detectable emission lines. The spectral indices are given for each quasar in Table 2. The properly scaled Fe emission was subtracted using an emission template which accounts for both Fe ii and Fe iii emission (Vestergaard & Wilkes 2001). This improves especially the measurement of N iii] and reduces the flux of the Å feature (Laor et al. 1994).
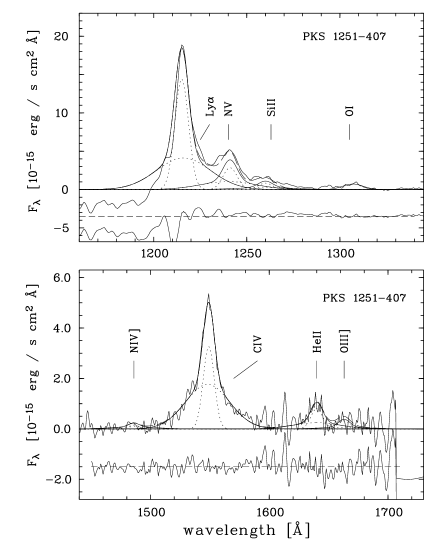
We used the C iv emission line profile as a template to measure the other emission line fluxes. The C iv line profile was fitted with a broad and a narrow Gaussian component. We fixed the spectral width of the broad and narrow component in velocity space and allowed the strengths to vary independently. Furthermore, shifts in velocity space of the broad and narrow component were restricted to a range of less than a few 100 km s-1 with respect to C iv. Using this C iv emission template is particularly important for the N v and He ii profiles which are blended with other emission lines. To measure C iii] we used the C iv template to fit C iii], Si iii], and Al iii simultaneously. This template-fitting approach can be justified since C iv, N v, and He ii are all high ionization lines (HIL). Figure 2 shows typical examples of the deblending of the Ly - N v and N iv] - C iv - He ii - O iii] emission line complexes. The resulting line flux measurements for the quasars are given in Table 2. The uncertainties were estimated from the multicomponent line fit using the scaled C iv line profile to obtain a minimum fit. The errors are of the order of % for stronger lines like Ly, N v, Si iv, C iv, and C iii], and % or more for the weaker lines. The measurement of the N iv] emission line flux is severely affected by the blue wing of the broad C iv-component. Particularly, for quasars with broad emission line profiles the N iv] line tends to show a low contrast to the outer part of the C iv line profile which can be represented by the broad C iv-component only (see Dietrich & Hamann 2002 in prep., for further discussion).
|
|||||||||||||||||||||||||||||||||||||||||||||||||||||||||||||||||||||||||||||||||||||||||||||||||||||||||||||||||||||||||||||||||||||||||||||||||||||||||||||||||||||||||||||||||||||||||||||||||||||||||||||||||||||||||||||||||||||||||||||||||||||||||||||||||||||
The O vi emission line flux given in Table 2 has been corrected for Ly forest absorption. For this correction we assumed an intrinsic continuum slope of for Å (Telfer et al. 2002). The correction factor follows by simply assuming the same fraction of the continuum and O vi emission line flux were absorbed by the Ly forest. The correction factors ranged from to , with an average of .
Hamann et al. (2002) presented new results of the dependence of emission line ratios from metallicities and the shape of the ionizing input continuum. They calculated detailed photoionization models for a wide range of density, , and continuum strength, , using CLOUDY (Ferland et al. 1998). To study the influence of the chemical composition and of the continuum shape, the metallicity was varied from to with three different input continua — a broken power-law continuum with a UV bump (Mathews & Ferland 1987), a single power-law continuum with , and a segmented power-law based on Zheng et al. (1997) and Laor et al. (1997). For more details of the model calculations see Hamann et al. (2002). We used the results of these calculations to derive the chemical composition of the line emitting gas. The most reliable line ratios are those of N iii]/O iii] and N v/(O viC iv). In general, the derived metallicities depend only weakly on
the shape of the ionizing continuum. The strongest influence of the input continuum shape is found for N v/He ii, where we find a factor of 2 difference depending on the continuum. Our estimates of the metallicity for the high redshift quasars under study (Table 3) are based on model results using the segmented power-law continuum, mentioned above. The metallicities based on the other spectral shapes deviate % from the values derived for a broken power-law continuum. The largest deviations occur for the N v/He ii line ratio. This line ratio is quite sensitive to the temperature of the gas and on the ionizing continuum shape. However, Hamann & Ferland (1993) and Ferland et al. (1996) showed that this line ratio provides a firm lower limit on N/He when adopting a BELR ionization parameter that maximizes the predicted N v/He ii line ratio, e.g. a hard power-law continuum ().
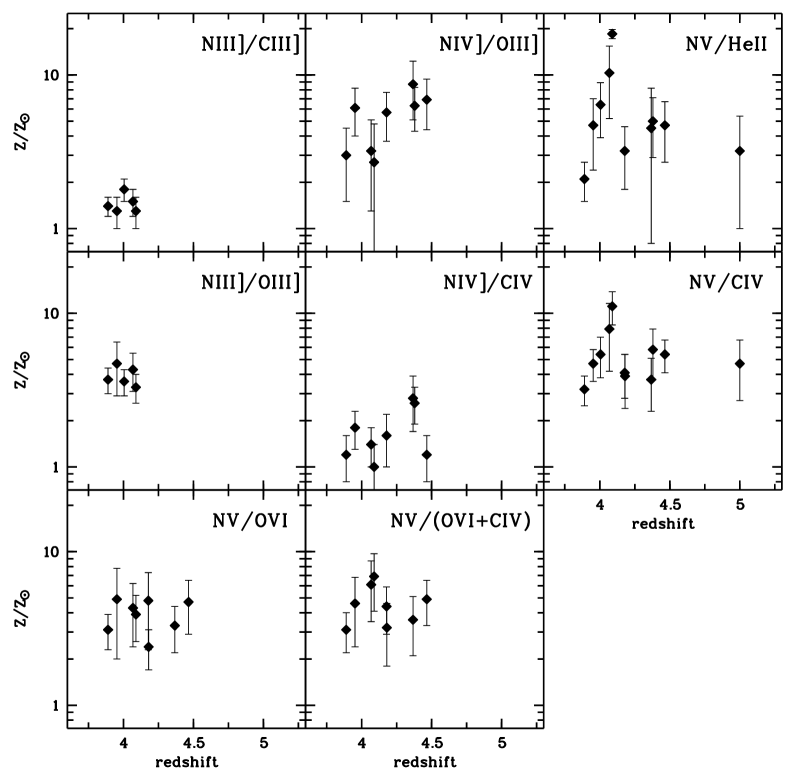
Ratios of the line fluxes in Table 2 were transformed to metallicity estimates of the gas using Figure 5 in Hamann et al. (2002). The chemical composition of the gas as provided by each of the emission line ratios is plotted as a function of redshift in Figure 3. The most suited line ratios, N iii]/O iii] and N v/(O viC iv), as well as N v/O vi, N v/C iv, yield consistent metallicity estimates. The errors of the metallicities, given in Table 3, were derived from the errors of the line flux measurements. These uncertainties were used to calculate the uncertainty of the line ratios which yields the range of metallicities for a given line ratio, using the results presented in Hamann et al. (2002).
In particular, gas metallicities based on N iii]/O iii] and N v/(O viC iv) agree within %. The ratio N iii]/C iii] tends to indicate lower metallicities than the other line ratios. This may be due to the fact that the ratio depends more on the temperature of the gas than N iii]/O iii]. Furthermore, the critical densities of N iii] and C iii] differ by more than a factor of 2. Hence, this line ratio is not as robust as N iii]/O iii], since uncertainties are introduced if the emission is received from spatially different parts of the line emitting region with different physical conditions (Hamann et al. 2002). Overall we conclude that the line ratios involving N iii] and N v provide quite consistent estimates of the gas metallicity for quasars.
|
||||||||||||||||||||||||||||||||||||||||||||||||||||||||||||||||||||||||||||||||||||||||||||||||||||||||||||||||||||||||||||||||||||||||||||||
For a few quasars we could also compare the metallicities based on N iv]/O iii] with the results using ratios including N iii] and N v, respectively. The metallicities we obtained using N iv]/O iii] are in agreement with the chemical composition of the gas based on N iii] and N v line ratios to within %. However, the metallicities obtained by analyzing N iv]/C iv are lower than the other ratios (Table 3, Figure 3). The tendency to significantly lower metallicity estimates based on N iv]/C iv was also noted by Shemmer & Netzer (2002). This is presumably due mostly to the difficulty in measuring the line flux of the weak N iv] emission line. In particular, for quasars with broad emission line profiles the N iv] line is located in the outer wing of the C iv profile. With a typical strength of about % of the C iv line flux for solar metallicities, this line can be well hidden in the outer blue wing of C iv. The physical reason for the discrepancy is not understood. However, it is important to keep in mind that this emission line ratio compares an intercombination line to a strong permitted line which may originate under different physical conditions.
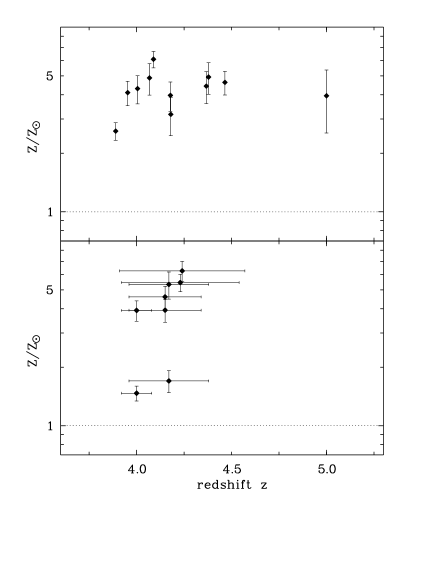
For each quasar, we used all of the available metallicity estimates based on the individual emission line ratios to calculate the mean metallicity. With the exceptions of SDSS 0338+0021 and Q 2133-4625, 4 to 8 individual estimates were averaged. The resulting metallicities are typically several times solar (Table 3). The mean metallicity for each quasar, given as the average of the individual estimates, is shown as a function of redshift in Figure 4. The overall average gas chemical composition for the 11 high redshift quasars, using these mean metallicity estimates, is . 222Recent studies on the photospheric solar abundance indicate carbon and oxygen are about 30 % lower than the values given by Grevesse & Sauval (1998), while the nitrogen abundance remains nearly unchanged within the errors (Holweger 2001; Allende Prieto et al. 2001). Hence, this might result in a reduced estimate of the supersolar abundances for the high redshift quasars by %. We also calculated the mean metallicity given by each line ratio (Table 3, last line). The most robust metallicity indicators, N iii]/O iii] and N v/(O viC iv), infer quite consistent metallicities for this small sample of high-z quasars. Although the less suited line ratios, N iii]/C iii] and N iv]/C iv, indicate a lower metallicity, it is still at least solar.
The emission line ratios indicate that the gas chemical composition of the BELR at redshifts is several times solar and at least of solar metallicity. In an ongoing study we are investigating the reason for the lower metallicities inferred using N iv]/C iv and N iii] /C iii] compared to the robust line ratios N iii]/O iii] and N v/(O viC iv) to obtain solid measurements of the metallicity.
4 Discussion
The supersolar metallicities we derived for the emission line gas in quasars at provide valuable information about the preceding star formation epoch. This early star formation epoch may well correspond to the beginning of major star formation in the host galaxies. In the context of one-zone chemical evolution models (e.g., Hamann & Ferland 1992, 1993; Padovani & Matteucci 1993; Matteucci & Padovani 1993), as well as in more recent multi-zone models (Gnedin & Ostriker 1997; Friaça & Terlevich 1998; Granato et al. 2001; Romano et al. 2002) which take into account the feedback of the dynamical and chemical evolution of the forming galaxies, super-solar metallicities of the gas closely related to quasars at high redshifts () can be expected. To achieve the observed high metallicities, the single-zone and multi-zone models indicate evolutionary time scales for a major star formation episode of Gyrs.
Based on the overall mean metallicities of of the high-redshift quasars in this study () and the time scale for the star formation necessary to enrich the gas, the epoch of the first star formation can be estimated. A redshift corresponds to an age of the universe of less than Gyrs ( km s-1 Mpc-1, , ). An evolution time scale of Gyrs implies that the first major star formation in the quasars studied here must have started at . It is interesting to note that this is also the epoch that is supposed to mark the re-ionization of the universe (Haiman & Loeb 1998; Becker et al. 2001; Fan et al. 2002).
Comparable high metallicities were measured for a small sample of quasars at (Dietrich et al. 1999; Dietrich & Wilhelm-Erkens 2000), for a large sample with (Hamann & Ferland 1993), and for 70 quasars with (Dietrich et al. 2002, in prep.). In particular, there is no decline in metallicity from to . This can be taken as an indication that the formation of massive spheroidal systems, accompanied by intense star formation, starts at and continues until (Madau et al. 1996; Steidel et al. 1999). At the end of the first major star formation episode, which lasts for Gyrs, quasar activity starts in environments that are already highly enriched (e.g., Granato et al. 2001; Romano et al. 2002).
5 Conclusion
We observed a sample of 11 high redshift quasars with at low spectral resolution. We used several emission-line fluxes ratios involving carbon, nitrogen, oxygen, and helium to estimate the metallicity of the line emitting gas. To transform the observed line ratios into metallicities we used the results of detailed photoionization calculations (Hamann et al. 2002). The emission line ratios involving N iii] and N v provide generally consistent estimates of the gas metallicity for quasars. In particular, the results based on N iii]/O iii], N v/(O viC iv), N v/O vi, and N v/C iv differ by less than %. The average metallicity for the 11 high redshift quasars in our sample is . We placed these results in the context of chemical evolution models presented by Hamann & Ferland (1993) and Friaça & Terlevich (1998). For an evolution/enrichment time scale of approximately Gyrs, we estimate that the first major star formation must have begun in these environments at a redshift of , i.e., at a cosmic age of less than 1 Gyr ( km s-1 Mpc-1, , ).
Acknowledgements.
We are grateful to our colleagues J.A. Baldwin, G.J. Ferland, and K.T. Korista for helpful discussions. MD and FH acknowledge support from NASA grant NAG 5-3234 and NSF grant AST-99-84040 (University of Florida). JH and MD were also supported by the grants SFB 328 D and SFB 439 (Landessternwarte Heidelberg). MV gratefully acknowledges financial support from the Columbus Fellowship.References
- (1) Allende Prieto, C., Lambert, D.L., & Asplund, M. 2001, ApJ, 556, L63
- (2) Andreani, P., La Franca, F., & Cristiani, S. 1993, MNRAS, 261, L35
- (3) Arimoto, N. & Yoshii, Y. 1987, A&A, 173, 23
- (4) Baldwin, J.A. & Netzer, H. 1978, ApJ, 226, 1
- (5) Becker, R.H., et al. 2001, AJ, 122, 2850
- (6) Burstein, D. & Heiles, C. 1982, AJ, 87, 1165
- (7) Carilli, C.L., Bertoldi, F., Omont, A., Cox, P., McMahon, R.G., & Isaak, K.G. 2001, AJ, 122, 1679
- (8) Cen, R. & Ostriker, J.P. 1999, ApJ, 519, L109
- (9) Connolly, A.J., Szalay, A.S., Dickinson, M., Subbarao, M., & Brunner, R.J. 1997, ApJ, 486, L11
- (10) Davidson, K. 1977, ApJ, 218, 20
- (11) Dickinson, M. 1998, in “The Hubble Deep Field”, STScI Symp., eds. M. Livio, S. Fall, & P. Madau, p.219
- (12) Dietrich, M., Appenzeller, I., Vestergaard, M., & Wagner, S.J. 2002a, ApJ, 564, 581
- (13) Dietrich, M., Appenzeller, I., Wagner, S.J., et al. 1999, A&A, 352, L1
- (14) Dietrich, M., et al. 2002b, ApJ, 581, in press
- (15) Dietrich, M. & Wilhelm-Erkens, U. 2000, A&A, 354, 17
- (16) Fan, X., et al. 1999, AJ, 118, 1
- (17) Fan, X., Narayanan, V.K., Strauss, M.A., White, R.L., Becker, R.H., Pentericci, L., & Rix, H.-W. 2002, AJ, 123, 1247
- (18) Ferland, G.J., Baldwin, J.A., Korista, K.T., Hamann, F., Carswell, R.F., Phillips, M., Wilkes, B., & Williams, R.E. 1996, ApJ, 461, 683
- (19) Ferland, G.J., Korista, K.T., Verner, D.A., Ferguson, J.W., Kingdon, J.B., & Verner, E.M. 1998, PASP, 110, 761
- (20) Friaça, A.C.S. & Terlevich, R.J. 1998, MNRAS, 298, 399
- (21) Gaskell, C.M., Shields, G.A., & Wampler, E.J. 1981, ApJ, 249, 443
- (22) Gebhardt, K., et al. 2000, ApJ, 543, L5
- (23) Gnedin, N.Y. & Ostriker, J.P. 1997, ApJ, 486, 581
- (24) Granato, G.L., Silva, L., Monaco, P., Panuzzo, P., Salucci, P., De Zotti, G., & Danese, L. 2001, MNRAS, 324, 757
- (25) Grevesse, N. & Sauval, A.J. 1998, Space Sci.Rev., 85, 161
- (26) Haiman, Z. & Loeb, A. 1998, ApJ, 503, 505
- (27) Hamann, F. 1997, ApJS, 109, 279
- (28) Hamann, F. & Ferland, G.J. 1992, ApJ, 381, L53
- (29) Hamann, F. & Ferland, G.J. 1993, ApJ, 418, 11
- (30) Hamann, F. & Ferland, G.J. 1999, ARA&A, 37, 487
- (31) Hamann, F., Korista, K.T., Ferland, G.J., Warner, C., & Baldwin, J.A. 2002, ApJ, 564, 592
- (32) Hamuy, M., Walker, A.R., Suntzeff, N.B., Gigoux P., Heathcote, S.R., & Phillips, M.M. 1992, PASP, 104, 533
- (33) Holweger, H. 2001, in Joint SOHO/ACE workshop “Solar and Galactic Composition”, ed. R.F. Wimmer-Schweingruber, AIP Conf.Proc. Vol.598, p.23
- (34) Horne, K. 1986, PASP, 98, 609
- (35) Isaak, K.G., McMahon, R.G., Hils, R.E., & Withington, S. 1994, MNRAS, 269, L28
- (36) Izotov, Y.I. & Thuan, T.X. 1999, ApJ, 511, 639
- (37) Kaspi, S., Smith, P.S., Netzer, H., Maoz, D., Jannuzi, B.T., & Giveon, U. 2000, ApJ, 533, 631
- (38) Kauffmann, G. & Haehnelt, M.G. 2000, MNRAS, 311, 576
- (39) Kormendy, J. & Richstone, D. 1995, ARA&A, 33, 581
- (40) Kormendy, J. & Gebhardt, K. 2001, in AIP conf.proc. Vol.586, 20th Texas Symposium on relativistic Astrophysics XIX, eds. J.C. Wheeler & H. Martel, p.363
- (41) Laor, A., et al. 1994, ApJ, 420, 110
- (42) Laor, A., Fiore, F., Elvis, M., Wilkes, B.J., & McDowell, J.C. 1997, ApJ, 477, 93
- (43) Lilly, S.J., Le Fèvre, O., Hammer, F., & Crampton, D. 1996, ApJ, 460, L1
- (44) Madau, P., Ferguson, H.C., Dickinson, M.E., Giavalisco, M., Steidel, C.C., & Fruchter, A. 1996, MNRAS, 283, 1388
- (45) Magorrian, J., Tremaine, S., & Richstone, D. 1998, AJ, 115, 2285
- (46) Mathews, W.G. & Ferland, G.J. 1987, ApJ, 323, 456
- (47) Matteucci, F. & Padovani, P. 1993, ApJ, 419, 485
- (48) Merritt, D. & Ferrarese, L. 2001, ApJ, 547, 140
- (49) Möhler, S., Seifert, W., Appenzeller, I., & Muschielok, B. 1995, in ESO Workshop “Calibrating and Understanding HST and ESO Instruments”, ed. P. Benvenuti, ESO, p.145
- (50) Omont, A., Cox, P., Bertoldi, F., McMahon, R.G., Carilli, C., & Isaak, K.G. 2001, A&A, 374, 371
- (51) Omont, A., McMahon, R.G., Cox, P., Kreysa, E., Bergeron, J., Pajot, F., & Storrie-Lombardi, L.J. 1996, A&A, 315, 1
- (52) Osmer, P.S. 1980, ApJ, 237, 666
- (53) Padovani, P. & Matteucci, F. 1993, ApJ, 416, 26
- (54) Pagel, B.E.J. & Edmunds, M.G. 1981, ARA&A, 19, 77
- (55) Petitjean, P., Rauch, M., & Carswell, R.F. 1994, A&A, 291, 29
- (56) Pettini, M. 1999, in Proc.of ESO Workshop “Chemical Evolution from Zero to High Redshift”, ed. J. Walsh & M. Rosa, LNP, p.233
- (57) Romano, D., Silva, L., Matteucci, F., & Danese, L. 2002, MNRAS, 334, 444
- (58) Salucci, P., Szuszkiewicz, E., Monaco, P., & Danese, L. 1999, MNRAS, 307, 637
- (59) Savage, B.D. & Mathis, J.S. 1979, ARA&A, 17, 73
- (60) Schwarz, H.E. & Melnick, J. 1993, The ESO Users Manual, p.24
- (61) Shemmer, O. & Netzer, H. 2002, ApJ, 567, L19
- (62) Shields, G.A. 1976, ApJ, 204, 330
- (63) Steidel, C.C., Adelberger, K.L., Giavalisco, M., Dickinson, M., & Pettini, M. 1999, ApJ, 519, 1
- (64) Telfer, R.C., Zheng, W., Kriss, G.A., & Davidsen, A.F. 2002, ApJ, 565, 773
- (65) Tinsley, B.M. 1979, ApJ, 229, 1046
- (66) Tinsley, B.M. 1980, Fundam. Cosmic Phys., 5, 287
- (67) Tremaine, S., et al. 2002, ApJ, 574, 740
- (68) Tresse, L. & Maddox, S.J. 1998, ApJ, 495, 691
- (69) Uomoto, A. 1984, ApJ, 284, 497
- (70) van Zee, L., Salzer, J.J., & Haynes, M.P. 1998, ApJ, 497, L1
- (71) Vestergaard, M. & Wilkes, B.J. 2001, ApJS, 134, 1
- (72) Warner, C., Hamann, F., Shields, J.C., Constantin, A., Foltz, C.B., & Chaffee, F.H. 2002, ApJ, 567, 68
- (73) Wheeler, J.C., Sneden, C., & Truran, J.W. 1989, ARA&A, 27, 279
- (74) Zheng, W., Kriss, G.A., Telfer, R.C., Grimes, J.P., & Davidson, A.F. 1997, ApJ, 475, 469