F–92195 Meudon Cedex 22institutetext: European Southern Observatory, Santiago, Chile 33institutetext: X-ray Astronomy Group, Department of Physics and Astronomy, University of Leicester, Leicester LEI 7RH
Near IR Spectroscopy of Active Galactic Nuclei.††thanks: Based on observations collected at the Very Large Telescope (UT1) of the European Southern Observatory, Paranal, Chile, ESO NO 63.A-0366
Using the VLT together with the near infrared instrument
ISAAC, we have obtained medium spectral and high spatial resolution
observations of a sample of nearby Seyfert galaxies in the
H-band. This band is particularly suited for stellar population
studies since the stellar component dominates over the AGN
nucleus. The H-band also includes the peak contribution from cool
stars. The AGN spectra are very rich in strong metallic lines which
are sensitive to stellar luminosity class.
For 4 out of 5 galaxies the central velocity dispersions are found
to be significantly lower than reported in previous
studies. Gradients in the stellar population within the central
regions were searched for, together with evidence for dilution of
the stellar spectral features within the nucleus.
Key Words.:
Galaxies: stellar content – Galaxies: active – Methods: data analysis – Infrared: galaxies1 Introduction
An important unsolved issue in understanding the Seyfert phenomenon is the relation between the host galaxy and the properties of activity within the nucleus.
A number of studies carried out at many wavelengths have identified a connection between the presence of an active nucleus and the presence of strong star formation within the host galaxy. These studies found evidence for young or intermediate age populations in Seyfert 2 galaxies which contribute significantly to the central near-infrared emission (e.g. Oliva et al., 1999; Heckman et al., 1997; Gonzalez Delgado et al., 2001).
The existence of a relationship between stellar population and activity type was suggested based on results of our study of the stellar population of a sample of 12 galaxies covering a range of morphology types and nuclear activities (Boisson et al., 2000). The picture emerging from our stellar population synthesis is that of an evolutionary sequence rather than a strict unified scheme for Active Galactic Nuclei (AGN). Indeed, differences in the stellar populations within the nuclear regions are found to follow the degree of nuclear activity. Seyfert 2 galaxies appear to exhibit fossil star formation activity, i.e. a stellar population younger than found in normal galaxies, but somewhat older and more metal-rich than found in starburst galaxies. LINERs have evolved metal-rich stellar populations with no recent star formation. These findings may suggest intrinsic differences between galaxies of different degrees of activity. In particular the Seyfert 2s could be at an earlier stage in the evolutionary development of low luminosity AGN.
It is therefore of primary importance to define the stellar populations both within the nucleus and in the surrounding regions of nearby AGN, with good spatial resolution.
It is also important to cover a wide spectral range in order to include a large number of spectral features sensitive to various stellar atmosphere parameters. The spectral variations are generally complex and therefore many different lines must to be considered in order to avoid ambiguities in the interpretation. As an example, the near-IR CaII triplet and the IR CO and Si indices can be strong not only in supergiant stars but also in metal rich giants; colour gradients can be caused either by changing stellar populations or by dust effects. For these and other reasons stellar population synthesis is better constrained by using observations over a broad wavelength range.
The near-infrared range is a very useful domain to study the stellar content of active galaxies. In particular the H-band is well suited as the non-stellar contribution (mainly reprocessed nuclear emission by dust) is much less than in the K window. For example, it has been shown by Origlia et al. (1993) that in the Seyfert 2 nucleus of NGC1068 the non-stellar contribution is only 30 within the H-band whereas it is about 80 in the K-band. The H-band is also the region in which emission from cool stars peak, and the extinction by dust is lower than for the shorter wavelength J-band.
Moreover, restricting H-band observations to the region 1.57–1.64 m, which is free of strong AGN emission lines, allows us to sample the stellar content of the very nucleus, unlike the situation in the optical for type 1 objects, where strong broad emission lines seriously mask the stellar features. Dallier et al. (1996) have pointed out the presence, in the H-band, of very good luminosity discriminators for stars later than K0. The advantage of these discriminators is that the relevant lines lie close together in wavelength, so that they can be observed at the same time and furthermore their ratio is not affected by dilution from dust emission.
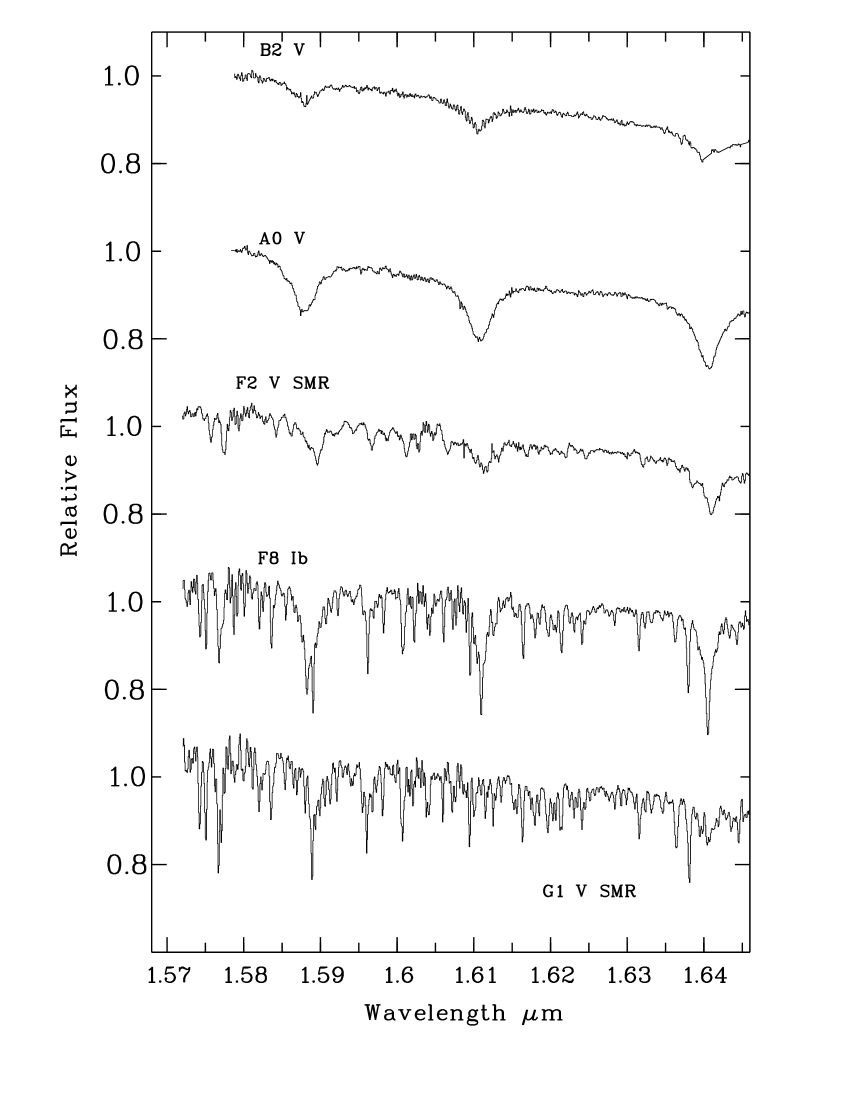
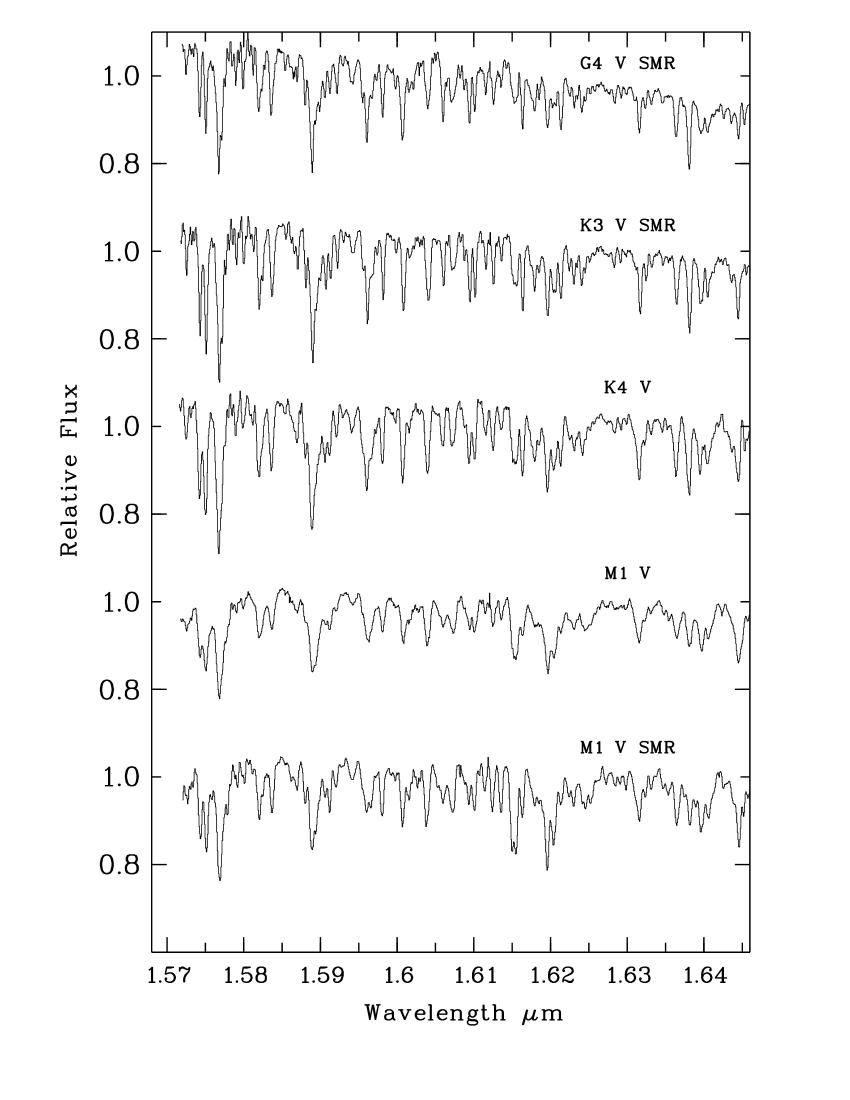
In this paper we present medium resolution () H-band spectroscopy for five Seyfert galaxies of type 1 and type 2. The spectra of several stars obtained under the same conditions are also presented; these serve to extend the stellar library, for the same wavelength range and at a similar spectral resolution, as previously published by Dallier et al. (1996), for the purpose of stellar population synthesis. The observations and data reduction are described in Sect. 2, results are reported in Sect. 3 and a short discussion is given Sect. 4. The star spectra are presented in Appendix A.
2 Observations and Data Reduction
We obtained, in service mode, long slit -band spectroscopy of the central regions of a sample of AGN using the ISAAC specrograph mounted on the VLT/ANTU telescope (Cuby et al., 2000; Moorwood et al., 1999). The spectral region, 1.57–1.64 m, covered using one grating position includes many metallic stellar features. During the observations the seeing varied between 0.6 and 1 arcsec. Using a slit width of 1 arcsec we obtained a spectral resolution of 4.5Å FWHM with a spectral sampling of 0.79Å. The spatial sampling is 0.147 arcsec/pixel.
In Table 1 we list the observed galaxies, their morphological and Seyfert type, redshift, distance in Mpc (assuming Ho=75km/s/Mpc and qo=0.0), colour excess due to Galactic interstellar reddening and the velocity dispersion within the central region together with its publication reference. The values of E(B-V) have been evaluated using the Galactic hydrogen column density derived from the 21cm survey of Schlegel et al. (1998).
Each galaxy was observed for a total of 3hrs (DIT=600sec. 2 (for position and ) 3 AB cycles 3 = 3hrs). We observed using the nodding mode: the objects in exposures “” and“” were centered 120 arcsec apart, the observed infrared extent of the sample galaxies being less than that (the sky emission dominated beyond an extent of 10 arcsec). This set-up allowed us to use the differential comparison ( and ) to subtract the dark, bias and sky contribution from all exposures. We also observed a set of early type stars to use in the removal of telluric features, and a set of cool stars for the flux calibration.
| galaxy | morphology | Seyfert | z | D | E(B-V) | Epoch | Ref. | |
|---|---|---|---|---|---|---|---|---|
| type | Mpc | (km s-1) | ||||||
| NGC 2992 | Sa | 2 | 0.0077 | 31 | 0.06 | 05/04/1999 | 15813 | NW |
| 188-218 | OOMM | |||||||
| NGC 3185 | SBa | 2 | 0.0041 | 16 | 0.03 | 05/08/1999 | 6120 | NW |
| NGC 3783 | SBa | 1 | 0.0098 | 40 | 0.12 | 05/02/1999 | 138-165 | OOKM |
| NGC 6221 | SBbc | 2 | 0.0047 | 19 | 0.17 | 05/01/1999 | 120-140 | VB |
| MCG-06-30-015 | E | 1 | 0.0077 | 31 | 0.06 | 05/05/1999 | 153-165 | OOMM |
Ref.: NW: Nelson & Whittle, 1995; OOMM: Oliva et al., 1999; OOKM: Oliva et al., 1995; VB: Vega-Beltrán et al., 1998.
| star | type | [Fe/H] | Ref. |
|---|---|---|---|
| HD 11507 | M1V | - | |
| HD 36395 | M1V | 0.60 | CS |
| HD 39715 | K3V | 0.33 | BG |
| HD 48501 | F2V | 0.01 | CS |
| HD 93250 | O6 | - | |
| HD 106116 | G4V | 0.15 | FMS |
| HD 112164 | G1V | 0.24 | CS |
| HD 121790 | B2V | - | |
| HD 131977 | K4V | 0.01 | CS |
| HD 139717 | F8Ib | 0.18 | SKC |
| HD 159217 | A0V | - |
Ref.: BG: Barbuy & Grenon, 1990; CS: Cayrel de Strobel et al., 1997; FMS: Favata et al., 1997; SKC: Soubiran et al., 1998.
In Table 2 we list the stars observed, their spectral type and luminosity class and, where known, the metallicity together with the published reference. A dash symbol for the metallicity indicates that no [Fe/H] information is available. The spectra are presented in Annex A.
There follows a brief description of the reduction and analysis procedures applied to our data using MIDAS, IRAF and also some additional routines from an early version of the Eclipse reduction package (Devillard, 1997).
The data were first corrected for the “electrical ghost” features generated by the detector, using the is-ghost routine provided in the Eclipse package. The data were then flat-fielded using a master flat field image (this pixel to pixel correction is particularly critical for our data as the frames show features which disappeared after the major ”repair” of ISAAC in February 2000). Using the IRAF package we then corrected for distortions along and perpendicular to the slit, using the nuclei of the galaxies together with the calibration stars observed, as no star-trace exposures were provided by ESO at that time. Individual exposures are then combined using the spjitter routine of the Eclipse package.
Throughout the spectral region of our observations, there are many bright OH lines that can be used to perform a wavelength calibration of the exposures. This calibration was carried out using the MIDAS package as it was found to be non-linear. Precision to about 1/7th of a pixel was achieved.
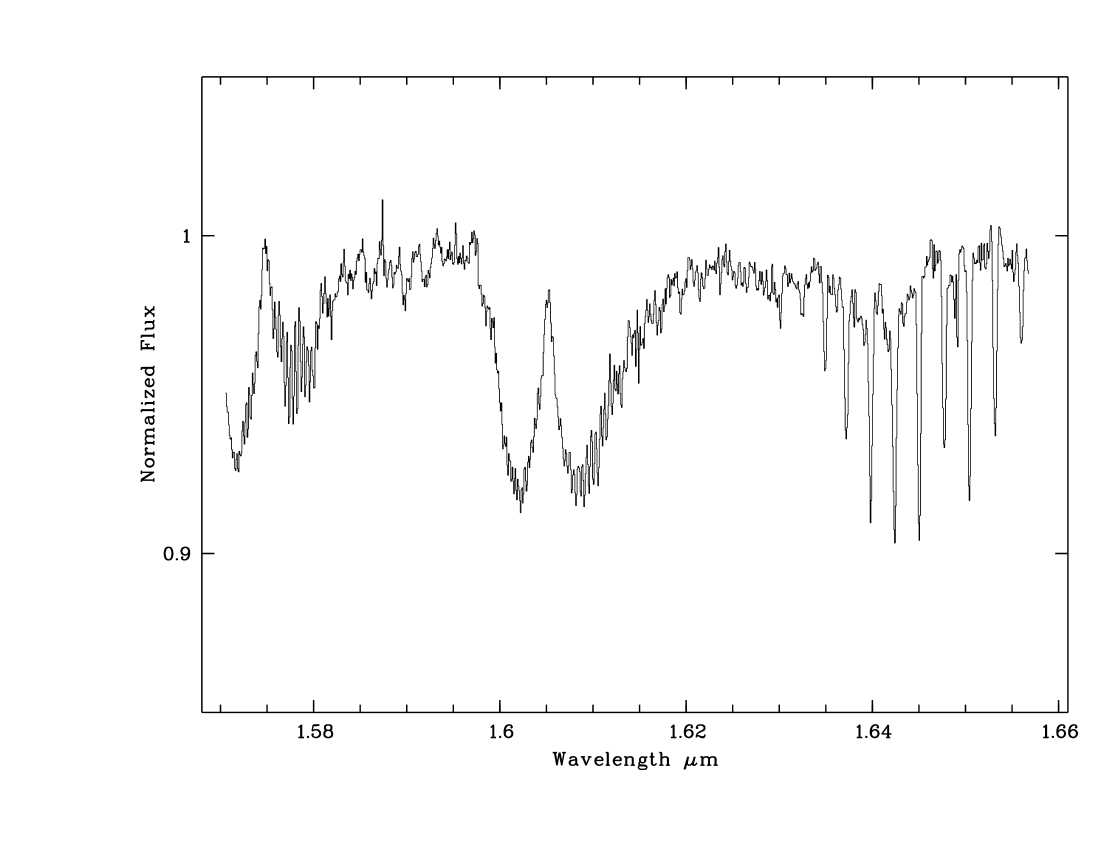
The 1-D spectra were then extracted from the 2-D frames and corrected for telluric absorption using the early type stellar templates, taking into account the differential airmass. An example of the telluric spectrum is shown in Fig. 1. The overall shape of stellar spectra of the early type and of cool stars we observed were compared to the model spectra taken from Hauschildt et al. (1999a,b) in order to derive relative flux calibrations. The final stellar spectra were found to be in agreement within a few percent, over the full wavelength range, with those from our stellar library (Dallier et al, 1996). Photometric calibration was achieved by using aperture magnitudes taken from the literature (Kotilainen et al., 1992; Glass & Moorwood, 1985) and by appropriate scaling of the extracted spectra for the corresponding aperture. No photometric data could be found for NGC 3185, and so only relative fluxes are displayed.
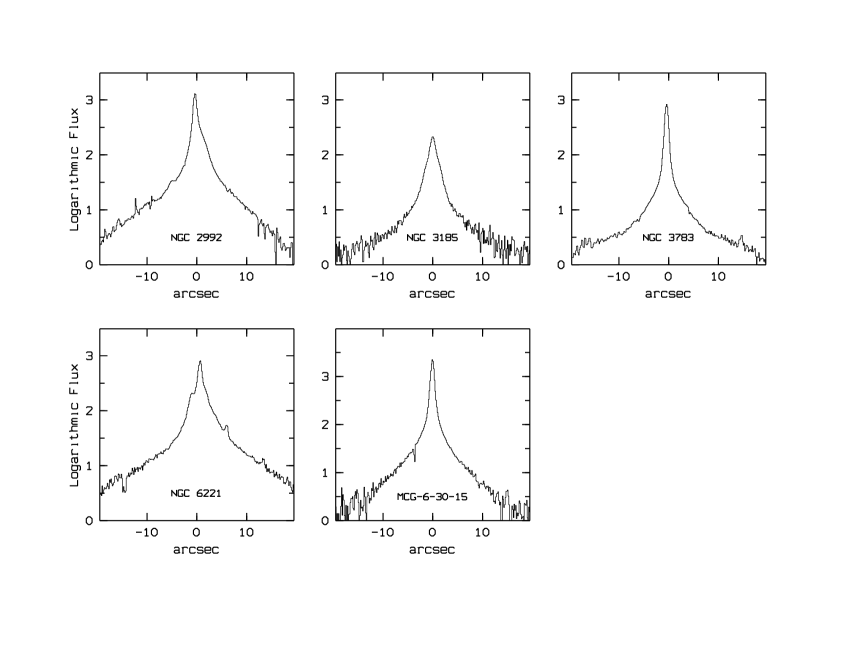
Logarithmic flux profiles across the galaxy 2D-spectra (Fig. 2) were used to determine where to extract the 1D spectra of the nucleus and the regions around it. The optimum number of rows to be summed depends on the seeing. When the spectra of two symmetric regions lying on either side of the nucleus were found to be very similar, indicating that the stellar population of a galaxy is homogeneous, we averaged them together to obtain a mean spectrum. Figures 3 to 7 show the spectra extracted from the five galaxy frames: the nucleus and the surrounding regions. All of the spectra displayed are corrected to the rest wavelengths.
A detailed identification of the absorption features observed in the stars and the galaxies was carried out using the solar spectrum published by Livingston & Wallace (1991). The observed wavelengths and identifications are listed in Table 3. Numerous lines of neutral species are present, in addition to broad features due to the CO and OH absorption bands, as can be clearly seen in Figures 3 to 7.
| Identification | Identification | ||
|---|---|---|---|
| 1.5701 | Br(4-15) | 1.6072 | FeI 1.6072 + OH 1.6070-1.6074 |
| 1.5726 | FeI 1.5724 + OH 1.5727-1.5730 | 1.6095 | SiI 1.6095 |
| 1.5743 | MgI 1.5741 | 1.6102 | FeI 1.6102 |
| 1.5751 | MgI 1.5749 | 1.6112 | Br(4-13) |
| 1.5758 | OH(3,3)P(7) 1.5756 | 1.6116 | FeI 1.6117 |
| 1.5768 | MgI 1.5766 + FeI 1.5770 | 1.6126 | FeI 1.6126 + OH 1.6124 |
| 1.5776 | CO(4-1) 1.5775-1.5784 + OH 1.5778 | 1.6136 | NiI 1.6136 + CaI 1.6137 |
| 1.5791 | FeI 1.5789 | 1.6153 | CaI 1.6150-1.6158 + FeI 1.6153 |
| 1.5800 | FeI 1.5799 | 1.6163 | FeI 1.6165 + SiI 1.6164 |
| 1.5812 | FeI 1.5810 | 1.6180 | FeI 1.6180 |
| 1.5820 | FeI 1.5820 | 1.6186 | CO(6,3) 1.6186 |
| 1.5837 | SiI 1.5834 + FeI 1.5834-1.5840 | 1.6191 | OH 1.6190-1.6192 |
| 1.5856 | FeI 1.5854 | 1.6197 | CaI 1.6198 + FeI 1.6198 |
| 1.5866 | FeI 1.5868 + OH 1.5864 | 1.6205 | FeI 1.6208 + OH 1.6204-1.6207 |
| 1.5871 | FeI 1.5869 | 1.6214 | SiI 1.6216 + FeI 1.6214 |
| 1.5881 | FeI 1.5878 + MgI 1.5880 | 1.6224 | 13CO +OH 1.6224-1.6226 |
| 1.5884 | Br(4-14) | 1.6231 | FeI 1.6232 + OH 1.6216-1.6231 |
| 1.5890 | SiI 1.5888 + OH 1.5885-1.5888 | 1.6241 | SiI 1.6242 |
| 1.5895 | FeI 1.5895 + OH 1.5892-1.5898 | 1.6252 | OH 1.6241-1.6260 |
| 1.5900 | FeI 1.5898 | 1.6270 | OH 1.6266-1.6276 |
| 1.5907 | FeI 1.5905+1.5906 | 1.6283 | FeI 1.6285 |
| 1.5913 | OH 1.5910-1.5913 | 1.6291 | FeI 1.6292 |
| 1.5922 | FeI 1.5921 | 1.6299 | OH 1.6298-1.6300 |
| 1.5942 | FeI 1.5942 | 1.6317 | FeI 1.6316 + OH 1.6312-1.6316 |
| 1.5956 | FeI 1.5954 + MgI 1.5955 | 1.6324 | FeI 1.6325 |
| 1.5961 | SiI 1.5960 | 1.6332 | FeI 1.6332 |
| 1.5967 | FeI 1.5965+1.5968 + OH 1.5968 | 1.6347 | OH 1.6346-1.6348 |
| 1.5982 | CO(5,2) 1.5978 + FeI 1.5981 | 1.6354 | OH 1.6352-1.6355 |
| 1.5999 | FeI 1.5998 | 1.6365 | NiI 1.6363 + OH 1.6365 |
| 1.6008 | FeI 1.6008 | 1.6381 | SiI 1.6381 + FeI 1.6382 |
| 1.6017 | FeI 1.6017 | 1.6396 | FeI 1.6396 |
| 1.6038 | OH(3,1)P(9) 1.6038 | 1.6399 | CO(7,4) 1.6396 |
| 1.6041 | FeI 1.6041 | 1.6406 | FeI 1.6405 + Br(4-12) |
| 1.6061 | SiI 1.6060 + OH 1.6053-1.6065 | 1.6445 | FeI 1.6445 + OH 1.6443-1.6450 |
3 Results
High spectral resolution observations such as this can be used to measure velocity dispersions at different locations within the central regions of the galaxies.
We have employed two different methods to determine stellar velocity dispersions. The first method is similar to that described in Tonry & Davis (1979) i.e. cross-correlation of the galaxy spectrum with template stars is fitted using the autocorrelation function of the star convolved with a Gaussian, with and peak velocity as free parameters. The second method consists of fitting the galaxy spectrum with a template stellar spectrum convolved with a Gaussian. In this case the fit parameters are the of the Gaussian profile and a multiplicative factor to fit the depth of the stellar features. In both cases fitting is performed over the whole wavelength range, using different K and M stellar templates in order to minimize uncertainties introduced by a possible mismatch between the stellar template and the observed galaxy’s stellar population. The use of different K and M stellar templates also allows to account for the errors due to seeing variations between two observations.
The two fitting methods give consistent results. The velocity dispersions and final one sigma errors are displayed in Table 4. These velocity dispersions are quite low. Also, the stellar velocity dispersions are roughly constant in the central regions sampled here. We note that stellar lines are significantly diluted within the nucleus of NGC 3783, and so no velocity dispersion could be derived.
Except for NGC 6221, these low values are in contrast with the bulge velocity dispersions previously published (see Table 1). A similar situation is found for Circinus, with a velocity dispersion of 80 km/s in the central 80 pc observed using 3D (Maiolino et al., 1998) while a value of 168 km/s over the same region was deduced from IRSPEC observations (Oliva et al., 1995). We suggest that these differences indicate an improvement in the measurement of the velocity dispersions, and is due to our higher spectral resolution as well as to the large number of stellar lines sampled in the fitting procedure. Part of the difference between the values measured here using a small aperture compared to previous ones measured in larger apertures may be due to the presence of a rotational component which contributes to the breadth of the features. However recent kinematical profiles of the hosts of some AGN (Emsellem et al., 2001) obtained with ISAAC show that the dispersion remains nearly constant inside the nuclear disk, with low values. For example, in the case of NGC 1808 the dispersion profiles remain in the range 80–120 km s-1 over the central 20 arcsec., while Oliva et al. (1995) measured 154 km s-1 in a 5 arcsec aperture.
The equivalent widths (EW) of strong lines have been commonly used to estimate the relative contribution of AGN and stellar emission in the nucleus of Seyfert galaxies. Following the work of Oliva et al. (1999) in Table 4 we give the EWs for the two stellar features at 1.59m and 1.62m, measured in the nuclear and the off-nuclear spectra of the 5 AGN. These EWs have been measured for the same wavelength domain as discribed in Origlia et al. (1993).
| galaxy | R∗ | EW(1.59m) | EW(1.62m) | ||
|---|---|---|---|---|---|
| pc | (km s-1) | Å | Å | ||
| NGC 2992 | nuc. | 110 | 9518 | 2.7 | 3.2 |
| SW | 225 | 7911 | 3.6 | 4.5 | |
| NE | 225 | 8815 | 3.8 | 4.6 | |
| NGC 3185 | nuc. | 60 | 7513 | 4.2 | 5.8 |
| ring | 120 | 8115 | 3.9 | 5.4 | |
| NGC 3783 | nuc. | 140 | - | 0.9 | 1.6 |
| ring | 280 | 9819 | 1.7 | 3.6 | |
| NGC 6221 | nuc. | 70 | 639 | 2.3 | 3.9 |
| r1 | 120 | 689 | 3.8 | 5.5 | |
| r2 | 270 | 7110 | 3.3 | 5.1 | |
| MCG-06-30-015 | nuc. | 100 | 6914 | 1.1 | 1.8 |
| ring | 200 | 8312 | 2.8 | 3.7 |
* radius for the nuclear region; distance to the center for the off-nuclear region
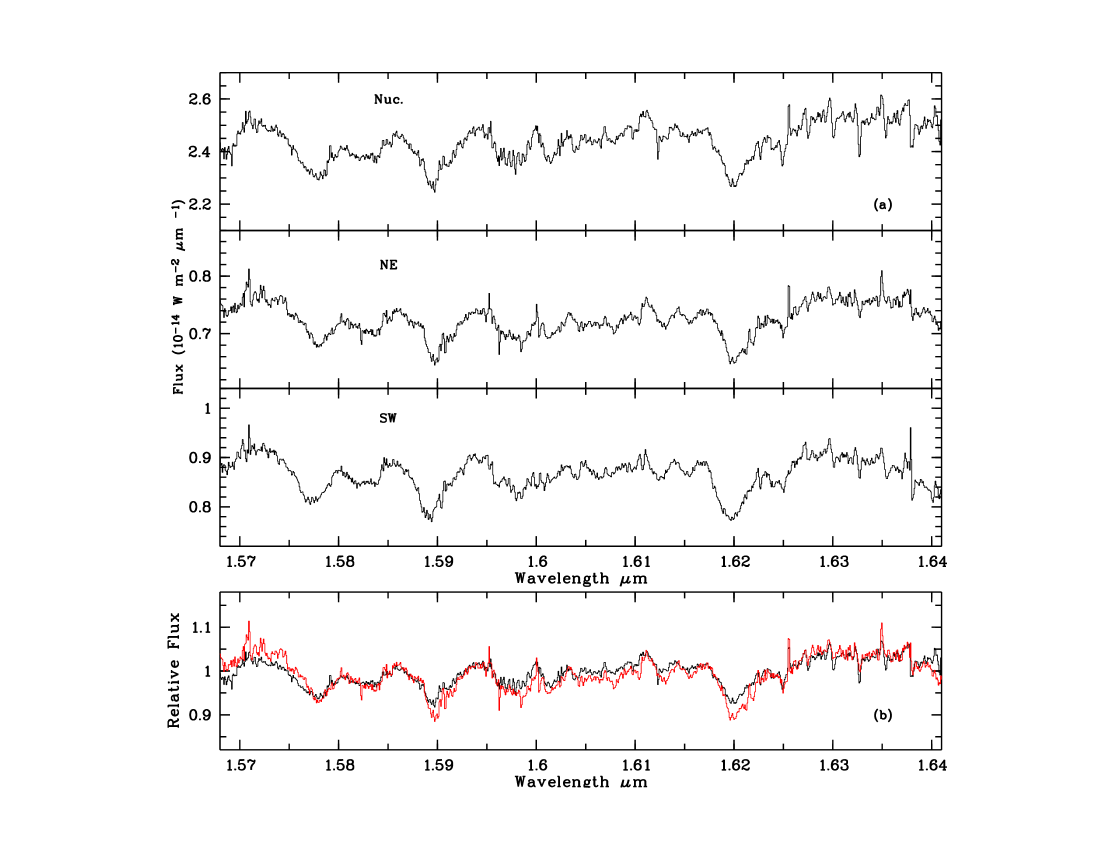
3.1 NGC 2992
The Seyfert 1.9 galaxy NGC 2992 is a Sa galaxy seen almost edge-on and is interacting with NGC 2993. A prominent dust lane extending along the major axis crosses the nucleus of the galaxy (Ward et al., 1980). This galaxy exhibits a biconical galactic-scale outflow, which emerges almost perpendicularly from the plane of the galaxy (Veilleux et al., 2001 and references therein).
From a comparison with Bica’s (1988) templates, Storchi-Bergmann et al. (1990) found an old stellar population of solar metallicity coupled with a small contribution ( 5%) of recent star formation in the inner 5 arcsec. Oliva et al. (1999) deduced from comparison of the features at 1.59m and 1.62m, that the flux from inner 4 arcsec is largely dominated by stellar light with no significant contribution from a starburst. In a more detailed IR adaptive optics study of NGC 2992 Chapman et al. (2000) found that the radial distribution of the CO index indicated a strong population gradient within the core, with the stellar population at the very centre being older than that in the surrounding regions.
The flux profile along PA=55 (Fig. 2) shows a distinct nucleus together with an asymmetric galaxy component. In the inner 5 arcsec, the NE region may be partly absorbed by the dust lane.
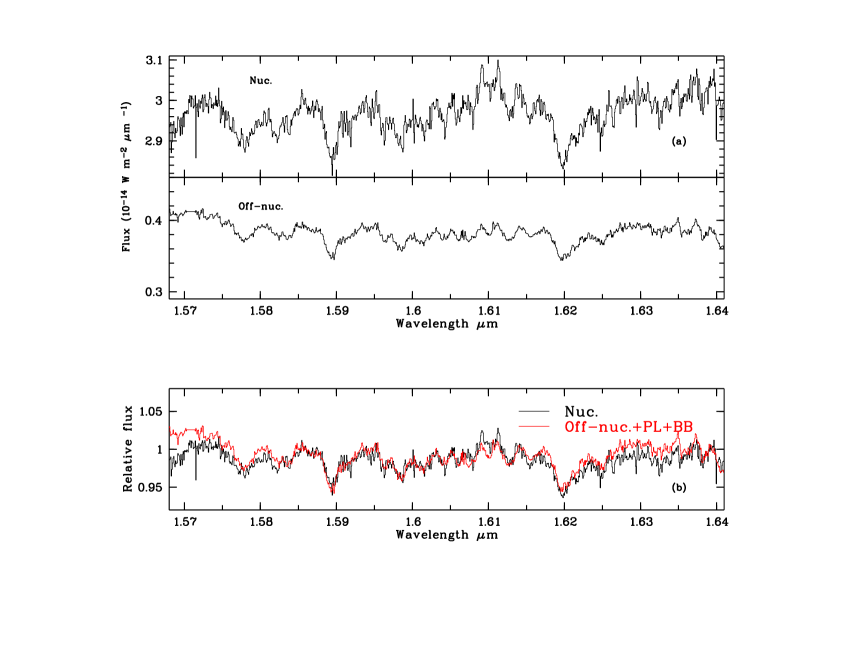
The flux extracted from regions 1.5 arcsec (1” 150pc) from the nucleus (Fig. 3a) have similar stellar spectra but with different kinematics. The emission line gas is known to exhibit two distinct kinematic components, one due to galactic rotation and another resulting from outflow (e.g. Márquez et al., 1998). The stellar features from the SW region are redshifted by 505 km s-1, and those from the NE region are blueshifted by 154 km s-1 with respect to the nucleus, in agreement with the gaseous component of rotation.
The similarity of the spectra from both regions implies an homogeneous stellar population within the bulge of this galaxy. The nucleus of this galaxy is very variable, possibly related to a supernova event (Glass, 1997), and the hot dust component appears to be in the process of increasing at the time of our observations (Gilli et al., 2000). The fraction of stellar light in the nucleus, for the hypothesis of dilution by AGN and/or hot dust emission, is deduced from the comparison of the nuclear EW to that of the surrounding regions. From the EWs in Table 4 we infer up to 30% dilution. But such an analysis can be misleading. Indeed, comparison of the nuclear and off-nucleus spectra over the full wavelength range show that only the OH lines around 1.59m and 1.62m are weaker on the nucleus, while no gradient in line strength is found for the other elements (Fig. 3b). This favours a stellar population gradient rather than dilution by a non-stellar component. Although hot dust emission is not inferred to contribute to the H-band, it is still possible that it may contribute to the K-band emission as found by Gilli et al.
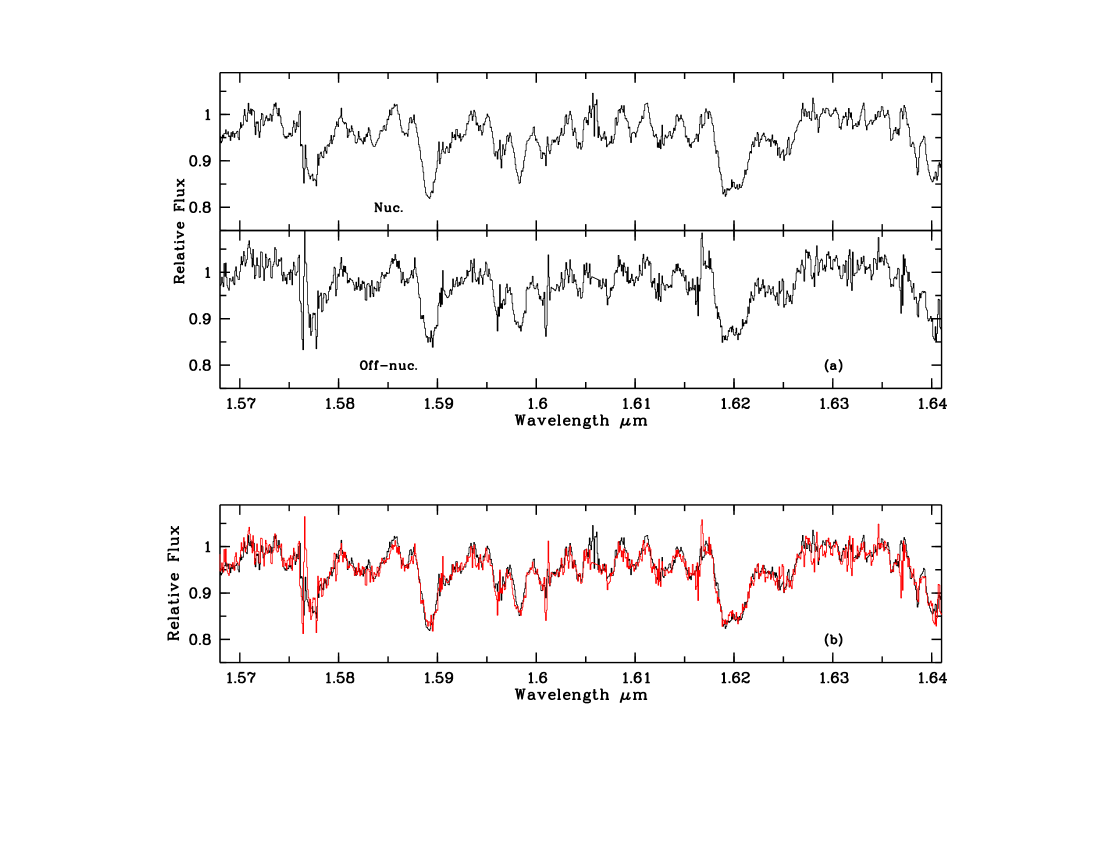
3.2 NGC 3185
NGC 3185 is a so-called transition object (having both Seyfert and HII region characteristics) with a host galaxy of SBa type located in a compact group including NGC 3190 (Gonçalves et al., 1999). To our knowledge, there are no published results on the stellar content of the inner bulge of this galaxy.
The radial flux profile along PA=0 of this galaxy is smooth without a strong nucleus (Fig. 2). In Figure 4a we show the spectra of the nucleus and that of an extended region obtained by averaging together similar data extracted from both sides of the nucleus, 1.5 arcsec away (1” 80pc).
No evidence is found either for a stellar population gradient or dilution by dust (Figure 4b and Table 4).
3.3 NGC 3783
NGC 3783 is a nearly face-on SBa galaxy with a very bright Seyfert 1 nucleus. Winge et al. (1990) found that the stellar population of the bulge is of solar metallicity and mostly old, but with some contribution from intermediate age and moderately young stars.
A strongly peaked nucleus on a faint symmetrical bulge is apparent in Figure 2. The bulge spectrum (1.5 arsec from the nucleus; 1”190pc) exhibits strong stellar absorption lines and the stellar population appears significantly diluted in the nucleus (see Fig. 5a and Table 4).
Within a Seyfert 1 nucleus we might expect that the AGN continuum would dominate over the contribution from the stellar population, and therefore that the stellar features would be heavily diluted by the typical power-law or/and hot dust emission from the AGN. From comparison of the features at 1.59m and 1.62m, Oliva et al. (1999) found 55% stellar contribution to the 4 arcsec nuclear H band flux. Adding the CO 2.29m line information they parametrize the non-stellar flux in terms of a power-law with =3.6 (Fν=) plus a T=930K dust emission.
Another way of testing the dilution hypothesis is to compare the continuum shape of the nuclear and off-nuclear spectra. We approximate the dust emission, within the 1.5”, using blackbody spectra with temperatures ranging from 600K up to the sublimation temperature of around 1500K. A reasonable fit to the nuclear spectrum is obtained with a 50% stellar contribution diluted by 1500K dust emission (see Fig. 5b). However a equally good fit can be obtained using a larger dilution due to both colder dust (600K), plus a typical AGN power-law contribution (=1); which is expected as dust and power-law dilutions have opposite wavelength dependence.
A stellar population gradient is probably also marginally present as the OH and CO lines appear weaker in the nucleus than in the surrounding regions.
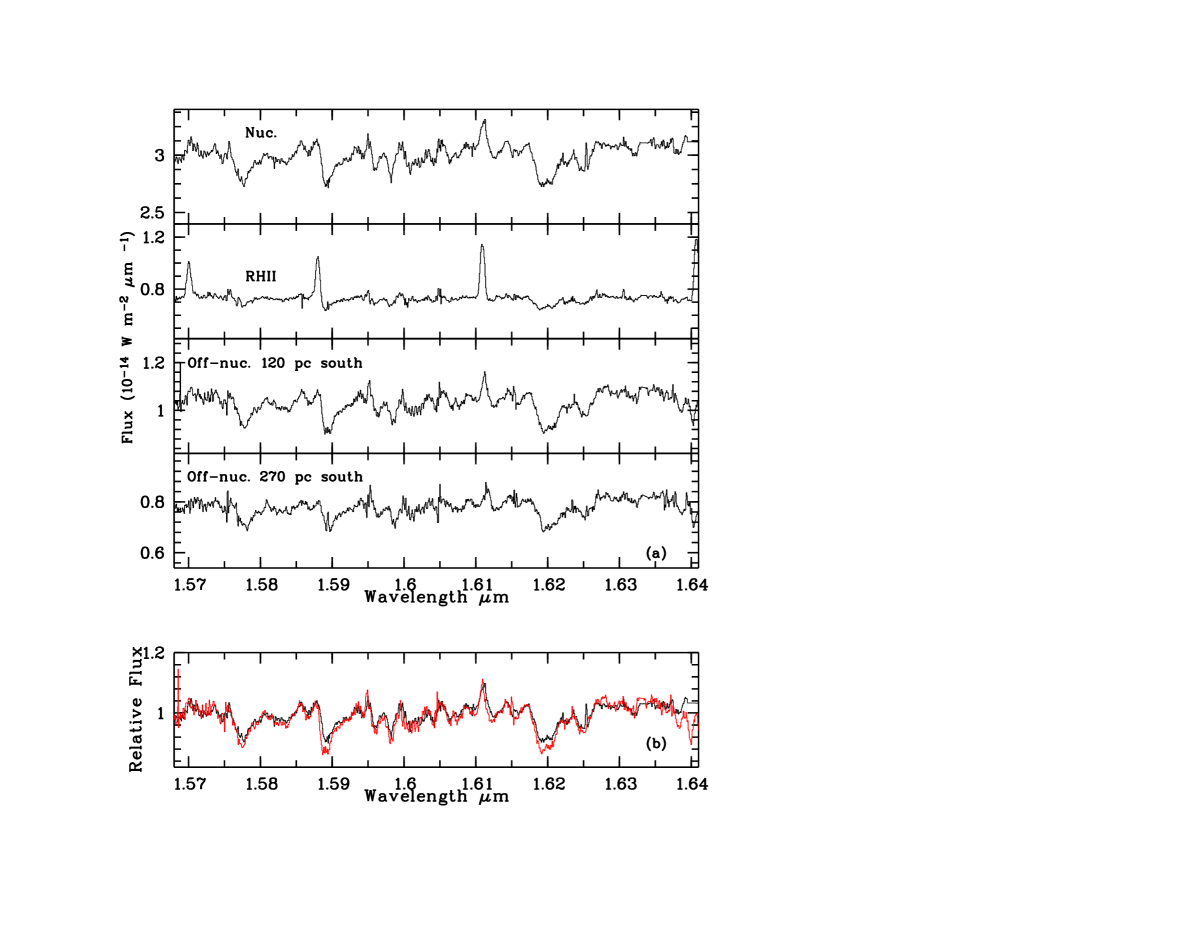
3.4 NGC 6221
NGC 6221 is located within a small galaxy group. The host galaxy is a barred Sbc with a weak Seyfert nucleus. The radio morphology and spectral index of the nucleus and bar are indicative of the presence of supernovae remnants (Forbes & Norris, 1998). This galaxy is known to exhibit clear signs of intense circumnuclear star formation. The optical spectrum of the central 6 arcsec shown in Phillips (1979), exhibits signatures of emission originating from HII regions together with a weak Seyfert nucleus, whereas the underlying continuum is apparently dominated by late type stars. Cid Fernandes et al., (1998) confirms the presence of a nuclear starburst within the central 5 arcsec, with the circumnuclear regions being somewhat older. Levenson et al. (2001) shows that even in the central 1.5x1.5 arcsec, the AGN nucleus is weak relative to surrounding starbursts.
NGC 6221 is the most extended galaxy in our sample, as can be seen from its logarithmic flux profile along PA=30. The conspicuous peak at 1.7 arcsec north from the nucleus (Fig. 2; 1” 90pc) is clearly an HII region.
In addition to the HII region mentioned above, three 1-D spectra were extracted: the nucleus and two regions at 1.3 and 3 arcsec south respectively from the centre (Fig. 6). The stellar features from the regions are blueshifted by 343 km s-1 and 684 km s-1 with respect to the nucleus, in agreement with the kinematics of the stellar component as published by Vega-Beltrán et al. (1998).
From EWs in Table 4 we infer up to 30% of dilution. As for NGC 2992, such an analysis can be misleading: comparison of the nuclear and off-nucleus spectra over the full wavelength range show that only the lines around 1.59m and 1.62m are weaker at the nucleus while all other lines have similar depths (Fig. 6b).
The strong similarity of both off-nuclear spectra suggests an homogeneous stellar population in the bulge. However the stellar component in the very nucleus could be somewhat different. The Brackett (4-13) line, a signature of HII regions, is also conspicuous in all three spectra.
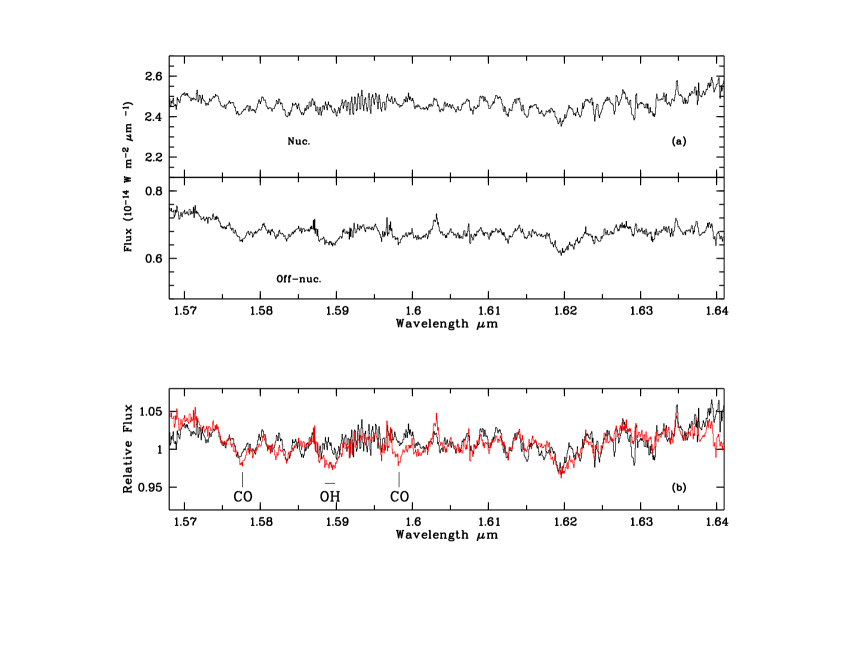
3.5 MCG-6-30-15
The Seyfert 1 MCG-6-30-15 is a very elongated lenticular galaxy. Colour maps show a small dust lane south of the nucleus roughly parallel to the major axis of the galaxy. The central region of the galaxy is much redder than the outer regions (Ferruit et al., 2000).
From a stellar population study based on ultraviolet spectra, Bonatto et al. (2000) claim that an old bulge stellar population is the dominant contributor, with indications of a series of previous bursts of star formation.
The logarithmic flux profile shows a distinct nucleus on a weak, extended galaxy component (Fig. 2). In Figure 7a we show spectra of the nucleus (1.5 arcsec wide; 1” 150pc) and that of an extended region formed by averaging together similar data extracted from both sides of the nucleus, 1.5 arcsec away. The nuclear and circumnuclear regions have similar spectral features although these are weaker in the nucleus. The nuclear spectrum is also redder.
Since the nucleus is a Seyfert 1, it is natural to interpret these differences in terms of dilution by a hot dust component and/or a power-law AGN type continuum. From comparison of the features at 1.59m and 1.62m, Oliva et al. (1999) found 40% stellar contribution to the 4 arcsec nuclear H band flux. Adding the CO 2.29m line information they parametrize the non-stellar flux in terms of a power-law with =2.3 (Fν=) plus a T=1100K dust emission. Within the 1.5 central arcsec we infer a similar dilution (Table 4).
A strong intrinsic reddening (E(B-V)=0.61 to 1.09) in the very nucleus has been previously deduced in multi-wavelength study by Reynolds et al. (1997). Comparing the continuum shape of the full nuclear and off-nuclear spectra, if the lower end of reddening value range is assumed, then dilution by both a black-body and a power-law continuum are needed. However, if a higher value of the reddening is assumed, then dilution by only the power law is necessary. Figure 7b shows the comparison between the nuclear spectrum dereddened by E(B-V)=0.5 and the circumnuclear spectrum diluted by 20% power-law continuum and 30% warm dust.
4 Discussion
We have presented and discussed H-band spectra at a 1.5 arcsec spatial resolution of a sample of three Seyfert 2 and two Seyfert 1 galaxies. It appears that the nuclear spectra are dominated by stars in the Seyfert 2s, while evidence for dilution of their stellar components by hot dust and/or power-law AGN is found in the cases of the Seyfert 1s.
A classical tool used to constrain the luminosity class of the dominant stars in an integrated population is its mass-to-light ratio. Under the assumption that the nuclear mass and luminosity of the galaxy share the same radial dependance (Devereux et al., 1987) and that the measured velocity dispersion does not vary with the size of the aperture used, the IR mass-to-light ratio is simply given as a function of the velocity dispersion, the projected spectrometer aperture and the 1.65m stellar fluxes (see Oliva et al. (1999), equation 3). M/L ratios computed in this way are very dependant on the stellar density and not only on the stellar luminosity, a factor that cannot be ignored especially in these centrally peaked objects.
Such a study requires a large enough sample that statistical biases can average out (e.g. the geometry, inclination, effective radius, distance, and non homogeneity of the central regions). Furthermore L1.65μm is not indicative of LBol so that only comparisons of M/L derived in the same way are meaningful, and absolute values can be misleading. To the best of our knowledge no sample of normal galaxies has been observed in the near IR using a 1 arcsec slit. Previous observations (e.g. Oliva et al. 1999 and references therein) employed a 3 to 5 arcsec aperture preventing a direct comparison unless the light distribution is assumed to be homogeneous, to allow convertion of slit fluxes to aperture fluxes.
Thus mass-to-light ratios can be estimated for only two galaxies from our sample, NGC 2992 and MCG -06-30-15, being the only two to have apparently homogeneous populations surrounding their nucleus (see Sect. 3). Reddening corrected fluxes within 1.5” and 4.5” equivalent apertures have been derived from the 1.5”x1” (nucleus) and 4.5”x1” (”off-nucleus”+”nucleus”) observations. In the case of MCG -06-30-15, a 50% stellar contribution was assumed within the nucleus (see Sect. 3.5). Within the inner regions, quite similar values of M/L, ie. 0.074 and 0.065, are found for NGC 2992 and MCG -06-30-15 respectively. Whereas within the larger aperture the ratios are M/L=0.047 and 0.12 for NGC 2992 and MCG -06-30-15 respectively. Since the typical scatter in M to 1.65 m luminosity for galaxies is a factor of 3 to 4 (see Devereux et al. 1987 and Oliva et al., 1999) no significant difference in age of the stellar population can be deduced. We also note that, albeit at the same distance, the two galaxies have very different effective radii (Re = 17.3” for NGC 2992 and 9” for MCG -06-30-15) implying that different amounts of bulge starlight are enclosed in the fixed apertures. This should be compared with what can be inferred from direct comparison of the detailed spectra.
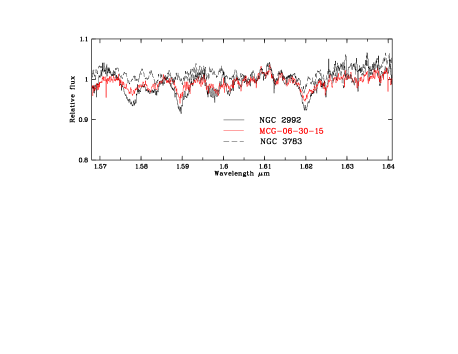
The nuclear spectra, normalised at 1.58m, of the three Seyfert 2 are shown in Figure 8. Strong similarities between NGC 3185 and NGC 6221 are clear, whereas the line profiles of NGC 2992 are obviously different. In Figure 9 it can be seen that the spectrum of NGC 2992 more closely ressembles the Seyfert 1 nuclear spectra, and in particular that of MCG-06-30-15. This is consistent with the fact that NGC 2992 displays other properties associated with a Seyfert 1.9 rather than a prototypical type 2. It is noticeable in Figure 9 that NGC 3783 and MCG-06-30-15 have different stellar populations even though these features are diluted; e.g. note the features around 1.578m (MgI, FeI, CO, OH) and 1.59m (SiI, FeI, OH).
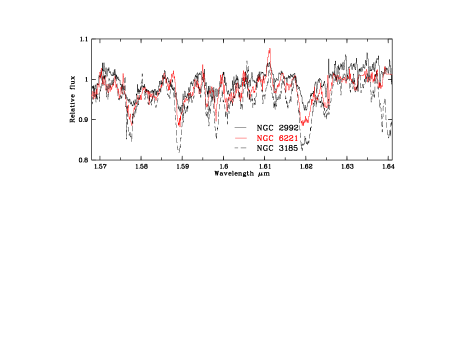
We can also compare circumnuclear spectra extracted from the same physical distance (in pc) from the nucleus. In the Seyfert 2 galaxies, NGC 3185 and NGC 6221, a region at about 120 pc from the centre has been extracted: both spectra are very similar, suggesting that their stellar populations are alike, although the morphological type of their host galaxies are somewhat different (SBa and SBbc, respectively). In MCG-06-30-15 (an E galaxy) and NGC 2992 (a Sa galaxy), regions located at 200-220 pc also show similarities in their spectra. While the two regions 270 pc away from the nucleus observed in NGC 3783 (a Seyfert 1) and NGC 6221 (a Seyfert 2) are significantly different, reflecting different stellar populations due either to the different morphological type of the host galaxy and/or to the influence of their different AGN type. We note that in the visible range, Boisson et al. (2000) and Joly et al. (2001) found the stellar population of the nucleus to be related to the level of AGN activity, and that the circumnuclear populations within the central 500 pc were similar to, but younger than, those typical of a normal galaxy.
References
- (1) Barbuy, B., Grenon, M, 1990, in ESO/CTIO Workshop on Bulges of Galaxies, (A92-18101 05-90), p.83-87
- (2) Bica E., 1988, A&A 195, 76
- (3) Boisson, C., Joly, M., Moultaka, J., Pelat, D., Serote Roos, M., 2000 A&A 357, 850
- (4) Bonatto, C., Bica, E., Pastoriza, M.G., Alloin, D., 2000, A&A 355, 112
- (5) Cayrel de Strobel, G., Soubiran, C., Friel, E.D. Ralite, N., François, P., 1997, A&AS 124, 299
- (6) Chapman, S.C., Morris, S.L., Alonso-Herrero, A., Falcke, H., 2000, MNRAS 314, 263
- (7) Cid-Fernandes, R., Storchi-Bergmann, T., Schmitt, H.R., 1998, MNRAS 297, 579
- (8) Cuby J.G., Lidman C., Moutou C., Petr M., 2000, SPIE 4008, 1036
- (9) Dallier, R., Boisson, C., Joly, M., 1996, A&AS 116, 239
- (10) Devereux, N.A., Becklin, E.E., Scoville, N., 1987, ApJ 312, 529
- (11) Devillard N., 1997, ESO Messenger, No. 87
- (12) Emsellem, E., Greusard, D., Combes, F., et al. 2001, A&A 368, 52
- (13) Favata F., Micela G., Sciortino S., 1997 A&A 323, 809
- (14) Ferruit, P., Wilson, A.S., Mulchaey, J., 2000, ApJS 128,139
- (15) Forbes, D. A., Norris, R.P., 1998, MNRAS, 300, 757
- (16) Gilli, R., Maiolino, R., Marconi, A., et al. 2000, A&A 355, 485
- (17) Glass, I.S., 1997, MNRAS, 292, L50
- (18) Glass, I.S., Moorwood, A.F.M., 1985, MNRAS, 214, 429
- (19) Gonçalves, A., Véron-Cetty, M.P., Véron, P., 1999, A&AS 135, 437
- (20) González-Delgado, R. M., Heckman, T., Leitherer, C., 2001, ApJ 546, 845
- (21) Hauschildt, P.H., Allard, F., Baron, E., 1999a ApJ 512, 377
- (22) Hauschildt, P.H., Allard, F., Ferguson, J., Baron, E., Alexander, D.R., 1999b ApJ 525, 871
- (23) Heckman, T. M., González-Delgado, R., Leitherer, C., et al. 1997, ApJ, 482, 114
- (24) Joly, M., Boisson, C., Pelat, D., 2001 in QSO host and their environments, Ed. I. Márquez et al., Kluwer Academic/Plenum Publishers, p.241
- (25) Kotilainen, J. K., Ward, M. J., Boisson, et al. 1992, MNRAS 256, 125
- (26) Levenson, N.A., Cid-Fernandes, R., Weaver, K.A., Heckman, T.M., Storchi-Bergmann, T., 2001 ApJ 557, 54
- (27) Livingston, W., Wallace, L., 1991 N.S.O. Technical report 91-001, National Solar Observatory, Tucson
- (28) Maiolino, R., Krabbe, A., Thatte, N., Genzel, R., 1998 ApJ 493, 650
- (29) Márquez, I., Boisson, C., Durret, F., Petitjean, P., 1998 A&A 333, 459
- (30) Moorwood A., Cuby J.G., Ballester P., et al., 1999, ESO Messenger, No. 95
- (31) Nelson, C.H., 2001, ApJ 544, 91
- (32) Nelson, C.H., Whittle, M., 1995, ApJS 99, 67
- (33) Oliva E., Origlia L., Kotilainen J.K., Moorwood A.F.M., 1995, A&A 301, 55
- (34) Oliva E., Origlia L., Maiolino R., Moorwood A.F.M., 1999, A&A 350, 9
- (35) Origlia, L., Moorwood, A.F.M., Oliva, E., 1993 A&A 280, 536
- (36) Phillips, M.M., 1979, ApJL 227, 121
- (37) Reynolds, C.S., Ward, M.J., Fabian, A.C., Celotti, A., 1997, MNRAS, 291, 403
- (38) Schlegel, D.J., Finkbeiner, D.P., Davis, M., 1998, ApJ 500, 525
- (39) Soubiran C., Katz D., Cayrel R., 1998 A&AS 133, 221
- (40) Storchi-Bergmann, T., Bica, E., Pastoriza, M.G.,, 1990, MNRAS 245, 749
- (41) Tonry, J., Davis, M., 1979, AJ 84, 1511
- (42) Vega Beltrán, J.C., Zelinger, W.W., Amico, P. et al., 1998, A&AS 131, 105
- (43) Veilleux, S., Shopbell, P.L., Miller, S.T., 2001 AJ 121, 198
- (44) Ward, M.J., Penston, M., Blade, J., Turtle, A., 1980, MNRAS 193, 563
-
(45)
Winge, C., Pastoriza, M.G., Storchi-Bergmann, T.,
1990, Rev. Mexicana Astron. Astrof., 21, 177
Appendix A Stars.
A set of stars has been observed under the same conditions as for the galaxies. These stars extend the stellar library published in Dallier et al. (1996). Figures A1 and A2 show the individual flux calibrated spectra.