Evidence for An Intermediate-age, Metal-rich Population of Globular Clusters in NGC 4365111 Based on data obtained at the W. M. Keck Observatory, which is operated as a scientific partnership among the California Institute of Technology, the University of California and the National Aeronautics and Space Administration.
Abstract
We present spectroscopy for globular clusters (GCs) in the elliptical galaxy NGC 4365, obtained with the LRIS spectrograph on the Keck I telescope. Previous studies have shown that the optical color distribution of GCs in NGC 4365 lacks the bimodal structure that is common in globular cluster systems, showing only a single broad peak. Measurements of Balmer line indices (H, H and H) on the GC spectra support recent suggestions by Puzia et al., based on optical and near-infrared photometry, that some of the clusters in NGC 4365 are intermediate-age (2–5 Gyrs) and metal-rich () rather than old (10–15 Gyrs) and metal-poor. We also find some genuinely metal-poor, old clusters, suggesting that the ages and metallicities of the two populations conspire to produce the single broad distribution observed in optical colors.
1 Introduction
Several recent studies have shown that complicated color distributions in globular cluster systems (GCSs) are the norm rather than the exception (Gebhardt & Kissler-Patig, 1999; Kundu & Whitmore, 2001; Larsen et al., 2001). In many cases, the GCS color distributions can be fairly well modeled as a superposition of two Gaussians with peaks at and . These colors correspond to mean metallicities of and (Kissler-Patig et al., 1998) if both populations are “old”, i.e. they have similar ages (10–15 Gyrs) as those in the Milky Way.
Although the color differences of globular clusters have generally been assumed to be mainly a function of metallicity, it is clear that age differences between GC sub-populations will also affect their colors, making a younger population appear bluer for a given metallicity. There are a few cases in which only a single, broad peak is observed in the optical GC color distribution, usually at blue or intermediate colors. While these systems might simply lack a distinct metal-rich component, which would normally show up as the red peak, another interesting possibility is that the metal-rich population is indeed present but has a significantly lower age than the metal-poor one, shifting it to bluer colors and making the two populations appear as a single broad peak in optical colors. Using optical photometry alone, this degeneracy between age and metallicity cannot easily be broken and alternative methods are needed to provide independent constraints on metallicity or age (or both).
Combining optical and near-infrared imaging of GCs in the Gyr old merger remnant NGC 1316, Goudfrooij et al. (2001) have recently demonstrated that an old, metal-poor population and a very metal-rich, younger population with an estimated age consistent with that of the merger (Kuntschner & Davies, 1998), masquerade as a single peak in optical colors. It is possible that other systems with an apparently unimodal GC color distribution might in a similar way be composed of several populations with large age differences.
The giant elliptical galaxy NGC 4365 at the outskirts of the Virgo cluster is another example of a galaxy with only a single broad peak in the GC color distribution (Forbes et al., 1996; Gebhardt & Kissler-Patig, 1999; Larsen et al., 2001). From optical and near-infrared photometry, Puzia et al. (2002, hereafter P02) have suggested that some of the GCs in NGC 4365 might indeed be intermediate-age (2–8 Gyrs) and very metal-rich (). In this paper we use new spectroscopic data to further investigate the ages and metallicities of GCs in NGC 4365.
2 Data
Spectra for GC candidates in NGC 4365 were obtained in multi-slit mode on 2002 Feb. 9 and Feb. 10 with the LRIS spectrograph (Oke et al., 1995) on the Keck I telescope. Candidate young clusters were selected from the data in P02, but to fill up the slitmask a number of objects without -band imaging were also included. We obtained 9 exposures with integration times of 30–60 min, yielding a total exposure time of 390 min (6 hours). Observations were carried out simultaneously with the blue and red sides on LRIS, using a dichroic splitting at 5600Å. On the blue side we used a 600 l/mm grism, covering 3800–5600Å, while a 600 l/mm grating blazed at 5000Å was used on the red side, covering the range 5600–7900Å. A number of radial velocity and flux standards, as well as Lick/IDS standard stars from Worthey et al. (1994), were also observed. The radial velocity standards were picked from the compilation in Barbier-Brossat & Figon (2000) (numbers 9934 and 10927) while the flux standards were PG0934554 and Hiltner 600 (Massey et al., 1988). Because the spectral range covered in longslit mode is slightly different from the one covered in multislit mode, we observed the flux standards in multislit mode through one of the slitlets in the NGC 4365 slitmask, to facilitate flux calibration over the entire spectral range of the science spectra. A slit width of was used for all observations.
Initial processing of the images (bias subtraction, flatfield correction, cosmic ray removal etc) was done with standard tools in IRAF222 IRAF is distributed by the National Optical Astronomical Observatories, which are operated by the Association of Universities for Research in Astronomy, Inc. under contract with the National Science Foundation . After correction for optical distortions, each individual spectrum was extracted using the APALL task in the SPECRED package in IRAF. Following wavelength calibration based on arc lamps mounted within the spectrograph, small zero-point corrections (1–3 Å) were applied by measuring the [Oi] skylines at 5577.338Å (blue spectra) and 6300.304Å (red spectra). Finally, flux calibration was applied and the individual spectra of each object were summed. Three sample spectra are shown in Figure 1.
Basic data for the cluster candidates are listed in Table 1. The photometry is from the HST data used in Larsen et al. (2001), while the magnitudes are from the VLT/ISAAC data in P02. Radial velocities were determined by cross-correlating the cluster spectra with those of the radial velocity standards, using the FXCOR task in the RV package in IRAF. The radial velocities listed in Table 1 are an average of the cross-correlation results for each reference star, where the errors are estimates of the standard error on the mean based on the two measurements. We note that there is a systematic difference of about 100 km/s between the radial velocity measurements for each of the two stars, suggesting that the catalogued velocity of at least one of the stars is erroneous or that one star might have been misidentified. If this systematic difference is taken into account, the r.m.s. difference between the two sets of measurements is only about 13 km/s, so the relative radial velocities are probably more accurate than implied by the errors listed in Table 1. For NGC 4365 itself, the RC3 catalog (de Vaucouleurs et al., 1991) lists a radial velocity of km/s. Four objects turned out to be either likely foreground stars or have too low signal-to-noise to extract a useful spectrum. This leaves us with 14 confirmed clusters, with a mean radial velocity of km/s and a dispersion of km/s.
3 Measuring Lick/IDS indices
In order to estimate ages and metallicities for the GCs we employ the Lick/IDS system of absorption indices (Worthey et al., 1994), including H and H from Worthey & Ottaviani (1997). After correcting for the radial velocities in Table 1, we re-measured the locations of several prominent features such as the Balmer lines, G-band and Ca ii HK lines and found the wavelength scales to be accurate to better than 1 Å in the relevant range (i.e. Å). Because our LRIS spectra have a higher spectral resolution (about 5Å FWHM) than the original Lick/IDS system (8–13 Å), we smoothed our spectra to the IDS resolution with a wavelength-dependent Gaussian kernel before measuring the indices. Another difference between the original Lick/IDS system and our LRIS spectra is the fact that we are working on flux-calibrated data, whereas the original Lick/IDS spectra on which the Lick system is based were not flux calibrated. However, it is well documented that differences in flux calibration procedures affect the equivalent widths of most Lick indices only weakly, at the level of Å (e.g. Faber et al., 1985; Kissler-Patig et al., 1998; Larsen & Brodie, 2002). One possible exception is the Mg2 index, whose continuum passbands are more widely separated, and where offsets between instrumental systems and the Lick standard system have often been found (e.g. Kuntschner, 2000).
For most indices we were able to check the agreement between our instrumental system and the Lick standard system using the Lick/IDS standard star observations. Figure 2 shows our standard star measurements versus the standard values (Worthey et al., 1994; Worthey & Ottaviani, 1997). The mean offsets are listed in Table 2. Even after smoothing, systematic offsets of Å remained between our measurements and the standard values. Unfortunately, since the Lick/IDS standard stars were observed in longslit mode, they did not include the red continuum passbands of Mg2 and Fe5335, so we were unable to check these two indices. Because some of the indices fell outside the spectral range of the standard star observations and some of the globular cluster spectra have measured indices outside the range spanned by the standard stars, we have not attempted to correct our index measurements on the science spectra for the offsets between our instrumental system and the Lick/IDS standard system. However, we note that these small offsets are of no consequence to our analysis or conclusions, and are generally smaller than the random measurement errors and model uncertainties. The indices used in this paper are listed in Table 3.
4 Results
4.1 Ages and metallicities
Fig. 3 shows a (, ) two-color diagram for GC candidates in NGC 4365, based on the data in P02. The photometry has been corrected for a foreground reddening of mag (Schlegel et al., 1998), adopting the extinction curve in Cardelli, Clayton and Mathis (1989). The 9 spectroscopically confirmed clusters with -band data are shown with filled circles. Also shown are single-aged stellar population (SSP) models by Maraston (2002) for ages of 2, 3, 4, 5, 6, 8, 11 and 14 Gyrs and metallicities of [/H]= , , , 0.0 and . From the optical colors alone and assuming old ages, the 9 clusters would appear to have low to intermediate metallicities, but their location in the two-color diagram suggests that they may instead be as young as 2–3 Gyrs and have metallicities near solar. For a more detailed discussion of the (, ) diagram, including a comparison of various SSP models, we refer to P02.
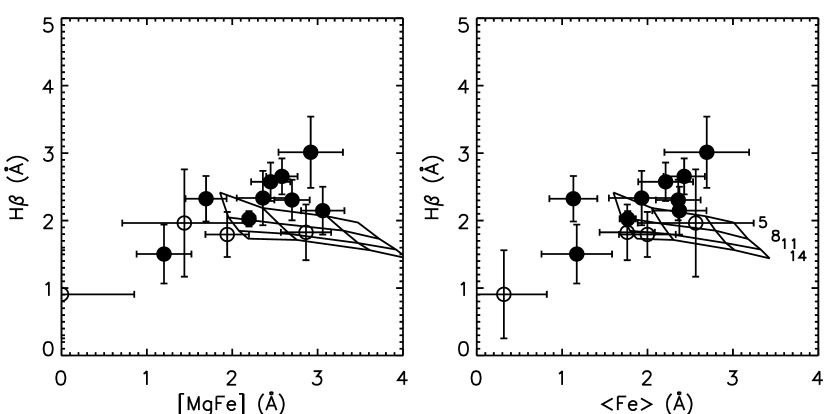
In Fig. 4 we show the Balmer line indices (H, H and H) for the clusters vs. [MgFe] and , compared with SSP model grids by Thomas, Maraston, & Bender (2002, hereafter TMB02). A variety of SSP models are now available in the literature, but for this work we have chosen the models by TMB02 because they are tabulated for several different values and thus allow us to quantify the effect of varying -element abundances. These models are also the first to attempt a correction for the bias in the original Lick/IDS fitting functions (Maraston et al., 2002). We have used the common definitions = (Fe5270Fe5335)/2 and [MgFe] = (González, 1993). The SSP models are shown for ages of 3, 5, 8, 11 and 14 Gyrs and the same metallicities as in Fig. 3. In the plots involving H, we show models with (solid lines) and (dashed lines). In the other plots only models are shown. Clusters with and without -band imaging are shown with filled and open circles, respectively. Object #3, which has Mg , is shown at [MgFe]. The blue color of this cluster, as well as its weak Fe indices, suggest that it is very metal-poor. It is also one of the faintest objects in our sample and was observed in a short () slit, making accurate sky subtraction difficult. The negative Mg value is most likely due to contamination by the [Ni] night-sky line at 5199 Å, which is shifted into the Mg central bandpass after correcting for the radial velocity of NGC 4365.
All four panels in Fig. 4 confirm a spread in metallicity with some clusters approaching Solar values, but none of the clusters included in our small sample appear to have metallicities significantly above Solar. The combined index measures primarily Fe-peak elements (Tripicco & Bell, 1995) and is therefore sensitive to when plotted for a fixed mean metallicity [/H]. The [MgFe] grids, on the other hand, vary only weakly with for fixed [/H], as can be seen from the similarity between the dashed-line and solid-line grids in the upper left panel of Fig. 4. Comparison of Balmer line indices with the models again indicates intermediate ages for many of the metal-rich clusters, but note that some of the filled circles (all of which, by selection, appear young in Fig. 3) are actually better fit by the models corresponding to old ages. Thus, there are a few cases in which the spectroscopic and photometric data are not entirely consistent. Some of the clusters without IR data also appear to be genuinely old.
The TMB02 models, like most other available SSP models, are based on the Lick/IDS “fitting functions”. A new set of SSP models based on fitting functions derived from the spectral library by Jones (1999) has recently been computed by R. Schiavon and was kindly made available to us (a discussion of some of the ingredients in these models is given in Schiavon et al. (2002)). The Schiavon models cover a more restricted range in age and metallicity, but are useful as a comparison with the Maraston models. In Fig. 5 we compare our measurements of H, [MgFe] and with the Schiavon models (based on Salaris isochrones). The slope of the lines of constant age in the H vs. [MgFe] and planes differs somewhat from that in Fig. 4, suggesting that even relative ages based on Balmer line indices may still be inherently uncertain at the level of a few Gyrs. Nevertheless, the picture remains clear: many of the metal-rich clusters in NGC 4365 have stronger H indices than even the 5 Gyr models, and thus appear to be young.
Considering the current model uncertainties and observational errors, it is probably not very meaningful to assign absolute ages to any individual clusters, but Figs. 3 – 5 consistently suggest that NGC 4365 hosts a substantial number of clusters as young as 2–5 Gyrs and with near-Solar metallicities. However, confirmation of this result with a larger sample of high S/N spectra would clearly be very desirable. We also note that factors such as horizontal branch morphology and the luminosity function on the red and asymptotic giant branches may affect line indices and remain major uncertainties in SSP models (e.g. Schiavon et al., 2002). This might account for some of the differences between the spectroscopic and photometric age/metallicity estimates, and could also have a significant effect on ages derived from Balmer lines (Lee et al., 2002).
4.2 abundance ratios
In Fig. 6 we compare our measurements of Mg2 and Mg (both indicators of -elements) with the SSP models by TMB02. We show the models for both 3 and 12 Gyrs, to illustrate that the relation between Mg2/Mg and is only expected to depend weakly on age. For the most metal-poor clusters neither plot provides strong constraints on ratios, although the Mg2 vs. plot (which has the smallest formal errors) suggests super-solar , as in other old stellar populations. There may be a slight tendency for the most metal-rich clusters to have closer to solar. While offsets may be present between our instrumental system and the Lick standard system for the Mg2 index, comparison of the two panels in Fig. 6 suggests that any such offset is relatively small. Ratios of of are common in globular clusters and elliptical galaxies and are usually attributed to rapid early enrichment dominated by Type II SNe. For an intermediate-age population, one would expect the ratios to be closer to Solar, since the gas would have been enriched with Fe-group elements by Type Ia SNe over several Gyrs (Thomas, Greggio, & Bender, 1999). Thus, the trends in with metallicity suggested by Fig. 6 are again consistent with many of the metal-rich clusters being intermediate-age.
5 Origin of the intermediate age population
The photometric optical/IR and spectroscopic data clearly hint at an intermediate-age, metal-rich population of GCs in NGC 4365. Although we would expect the globular cluster populations to trace major star formation episodes in their host galaxy, little is currently known about the detailed star formation history of any elliptical galaxy and NGC 4365 is no exception. Based on a comparison of H, and Mg2 measurements with a 1992 version of the Worthey SSP models, combined with kinematic evidence, Surma & Bender (1995) suggested that a metal-rich (up to ) and Gyr old stellar population with a mass of exists in the central regions of NGC 4365. However, new results from integral field spectroscopy of NGC 4365 (Davies et al., 2001) and comparison with more recent SSP models indicate a luminosity-weighted age for the stellar population in the galaxy of about 14 Gyrs over a continuous central region covering 0.5 effective radii. NGC 4365 does not show any of the usual signs of merger activity within the last few Gyrs (Hi tidal tails, disturbed morphology etc.). Although it does have a kinematically decoupled core (KDC), Davies et al. (2001) found no age differences between the KDC and the remainder of the galaxy, and both components appear to have the same elevated Mg-to-Fe ratio. An intermediate age population may still exist within the central of the nucleus, but its luminosity and associated mass are probably much smaller than required to account for the intermediate-age GCs (Carollo et al., 1997). Even if the KDC indicates a merger history, it is therefore not clear that the event which produced the KDC is related to the origin of the intermediate-age GCs.
In present-day starbursts, formation of clusters is generally accompanied by formation of field stars, so it would be natural to expect a stellar population with the same age and metallicity as the GCs. Indeed, the metallicity of the metal-rich GCs in many systems tends to correlate with that of the parent galaxy (e.g. Forbes, Brodie, & Grillmair, 1997), suggesting a common origin. If the old age of the general stellar population in NGC 4365 and the intermediate age of the metal-rich GCs are both confirmed, an interesting question will be whether or not there are any field stars associated with the intermediate-age GCs at all. One possibility is that some intermediate-age field stars do exist in NGC 4365, but constitute a too small fraction of the total population to strongly influence the integrated light.
How many young stars could be “hidden” in NGC 4365 without significantly affecting the integrated light? A detailed answer to this question is beyond the scope of the present paper, but we can make some rough estimates. First, it is important to specify the age of the young population, because the Balmer line strengths and luminosity per unit mass both increase strongly at younger ages, causing even a small number of very young stars to have a strong impact on the integrated spectrum. In a realistic modelling, the effects of different metallicities also need to be considered. However, here we are mainly interested in the change in Balmer line strengths in the presence of young stars and for this purpose the metallicity effects can, at least as a first approximation, be considered second-order. In the following we will simply assume Solar metallicity. The Maraston SSP models that we have used in previous sections do not tabulate mass-to-light ratios, so for this purpose we use models by Bruzual & Charlot (2000; priv. comm.). These models give M/L ratios for various broad-band filters, of which we will use the -band numbers as the best approximation to the region around H. For 2-Gyr and 5-Gyr populations, the -band luminosities per unit mass are about 9.5 and 3.3 times higher than at 15 Gyrs, respectively, assuming a Miller-Scalo IMF. For solar metallicity, the TMB02 models predict an H equivalent width of 2.91Å, 2.16Å and 1.51Å at 2 Gyrs, 5 Gyrs and 15 Gyrs, respectively.
We can now estimate the H equivalent width for any mix of the 2 Gyr, 5 Gyr and 15 Gyr populations by properly weighting each component. For a 15 Gyr population mixed with a 5 Gyr population constituting 5% of the total mass, the H EW is 1.61Å, about 0.1Å more than for a pure 15 Gyr population. According to the TMB02 models, this corresponds to an age of 13 Gyrs instead of 15 Gyrs inferred from the integrated spectrum. If the 15 Gyr population is mixed with a 2 Gyr population, again constituting 5% of the mass, the H EW would increase to 1.98Å, corresponding to an age of 7 Gyrs instead of 15 Gyrs. In order to limit the increase in H to 0.1Å, only about 1% of the mass could be in the 2 Gyr population. For the other Balmer lines we find very similar results.
While in reality the effects of different metallicities, IMFs, changes in integrated colors etc. need to be investigated in a more rigorous way, it is clear that only a small number of younger stars could be present in NGC 4365 without noticable effects on the integrated spectrum. The above considerations suggest that a mass fraction of 1%–5% in a 2–5 Gyr population would lead to a decrease of about 2 Gyrs in the luminosity-weighted age estimates (based on Balmer lines), and thus a mass fraction of this order could plausibly remain undetected. It is important to point out, however, that this calculation applies to the integrated light at any given position within the galaxy — if, for example, the young population were more centrally concentrated, its relative contribution to the mass would have to remain below a few percent even within the central regions, and thus constitute a much smaller fraction of the total mass globally.
With current data, the relative numbers of intermediate-age and old clusters are poorly constrained, but P02 estimated that about 150 clusters in NGC 4365 [out of a total ; Ashman & Zepf (1998)] might belong to the younger population. This corresponds to about 6% of the clusters being young. While the formation efficiency of clusters relative to field stars might vary for the different populations, it is conceivable that any field stars associated with the intermediate-age clusters could be “hidden”, with the requirement that these stars are uniformly distributed throughout the galaxy. P02 also estimated that 40% – 80% of the clusters in their observed sample (i.e. within a field near the center) are young, but because of their color-dependent detection limit, they estimate a biasing factor of 1.8 in the detected numbers of metal-rich (IR-bright) vs. metal-poor clusters. However, even a mass fraction as high as in 2–5 Gyr old field stars in the central regions would completely dominate the integrated spectrum, and is clearly incompatible with a uniformly old luminosity-weighted age. The relative numbers of globular clusters and field stars at different metallicities have only been examined in detail for one large elliptical, the nearby NGC 5128 (Harris & Harris, 2002), where the number of clusters relative to field stars seems to decrease with increasing metallicity. This trend, then, is the opposite of what would be required in NGC 4365. Both the GC system of NGC 4365 and the field star population clearly warrant further study.
6 Summary
We have presented spectroscopy for 14 globular clusters in NGC 4365, of which 9 were suspected to be intermediate-age, metal-rich objects based on -band and optical photometry. Our spectroscopy supports this suspicion for most of the objects and comparison with current simple stellar population models suggests ages of 2–5 Gyrs and metallicities in the range . However, some old (10–15 Gyrs) clusters are also present. Our spectra thus appear to support the idea that the apparent unimodal optical GC color distribution in NGC 4365 is due to a particular combination of GC ages and metallicities. We see hints of a decrease in abundance ratios with increasing metallicity, with close to Solar for the metal-rich, intermediate-age clusters. The results on GC ages are puzzling in the context of recent data for NGC 4365 itself, which suggest that the stellar population is uniformly old with an age of Gyrs. At most a few percent of the mass could be in a 2–5 Gyr stellar population without strongly affecting the integrated spectrum. It would be highly desirable with spectroscopy and/or IR imaging of many more clusters in NGC 4365 in order to better constrain the relative numbers of intermediate-age and old clusters. If confirmed, these findings would pose a significant challenge for understanding the origin of GC sub-populations.
References
- Ashman & Zepf (1998) Ashman, K. M. & Zepf, S. E. 1998, “Globular Cluster Systems”, Cambridge Astrophysics Series, Cambridge University Press
- Barbier-Brossat & Figon (2000) Barbier-Brossat M. & Figon P. 2000, A&AS, 142, 217
- Cardelli, Clayton and Mathis (1989) Cardelli, J. A., Clayton, G. C. and Mathis, J. S. 1989, ApJ, 345, 245
- Carollo et al. (1997) Carollo, C. M., Franx, M., Illingworth, G. D., & Forbes, D. A. 1997, ApJ, 481, 710
- Davies et al. (2001) Davies, R. L. et al. 2001, ApJ, 548, L33
- Faber et al. (1985) Faber, S. M., Friel, E. D., Burstein, D., & Gaskell, C. M. 1985, ApJS, 57, 711
- Forbes, Brodie, & Grillmair (1997) Forbes, D. A., Brodie, J. P., & Grillmair, C. J. 1997, AJ, 113, 1652
- Forbes et al. (1996) Forbes, D. A., Franx, M., Illingworth, G. D., & Carollo, C. M. 1996, ApJ, 467, 126
- Gebhardt & Kissler-Patig (1999) Gebhardt, K. & Kissler-Patig, M. 1999, AJ, 118, 1526
- González (1993) González, J. J., 1993, PhD Thesis, Univ. of California, Santa Cruz
- Goudfrooij et al. (2001) Goudfrooij, P., Alonso, M. V., Maraston, C., & Minniti, D. 2001, MNRAS, 328, 237
- Harris & Harris (2002) Harris, W. E. & Harris, G. L. H. 2002, AJ, 123, 3108
- Jones (1999) Jones, L. A. 1999, PhD Thesis, University of North Carolina
- Kissler-Patig et al. (1998) Kissler-Patig, M., Brodie, J. P., Schroder, L. L., Forbes, D. A., Grillmair, C. J., & Huchra, J. P. 1998, AJ, 115, 105
- Kundu & Whitmore (2001) Kundu, A. & Whitmore, B. C. 2001, AJ, 121, 2950
- Kuntschner & Davies (1998) Kuntschner, H. & Davies, R. L. 1998, MNRAS, 295, L29
- Kuntschner (2000) Kuntschner, H. 2000, MNRAS, 315, 184
- Larsen et al. (2001) Larsen, S. S., Brodie, J. P., Huchra, J. P., Forbes, D. A. and Grillmair, C. 2001, AJ, 121, 2974
- Larsen & Brodie (2002) Larsen, S. S. & Brodie, J. P., 2002, AJ, 123, 1488
- Lee et al. (2002) Lee, H.-C., Lee, Y.-W. and Gibson, B. K., 2002, in: “Extragalactic Globular Cluster Systens”, Sprinter-Verlag, ed. M. Kissler-Patig
- Maraston (2002) Maraston, C. 2002, in preparation
- Maraston et al. (2002) Maraston, C., Greggio, L., Renzini, A., Ortolani, S., Saglia, R. P., Puzia, T. H., & Kissler-Patig, M. 2002, A&A, submitted (astro-ph/0209220)
- Massey et al. (1988) Massey, P., Strobel, K., Barnes, J. V., & Anderson, E. 1988, ApJ, 328, 315
- Oke et al. (1995) Oke, J. B. Cohen, J. G., Carr, M. et al. 1995, PASP, 107, 375
- Puzia et al. (2002) Puzia, T. H., Zepf, S. E., Kissler-Patig, M., Hilker, M., Minniti, D., & Goudfrooij, P. 2002, A&A 391, 453
- Schiavon et al. (2002) Schiavon, R. P., Faber, S. M., Rose, J. A., Castilho, B. V., 2002, AJ, submitted (astro-ph/0109365)
- Schlegel et al. (1998) Schlegel, D. J., Finkbeiner, D. P., and Davis, M. 1998, ApJ, 500, 525
- Surma & Bender (1995) Surma, P. & Bender, R. 1995, A&A, 298, 405
- Thomas, Greggio, & Bender (1999) Thomas, D., Greggio, L., & Bender, R. 1999, MNRAS, 302, 537
- Thomas, Maraston, & Bender (2002) Thomas, D., Maraston, C., & Bender, R. 2002, MNRAS, submitted (astro-ph/0209250)
- Tripicco & Bell (1995) Tripicco, M. J. & Bell, R. A. 1995, AJ, 110, 3035
- de Vaucouleurs et al. (1991) de Vaucouleurs, G., de Vaucouleurs, A., Corwin, H. G., Buta, R. J., Paturel, G., Fouqué, P. 1991, “Third Reference Catalogue of Bright Galaxies”, Springer-Verlag New York
- Worthey et al. (1994) Worthey, G., Faber, S. M., González, J. J., and Burstein, D. 1994, ApJS, 94, 687
- Worthey & Ottaviani (1997) Worthey, G. & Ottaviani, D. L. 1997, ApJS, 111, 377
| ID | RA | DEC | RV | GC? | |||
|---|---|---|---|---|---|---|---|
| J2000.0 | HST/WFPC2 | VLT/ISAAC | km s-1 | ||||
| 1 | 12:24:24.083 | 7:17:44.31 | … | Yes | |||
| 2 | 12:24:25.470 | 7:17:54.55 | … | Yes | |||
| 3 | 12:24:25.672 | 7:18:01.30 | … | Yes | |||
| 4 | 12:24:24.311 | 7:18:25.50 | Yes | ||||
| 5 | 12:24:25.298 | 7:18:25.61 | Yes | ||||
| 6 | 12:24:24.718 | 7:18:58.99 | … | No | |||
| 7 | 12:24:26.654 | 7:18:55.14 | ? | ||||
| 8 | 12:24:26.636 | 7:19:09.36 | Yes | ||||
| 9 | 12:24:25.914 | 7:19:34.58 | Yes | ||||
| 10 | 12:24:29.465 | 7:19:03.49 | … | … | ? | ||
| 11 | 12:24:27.425 | 7:19:42.22 | Yes | ||||
| 12 | 12:24:28.724 | 7:19:38.26 | Yes | ||||
| 13 | 12:24:29.409 | 7:19:50.07 | Yes | ||||
| 14 | 12:24:28.595 | 7:20:08.39 | Yes | ||||
| 15 | 12:24:30.330 | 7:20:04.26 | Yes | ||||
| 16 | 12:24:29.409 | 7:21:35.16 | … | Yes | |||
| 17 | 12:24:28.869 | 7:21:57.34 | … | Yes | |||
| 18 | 12:24:31.509 | 7:22:32.15 | … | No | |||
Note. — No correction for Galactic foreground reddening has been applied to the photometry in this table. Coordinates are measured on the WFPC2 images.
| Index | MeasuredStandard (Å) |
|---|---|
| H | |
| H | |
| H | |
| Fe5270 | |
| Mg |
| ID | H | H | H | Fe5270 | Fe5335 | Mg2 | Mg | [MgFe] | |
|---|---|---|---|---|---|---|---|---|---|
| Å | Å | Å | Å | Å | Mag | Å | Å | Å | |
| 1 | |||||||||
| 2 | |||||||||
| 3 | |||||||||
| 4 | |||||||||
| 5 | |||||||||
| 8 | |||||||||
| 9 | |||||||||
| 11 | |||||||||
| 12 | |||||||||
| 13 | |||||||||
| 14 | |||||||||
| 15 | |||||||||
| 16 | |||||||||
| 17 | … | … | … | … | … | … |