1-2 \Year2003 \Month02 \Pagespan000000 \lhead[0]A.N. Pradas, J. & Kerp, J.: The 3-D composition of the Galactic interstellar medium. The hot phases and X-ray absorbing material. \rhead[Astron. Nachr./AN 324 (2003) 1/2]0 \headnoteAstron. Nachr./AN 324 (2003) 1/2, 000–000
jpradas@astro.uni-bonn.de
The 3-D composition of the Galactic interstellar medium. The hot phases and X-ray absorbing material.
1 Introduction
A detailed investigation of the soft X-ray background (SXRB) - correlation analysis of the ROSAT all-sky survey (Snowden et al. 1995) with the Leiden/Dwingeloo H i 21 cm-line survey(Hartmann & Burton 1997) - leads to a consistent model of the whole SXRB (Pradas, Kerp & Kalberla, these proceedings)
The high precision of the data allows to identify coherent structures which deviate from the best fit SXRB model. Here, we study these regions and associate them either with high (HVC) and intermediate-velocity clouds (IVC) or with irregularities in the shape of the Local Hot Bubble (LHB).
2 Analysis and results
In order to estimate the deviation of the SXRB model to the observational data, we calculate the following value for every pixel of size:
| (1) |
This statistical variable ideally follows a N(0,1) distribution, and automatically rejects pixels where the quality of the observational data is low and therefore not relevant for the investigation of the SXRB on large scales. In a first approach, the model is consistent with 80% of the whole sky in all seven ROSAT energy bands (see Figure 1). Pixels with big deviations (above ) form coherent structures that are not expected for a N(0,1) distribution. We focus on these areas, which can be interpreted as follows:
-
•
BRIGHT: Model too faint. Excess of absorber in the transport equation, additional X-ray sources or lack of intensity in the modelled LHB.
-
•
DARK: Model too bright. Lack of absorber in the transport equation or excess of intensity in the modelled LHB.
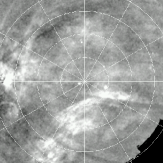
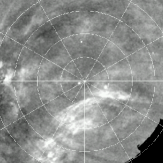
With this approach we can interpret the deviation images as a 3-D tool to determine the location of neutral gas clouds. We vary the locations of the different absorber components relative to the galactic X-ray halo (in front of or beyond it) to find the best fit distribution. This procedure leads to a significantly better agreement between model and observations if features like HVC Complex C and Complex M (Wakker & van Woerden 1997) are supposed to be located beyond the galactic X-ray halo and, thus, not absorbing the galactic halo emission.
Even with this best fit model, the distribution of still forms coherent structures. These are generally of a smaller size and lower intensity (below ) than the deviations described above. We associate these residual discrepancies with irregularities in the LHB. We conclude that the variation of the intensity of the LHB is a smooth function of galactic coordinates.
References
- [1] Hartmann, D., Burton, W.B. 1997: Cambridge University Press
- [2] Pradas, J., Kerp, J. & Kalberla, P. M. W.: these proceedings
- [3] Wakker, B. P. & van Woerden, H.:1997,ARA&A,35,217
- [4] Snowden, S. L. et al: 1995, ApJ, 454, 643