The peculiar nebula Simeis 57
We present high resolution radio continuum maps of the Galactic nebula Simeis 57 (= HS 191 = G 80.3+4.7) made at the Westerbork Synthesis Radio Telescope and the Dominion Radio Astrophysical Observatory at frequencies of 609, 1412 and 1420 MHz. At optical and at radio wavelengths, the nebula has a peculiar “S” shape, crossed by long, thin and straight filaments. The radio maps, combined with other maps from existing databases, show essentially all radio emission from the peculiar and complex nebula to be thermal and optically thin. Although neither the distance nor the source of excitation of Simeis 57 are known, the nebula can only have a moderate electron density of typically . Its mass is also low, not exceeding some tens of solar masses. Peak emission measures are 5000 pc cm-6.Obscuring dust is closely associated with the nebula, but seems to occur mostly in front of it. Extinctions vary from = 1.0 mag to = 2.8 mag with a mean of about 2 mag. The extinction and the far-infrared emission at m are well-correlated.
Key Words.:
Nebulae: individual: Simeis 57 - HS 191 – ISM: HII regions - radio continuum1 Introduction
Simeis 57 (also known as HS 191 and C 191; Gaze Shajn 1951, 1955) is a high surface-brightness nebula in the constellation Cygnus, about two degrees north of the large nebula IC 1318a. It is a prominent object on the Palomar Sky Survey images, not least because of its peculiar S-shape, reminiscent of a garden sprinkler. Various parts of the complex nebula are listed separately in the catalogue of optically visible HII regions in the Cygnus X region by Dickel et al. (1969; hereafter DWB). The southern arm of the ”S” is included as DWB 111, the northern arm as DWB 119. Projected onto the center of the ”S” is a faint ”bow tie” of optical emission and absorption, consisting of a broad north-south filament (DWB 107, 118, 126) and a narrow, fainter northeast-southwest filament (DWB 108 and 125, perhaps DWB 136 as well). This bow tie extends over roughly 1.5∘ from the supernova remnant W63 in the north towards the bulk of the Cygnus X region in the southeast. These features are quite distinct, even though the whole field of view is very confused with nebulosity and extinction patches belonging to the Orion (Local) Arm which is viewed mostly tangentially at these longitudes. This, and the small radial velocities (Dixon et al. 1981; Piepenbrink Wendker 1988) associated with Simeis 57 do not allow a kinematic distance determination, nor has the association of any star with the object been established. Its actual distance is thus unknown, although both its Galactic latitude (, ) and its angular extent (over 20′) suggest that it is a relatively nearby object, as was also concluded by Dickel et al. (1969).
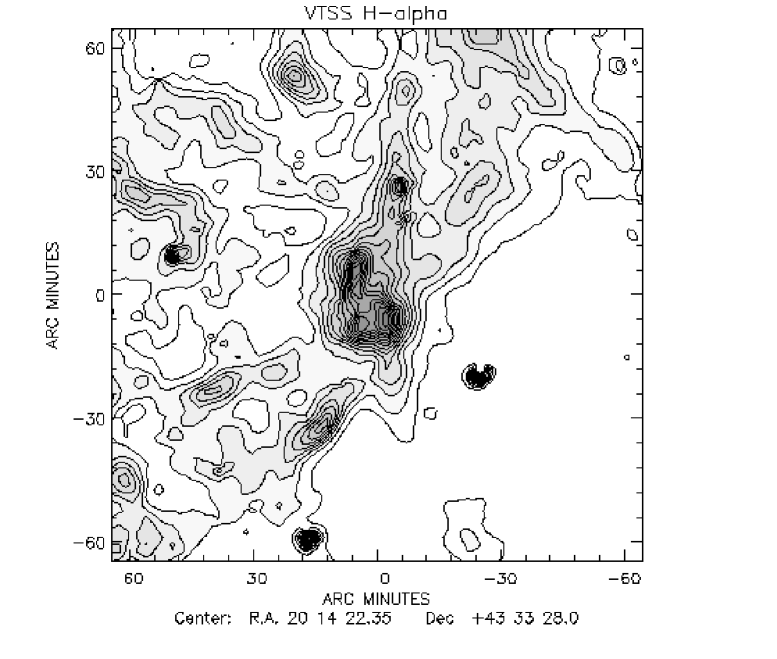
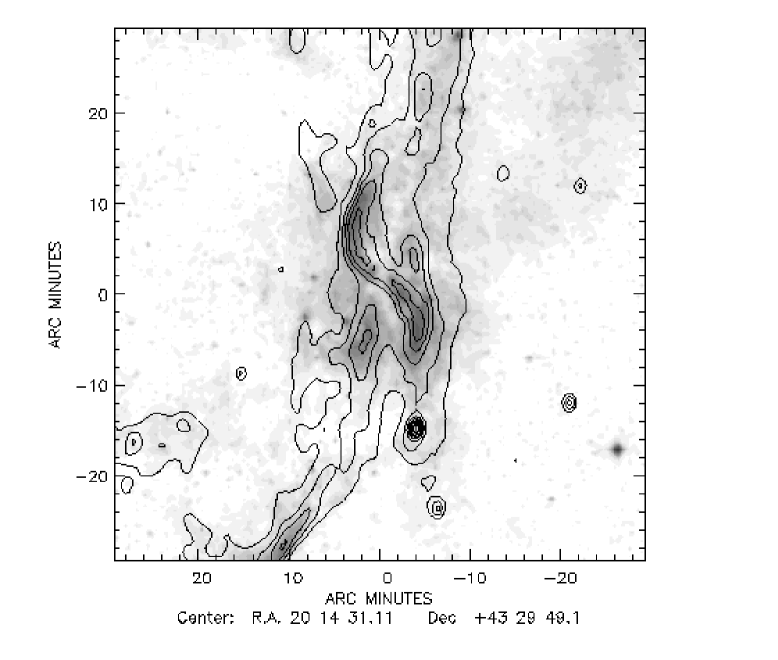
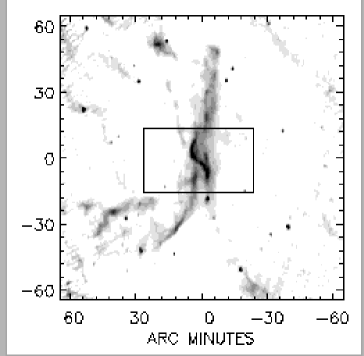
Despite its remarkable appearance and its apparent vicinity, very little attention has been paid to Simeis 57 since it was first catalogued in the 1950’s. The nebular complex corresponds to the radio source W 61 (Westerhout, 1958) and also appears to be the counterpart of 3C 425. Much of the existing information is contained within the various Cygnus X region surveys (e.g. Wendker 1967, 1970; Dickel et al. 1969; Wendker et al. 1991; for a compilation of early maps often including HS 191, see Goudis 1976). Its H emission was measured by Karyagina Glushkov (1971) and a calibrated H map was included in one of the Cygnus X region surveys by Dickel Wendker (1977). A set of [NII] radial velocities across the nebula was published by Dixon et al. (1981). Simeis 57 was also included in the Virginia Tech Spectral-Line Survey (Dennison et al. 1998). The relevant 1.6′ resolution H image of the nebula and its surroundings is shown in Fig. 1. Note that in this Figure, and throughout the remainder of this paper, equatorial coordinates are given with respect to the 1950.0 equinox.
2 Observations
2.1 WSRT 608.5 MHz and 1412 MHz continuum maps
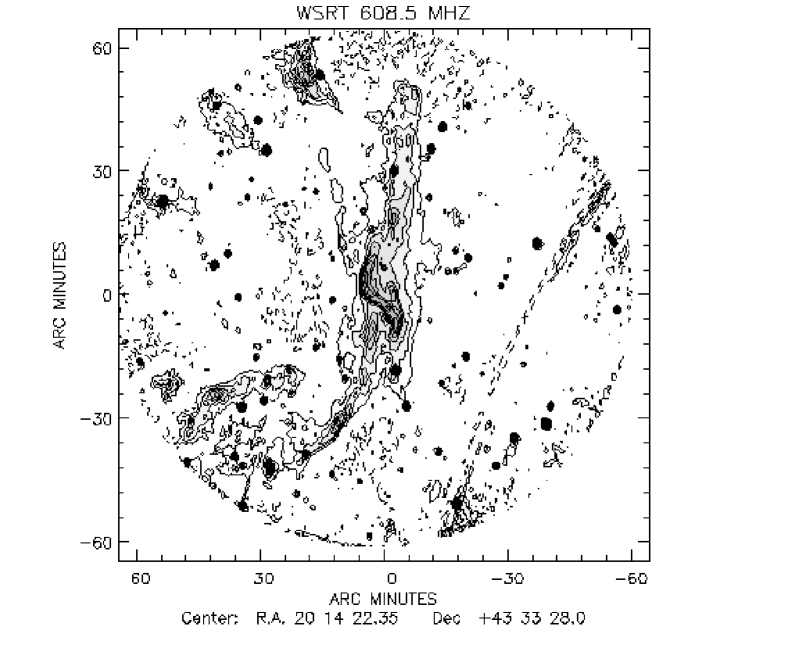
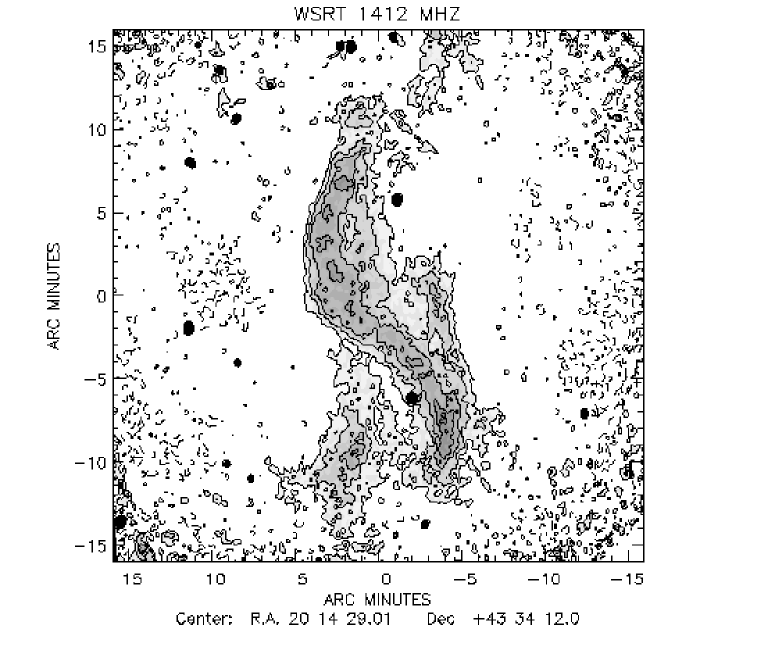
We observed fields centered on Simeis 57 with the Westerbork Synthesis Radio Telescope (WSRT) in the radio continuum at 608.5 ( = 49 cm) and 1412 MHz (( = 21 cm). The WSRT is an aperture synthesis interferometer consisting of a linear array of 14 antennas of diameter 25 m, arranged on a 2.7 km east-west line. Ten of the antennas are on fixed mountings, 144 m apart. The remaining four telescope are movable, enabling recovery of visibilities corresponding to baselines from 36 m to 2.7 km.
At 1412 MHz, two sets of 12-hr observations were taken on May 16-17 and July 23-24, 1982 respectively. At 608.5 MHz, five sets of 12-hr observations were taken on July 22, August 9, September 1, September 6 and September 9, 1988 respectively. The observation on September 6 was a repeat of an unsatisfactory result obtained on September 1, which we have not used in the following.
All data reduction was done in . Although we did check the emission of Simeis 57 for signs of polarization, none was found. We did have to address, however, the complications caused by the presence of the strong double radio source Cygnus A, about 4.3∘ from the fringe stopping center. This source, although weakened, distorted and spuriously polarized by the primary beam sidelobe response of the WSRT, still causes relatively strong grating rings to cross the observed field and confuse the Simeis 57 image. At both frequencies, we constructed small maps of the Cygnus A area, which we then cleaned. These clean-components were translated back into the (u,v)-plane and subtracted from the (u,v)-data of Simeis 57 before these were Fourier-transformed into a sky image. This procedure worked very well at 1412 MHz (were the Cygnus A response is weakest). It yielded an acceptable result at 608.5 MHz, although some of the remnant grating response can still be seen in the western half of the sky map.
Virtually all of the emission of interest in the Simeis 57 field is extended. Normal cleaning methods (such as the type devised by Clark and enhanced by Cotton Schwab, which is the standard implemented in ) do not handle extended emission very well, because the point-component model they use is too far from the actual reality. As the Simeis 57 WSRT fields contain both pointlike and extended sources, the clean-method of Cornwell Holdaway (July 1999, Socorro imaging conference) can be used. This method is a multi-resolution modification of clean. The full resolution image is convolved with gaussians of different widths while a dirty beam appropriate to a component of each width is constructed. In this way several maps with decreasing resolution are obtained. One of the convolving gaussians has ”zero-width” to include the point-source model. All these maps are simultaneously cleaned to obtain clean components with varying extent, thus providing a much beter response to extended structure. 31DEC00 has a (u,v)-based variation of this algorithm implemented As the method is (u,v)-based, the translated clean components are subtracted directly from the (u,v)-plane. This yields a better result than subtraction of scaled dirty beams from the sky map.
| Telescope | WSRT | WSRT | DRAO |
|---|---|---|---|
| Frequency (MHz) | 608.5 | 1412 | 1420 |
| Wavelength (cm) | 49.3 | 21.2 | 21.1 |
| Observing Time (hrs) | |||
| Observation Date | Jul-Sep 1988 | May/Jul 1982 | Sep 1985 |
| RA Phase Center (B1950) | 20h14m36.0s | 20h14m36.0s | 20h14m32.0s |
| DEC Phase Center (B1950) | +43∘35′00′′ | +43∘35′00′′ | +43∘33′13′′ |
| RA Phase Center (J2000) | 20h16m16.8s | 20h16m16.8s | 20h16m12.9s |
| DEC Phase Center (J2000) | +43∘44′18′′ | +43∘44′18′′ | +43∘42′31′′ |
| Observed Spacings (m) | 36 - 2754 | 36 - 2736 | 12.9 - 604.3 |
| Spacing Increment (m) | 18 | 36 | 4.29 |
| HPBW Primary Beam (∘) | 1.45 | 0.60 | 1.64 |
| HPBW Synthesized Beam(′′) | |||
| Total Bandwidth (MHz) | 2.5 | 10 | 15 |
| R.m.s. Noise (mJy/beam) | 2 | 0.4 | 0.8 |
| Map Cell Size (′′) | |||
| CLEAN Limit (mJy/beam) | 2 | 2 | 2 |
| No. CLEAN components | see text | see text | 30 000 |
| Calibrators | 3C147 (38.2 Jy) | 3C147 (22.0 Jy) | 3C147 (22.0 Jy) |
| 3C286 (20.8 Jy) | 3C286 (14.8 Jy) | 3C295 (22.1 Jy) |
At 1412 MHz we used a cell size of 4′′ and five different gaussians
for CLEANing. We CLEANed to a level of 2 mJy/beam and obtained 51,
29, 456, 2136 and 3318 CLEAN components for gaussians with widths of
0, 32, 64, 128 and 256 arcsec respectively. The 1412 MHz restored
synthesized beam FWHM of the CLEANed map is .
At 608.5 MHz we used a cell size of 8′′ and again five gaussians.
Here, we used 2884, 5273, 7568, 8571 and 10496 CLEAN components for
gaussians of width 0, 64, 128, 256 and 512 arcsec respectively. The
608.5 MHz restored synthesized beam was .
2.2 DRAO 408 and 1420 MHz continuum maps
We observed Simeis 57 and its surroundings in September 1985 with the Synthesis Telescope at the Dominion Radio Astrophysical Observatory (DRAO) in Penticton. The DRAO Synthesis Telescope is a wide-field telescope operating simultaneously in broadband continuum at 408 MHz ( = 74 cm) and 1420 MHz ( = 21 cm ), as well as in narrowband (at the time 128 channels) neutral atomic hydrogen (HI) spectral line bands. The telescope consisted of four 9 m paraboloids on a 600 m long east-west line. Two of the antennas are movable, enabling the recovery of visibilities from 12.9 m to 604.3 m. Broad structure in the continuum emission, representing visibilities corresponding to spacings shortwards of 12.9 m was obtained from existing low-resolution surveys at the two frequencies. Extended structure in HI was measured with the 26 m antenna at DRAO. A more detailed description of the telescope in the form used for the observations presented here was given by Higgs (1989), whereas its current capacities have been described by Landecker et al. (2000).
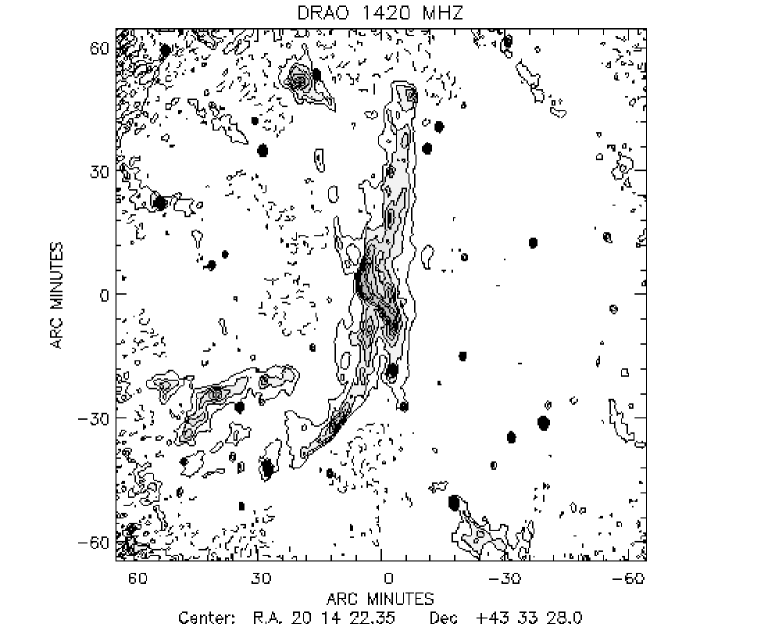
The 408 MHz observations and the resulting map have already been published before. For a description of the observations, reduction procedures, map and results we therefore refer to Higgs et al. (1991). The 1420 MHz continuum was observed over a bandwidth of 15 MHz. We mapped a field of view with a diameter of 2.6∘ (i.e to 20 primary beam response) on a grid. The map was cleaned and restored with an artifial gaussian beam of (FWHM) (cf. Landecker et al. 2000). At 408 MHz, the disturbing influence of Cygnus A at about 4.5∘ from the fringe stopping center is quite pronounced at the relatively low intensity levels corresponding to the emission from Simeis 57. However, at 1420 MHz, the grating rings from Cygnus A could be removed reasonably well from most of the map, although the remnant of such a grating ring remains visible in the southwest corner of the map. The measured map noise is close to the reported r.m.s. value for DRAO 1420 MHz continuum observations of 0.8 mJy/beam at the map center (Higgs 1989). Finally, we have corrected the map for the primary beam response (Fig.2). An earlier version of this map, along with a similar map derived from VLA observations, was published before by Cornwell (1988) in order to illustrate aspects of Maximum Entropy image restoration.
A comparison of the H image in Fig. 1 with the radio continuum images in Fig. 2 shows a good resemblance between the optical and radio emission. This is further illustrated in Fig. 4, where we have superposed contours of 1420 MHz radio emission over the red PSS optical image of the nebula. The radio contours closely follow the outline of nebular emission, both for the “S” shaped nebula and for the north-south filament. Also note that the filament contains an absorption band which is most clearly seen where it crosses the “S”.
2.3 Other radio continuum maps
The region containing Simeis 57 has been covered by various relatively
recent radio surveys. The first of these is the Westerbork Northern Sky
Survey (WENSS) which includes the region at 327 MHz ( = 92cm)
with a resolution of , a formal r.m.s. map
noise of 3.6 mJy/beam and a limiting flux-density of about 5 =
18 mJy/beam (Rengelink et al. 1997; see also
http://www.strw.leidenuniv.nl/~dpf/wenss/). We convolved the
map obtained from this survey to a 100′′ circular beam in an
attempt to improve the relatively low signal-to-noise ratio (Fig.
5). However, extended emission is hardly discernible and
even the source regions of higher surface brightness are poorly
represented.
Langston et al. (2000) used the NRAO/NASA Green Bank Earth Station to
survey the Galactic Plane in the radio continuum simultaneouisly at
frequencies of 8.35 GHz and 14.35 GHz (see also http://www.gb.nrao.edu/~glangsto/GPA/). The Galactic Plane Survey
(GPA) covers the region (, ). The Cygnus X region containing Simeis 57
has been mapped at both frequencies with resolutions of 670′′ and
480′′ respectively. At the two frequencies, intensity scales are
claimed to be better than 10 and 20 respectively.
We determined the variance () of the maps and used the values
thus obtained ( = 0.06 Jy/beam and = 0.05 Jy/beam
respectively) as the r.m.s. noise values. The peak signal-to-noise in
the 8.35 GHz-map is then 26, but in the 14.35 GHz map only 14. The maps
are shown in Fig. 5. The 8.35 GHz map shows a clear source
representing the nebula, even though little structure is seen, but the
14.35 GHz map is less clear.
Finally, the image from the NRAO VLA Sky Survey (NVSS) should be mentioned for completeness sake. This is part of a radio continuum survey covering the sky north of declination -40∘ at a frequency of 1400 MHz. Although the main features of the nebula are represented in this map, it is much inferior to the WSRT and DRAO maps at the same frequency. Simeis 57 is outside the range of the other VLA-survey, FIRST.
3 Results and analysis
3.1 Spectral index


Simeis 57 has been included in various single-dish radio surveys of the Cygnus X region (cf. Goudis 1976). In particular, Wendker (1967, 1970) has presented flux-densities for Simeis 57 at various frequencies ranging from 610 to 4930 MHz. He found an overall spectral index (spectral index defined as ) indicative of partially optically thick thermal emission. In his discussion of the object, Wendker (1967) suggested that emission from the north of Simeis 57 is optically thin, but that the southern part and especially the center are optically thick at the lower observed frequencies.
We can significantly improve upon this result, because the radio data discussed in this paper have much higher resolution and sensitivity than those available to Wendker. Among other things, this allows us to separate the source from its complex background much more accurately than was possible with the older large-beam data.
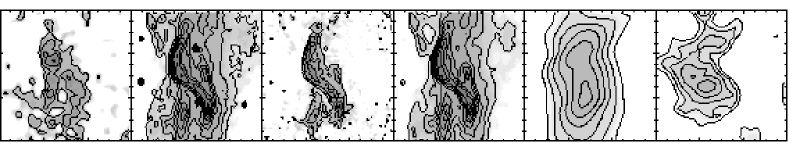
In the preceding, we have introduced radio observations of the nebula Simeis 57 at five different frequencies: 0.327, 0.609, 1.41/1.42, 8.35 and 14.35 GHz (Fig. 5). The WSRT 1412 MHz map has the best resolution, but the absence of low spatial frequencies in this map makes it unsuitable for spectral index determinations. This is, fortunately, not the case for the DRAO 1420 MHz and WSRT 608.5 MHz maps. The former contains all spatial frequencies, single-dish data having been added into the map. The latter lacks information at the shortest spacings, but its longer observing wavelength, its extensive clean-and-restoration, as well as the actual angular size of the source structure of interest combine to reduce the adverse effects to almost complete insignificance. The two maps have similar resolutions and field sizes. The poorer quality of the WENSS 327 MHz, GPA 8.35 and GPA 14.35 GHz maps makes them less suitable for accurate spectral index determinations,although they can and will be used for consistency checks.
We convolved the WSRT 609 MHz map to the DRAO 1420 MHz beam, and corrected both maps for small systematic base-level offsets of -3.4 mJy/arcmin2 (DRAO) and -3.3 mJy/arcmin2 (WSRT) found by comparing the low-intensity areas in both maps. We then constructed a pixel-to-pixel plot of the full corrected data set (Fig. 6). The source spectral index was found by fitting all data points excluding those pertaining to the general background and non-thermal point sources. The result obtained is a mean spectral index , consistent with an overall optically thin emission spectrum for Simeis 57. As the relatively small dispersion of points in Fig. 6 shows, this result applies not only to the bighter parts of Simeis 57, but also to the extended, lower surface-brightness parts of the source.
This is further illustrated by a map of the spectral index distribution, based on the corrected 1420 MHz and 608.5 MHz maps (Fig. 7). In constructing this map we have suppressed all pixels which have, at either frequency, an intensity less than 2 mJy/arcmin2 in order to prevent noise blow-up. The thermal nature of essentially all of Simeis 57 is again obvious. The only nonthermal emission in the map corresponds to point sources, which probably represent background radio sources unrelated to Simeis 57.
We have convolved the DRAO 1420 MHz map to the lower-resolution WENSS 327 MHz, GPA 8.35 and GPA 14.35 GHz maps, and determined average source flux-density ratios in the same way, allowing us to derive the relative radio spectrum shown in Fig. 6. Here, we have also marked the best-fitting optically thin thermal emission spectrum. Especially when one takes into account that the 327 MHz and 609 MHz flux-densities may be somewhat underestimated because of missing spacing information, it is obvious that the emission from Simeis 57 is optically thin over the whole observed frequency range 0.3 – 14 GHz.
3.2 Properties of the ionized gas
As the nature of the emission is known (thermal and optically thin), we may derive some properties of the ionized gas in which it arises. For this purpose, we use again the DRAO 1420 MHz and WSRT 608.5 MHz maps.
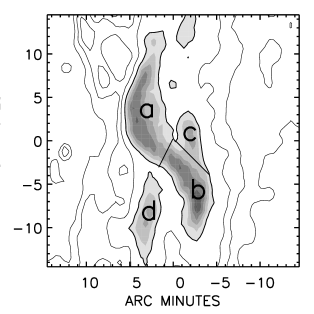

We have defined four different subregions making up the bright part of the radio nebula. These regions are identified in Fig. 8. Subregions a and b (DWB 119 and 111) together form the “S”. Subregion c is an extension of this and subregion d (DWB 118) is the brightest part of the long north-south filament.
| Region | Dimensions | Area | Flux-Density | Peak intensity | |||
|---|---|---|---|---|---|---|---|
| Angular | Linear | ||||||
| (D/500 pc) | (Jy) | (Jy/ | |||||
| a=DWB 119 | 134 | 1.90.6 | 53 | 1.780.08 | 1.78 0.08 | 47 | 44 |
| b=DWB 111 | 104 | 1.50.6 | 37 | 1.330.08 | 1.19 0.07 | 51 | 45 |
| a+b | 234 | 3.40.6 | 90 | 3.120.12 | 2.98 0.11 | 51 | 45 |
| c | 53 | 0.70.4 | 12 | 0.380.02 | 0.37 0.02 | 39 | 37 |
| d=DWB 118 | 83 | 1.20.4 | 20 | 0.620.03 | 0.56 0.03 | 39 | 37 |
| Extended | 3020 | 4.53.0 | 550 | 7.9 | — | 20 | — |
Sizes and intensities are given in Table 2; note that the linear size is scaled to an assumed distance = 500 pc. We have also determined the total flux-density inside a series of boxes centered on the nebula, with a fixed size in declination of 30′ (i.e. corresponding to the full extent of the “S” nebula) and a size in right ascension varying from 0′ to 50′. The total flux-density measured is plotted as a function of box width RA (Fig 8). Essentially all flux is contained with a box with dimensions RADec = ; the total is Jy, to which total the bright parts mentioned above contribute . For the whole complex, including the north-south and northwest-southeast filaments, Wendker (1970) found a total flux-density = 17.5 Jy, so that the filaments outside the maximum box depicted in Fig. 8 contribute about half again of the total flux-density inside the box.
Fig. 8 also shows that the cumulative flux-density is constant at larger box widths; this is excellent confirmation that our corrections to the map baselevel were accurate.
| Region | Emission Measure | Model | R.m.s. Electron | Mass |
| Depth | Density | |||
| pc cm | (/500 pc) | ( | ( M⊙) | |
| a | 5.10.3 | 0.6 | 9315 | 1.20.2 |
| b | 5.20.3 | 0.6 | 9417 | 0.80.2 |
| a+b | 5.10.3 | 0.6 | 9414 | 2.10.2 |
| c | 4.50.3 | 0.4 | 10219 | 0.20.1 |
| d | 4.40.2 | 0.4 | 10120 | 0.40.1 |
| Extended | 2.20.4 | 2.9 | 285 | 183 |
In deriving the physical properties in Table 3, we have followed Mezger Henderson (1967) for optically thin thermal emission. We have assumed that the emitting volume is that of a homogeneously filled cylinder at a constant electron temperature K, with a surface area and a depth corresponding to the smallest of the two projected dimensions. All parameters are based on an assumed distance of 500 pc; scaling factors for other distances are given in the header. We note that the ionized hydrogen masses given in Table 3 are strictly upper limits because of the assumption of homogeneity. If the gas is clumped, actual electron densities will exceed , and the mass will be accordingly less. Nevertheless, our results indicate that electron densities in the extended emission region are by a factor of four substantially lower than in the brighter nebular parts. However, even there, actual densities are modest and characteristic of well-evolved HII regions (cf. Habing Israel 1979). In contrast, most of the mass is in the extended low-density component. The excitation parameter of the nebula is given by (/500pc)2/3 pc cm-2 with in Jy. This is related to the stellar excitation parameter by , in which is the solid angle subtended by the nebula as seen from the source of excitation. As the exciting star, and thus its location, is still completely unknown, the subtended solid angle is very uncertain. Unrealistically assuming , = 19.5 pc cm-2, corresponding to an exciting star of spectral B0. More realistic values of indicate excitation by an O5 - O8 star. At = 500 pc ( = 8.5 mag), a B0 star should have an unreddened magnitude , and O stars would have . There are no obvious candidates in the vicinity of Simeis 57.
3.3 H emission and visual extinction
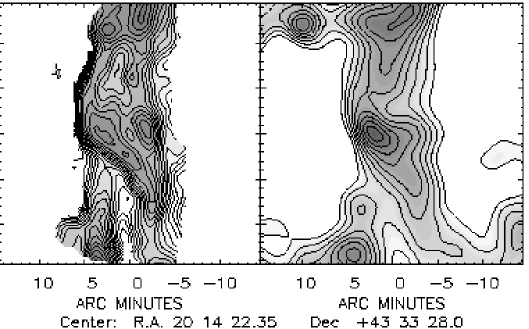

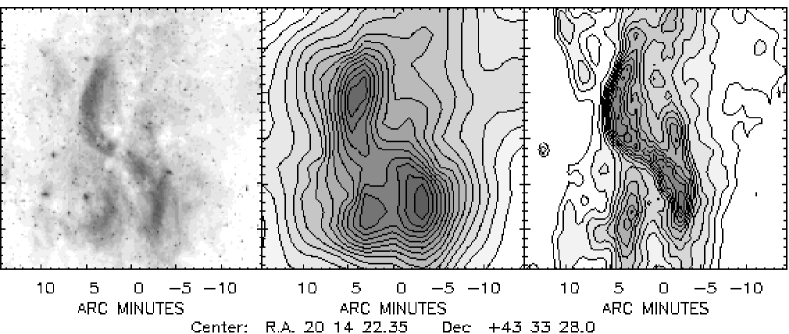
In Fig. 9 we compare, in detail, the central parts of the optical and radio images of Simeis 57. The close similiarity is not surprising. On the red PSS image, most of the nebular emission is expected to be a combination of H 656.3 nm) and [NII] 654.8 and 658.3 nm) line emission, i.e. similar in origin to the optically thin free free radio continuum emission. As the radio continuum and optical line emission thus trace the same ionized plasma, their distribution and intensity should be closely related. The PSS image, although fine in its detail, is not as well-suited to a quantative analysis as the 1.6′ resolution H image from the Virginia Tech Spectral-Line Survey (VTSS). We therefore decided to use the latter together with the 1420 MHz DRAO map convolved to the same resolution.
For an assumed electron temperature K, we expect at = 1420 MHz an optically thin emissivity:
| (1) |
whereas the Case B H emissivity (cf. Pengelly 1964) is:
| (2) |
so that:
| (3) |
As the H emission suffers from extinction and the radio continuum emission does not, we can use eqn. (3) to derive distribution of foreground extinction over the entire image of Simeis 57. Assuming a dust extinction law , this translates into visual extinctions .
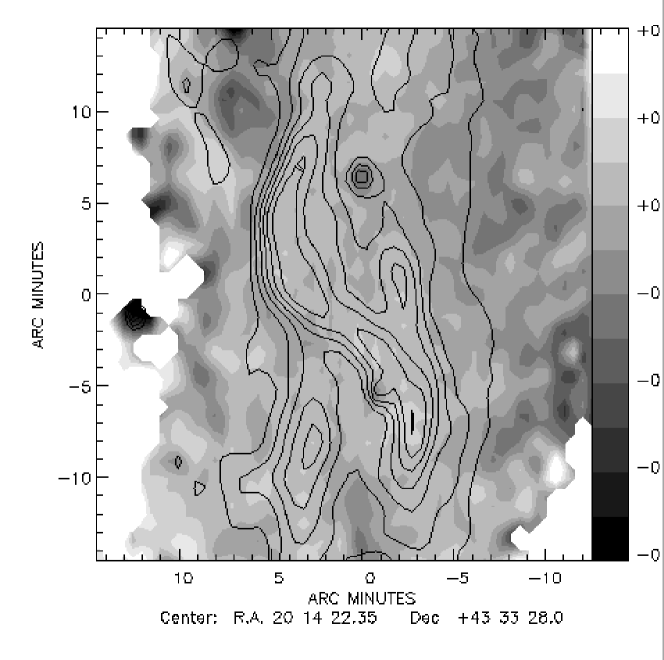
The distribution of foreground visual extinction thus determined is shown shown in Fig. 10. We have calculated its value only where both exceeds 100 R (1 Rayleigh photons cm-2 s-1 ster-1 = mJy Hz arcmin-2) and 10 mJy arcmin-2. The derived extinctions range from 1.0 to = 2.8 mag. The average extinction mag is in excellent agreement with the mean values of 2 mag apparent from the low-resolution (11′) extinction map published by Dickel Wendker (1978). Dust emission at m is also shown Fig. 10; the similarity between the two images suggest that most if not all of the depicted dust is in front of Simeis 57. At the same time, however, the similarity of the extinction map to the radio map also suggests that much of the material in front of the nebula is actually closely associated with it.
A more quantitative comparison of foreground extinction and 100m dust emission follow from Fig. 10 where we have plotted as a function of the far-infrared surface brightness at 100 m, . We found a reasonably good correlation from which an average ratio = 0.016 mag/(MJy/ster) can be determined. About 1.5 mag of extinction is not directly related to Simeis 57, but should probably be ascribed to cold, extended foreground dust. We will discuss the extinction and far-infrared properties of Simeis 57 in more detail in a subsequent paper.
4 Conclusions
-
1.
We have obtained high-resolution maps of the Galactic nebula Simeis 57 (= HS 191) at various radio continuum frequencies between 408 and 1420 MHz. Analysis of these data, and those gleaned from existing databases, shows the emission observed from the peculiar and complex nebula to be wholly thermal.
-
2.
Radio and optical images, including those taken in the H line of excited hydrogen, are very similar.
-
3.
Although neither distance nor source of excitation of Simeis 57 are known, electron densities and masses seem to be moderate, of the order of 100 and a few solar masses respectively. The extended emission may represent a gas mass up to a few dozen solar masses. Emission measures do not exceed 5000 pc cm-6.
-
4.
In front of Simeis 57, extinction varies from = 1.0 mag to = 2.8 mag with a mean of about 2 mag. Extinction and far-infrared (m) emission are well-correlated. Although much of the dust appears to be in front of the nebula, it is nevertheless closely associated with it.
Acknowledgements.
Roeland Rengelink kindly assisted us in extracting the 327 MHz map from the WENSS database. We are indebted to John Simonetti for permission to reproduce the Virginia Tech Spectral-Line Survey (VTSS) image; the VTSS is supported by the National Science Foundation (see http://www.phys.vt.edu/~halpha/)
References
- (1) Cohen R.S., Dame T.M., Garay G., et al. 1988 ApJL 331, L95
- (2) Cornwell T.J., 1988 A&A 202, 316
- (3) Davies R.D., Elliott H.K., Meaburn J., 1976 MNRAS 81, 89
- (4) Dennision B., Simonetti, J.H. Topasna G., 1998, PASAustral. 15, 147
- (5) Dickel H.R. Wendker H.J., 1977 A&AS 29, 209
- (6) Dickel H.R. Wendker H.J., 1978 A&A 66, 289
- (7) Dickel H.R., Wendker H. Bieritz J.H., 1969 A&A 1, 270
- (8) Dixon K. L., Johnson P. G. Songsathaporn, R. 1981 ApSS 78, 189
- (9) Gaze V. F. Shajn G. A. 1951 Izv. Krym. Astrofiz. Obs. 7, 93
- (10) Gaze V. F. Shajn G. A. 1955 Izv. Krym. Astrofiz. Obs. 15, 11
- (11) Goudis C., 1976 ApSS 44, 281
- (12) Habing H. J. Israel F. P., 1979 ARAA 17, 345
- (13) Higgs. L.A., 1989 J. Roy. Astron. Soc. Can. 83, 105
- (14) Higgs. L.A., Landecker T.L., Israel F.P. Bally J. 1991 J. Roy. Astron. Soc. Can. 85, 24
- (15) Karyagina S.V. Glushkov Yu. I., 1971 Astron. Tsirk. No. 632, p. 1
- (16) Landecker T.L., Dewdney P.E., Burgess T.A., et al. 2000 A&AS 145, 509
- (17) Langston G. I., Minter A. H. Freismuth T. M. 2000 AJ 119, 2801
- (18) Mezger P. G. Henderson A.P., 1967 ApJ 147, 471
- (19) Pengelly R.M., 1964 MNRAS 127, 145
- (20) Piepenbrink A. Wendker H.J., 1988 A&A 191, 313
- (21) Rengelink R.B., Tang Y., de Bruyn A.G., Miley G.K., Bremer M.N., Röttgering H.J.A. Bremer M.A.R. 1997 A&AS 124, 259
- (22) Wendker H., 1967 Zschft für Ap. 66, 379
- (23) Wendker H.J., 1970 A&A 4, 378
- (24) Wendker H.J., Higss L.A. Landecker T.L. 1991 A&A 241, 551
- (25) Westerhout G., 1958 Bull. Astron. Inst. Neth. 14, 215