Abstract
Extensive recent work on the Sunyaev-Zeldovich (S-Z) effect reflects major progress in observational capabilities of interferometric arrays, the improved quality of multi-frequency measurements with upcoming ground-based and stratospheric bolometer arrays, and the intense theoretical and experimental work on the small scale structure of the cosmic microwave background (CMB) radiation. I briefly describe the effect and discuss its significance as a major cosmological probe. Recent results for the gas mass fraction in clusters and the Hubble constant (largely from measurements with the BIMA and OVRO interferometric arrays) are discussed. Also reviewed are results from the first determination of the CMB temperature at the redshifts of two clusters (from measurements with the MITO and SuZIE experiments), and recent work on the CMB anisotropy due to the S-Z effect.
Introduction
The Sunyaev-Zeldovich (S-Z) effect is a small change in the intensity of the CMB that is caused by Compton scattering as the radiation passes through clusters of galaxies. Energy is transferred from the hot intracluster (IC) gas to the radiation and a fraction of the photons move from the Rayleigh-Jeans (R-J) to the Wien side of the (Planck) spectrum; the radiation is said to be Comptonized. A quantitative description of the effect was given by Zeldovich & Sunyaev (1969) and Sunyaev & Zeldovich (1972), who realized very early on the cosmological significance of this characteristic spectral signature.
First measurements of the effect in a small number of clusters were made long ago, but these were mostly low (signal) quality results. S-Z observations significantly improved when interferometric arrays equipped with high sensitivity receivers began to be used. The current high-quality S-Z database, consisting largely of GHz measurements with the BIMA and OVRO interferometric arrays (e.g. , Carlstrom et al. 1996, Grego et al. 2000, Reese et al. 2000), now includes some 60 clusters. At present, the S-Z cosmological results (Carlstrom et al. 2001) are based almost entirely on these (single frequency) measurements of a sample of moderately distant clusters.
This brief review highlights recent theoretical and observational results. The reviews by Rephaeli (1995a) and Birkinshaw (1999) provide a more comprehensive discussion of most of the essential theoretical and observational aspects of the effect. Results from the extensive program of observations with interferometric arrays were reviewed recently by Carlstrom et al. (2001).
The Effect
Accurate description of the change of CMB intensity due to interaction with fast moving electrons in clusters necessitates use of the exact frequency re-distribution function in Compton scattering and a relativistic calculation. The original description of the effect by Sunyaev & Zeldovich (1972) is based on a solution to the Kompaneets equation, a nonrelativistic diffusion approximation to the exact kinetic equation for the scattering. The nonrelativistic calculation yields a simple expression for the change of CMB intensity induced by scattering of the CMB by electrons with thermal velocity distribution
| (1) |
where , and is the CMB temperature. All the dependence on the properties of the cluster is in the Comptonization parameter,
| (2) |
an integral over the electron density () and temperature (); is the Thomson cross section. The spectral distribution is given in terms of the non-dimensional frequency ,
| (3) |
is negative for and positive at larger values of this critical frequency, GHz. The magnitude of the relative temperature change due to the thermal effect is in the R-J region, with along a line of sight (los) through the center of a rich cluster.
Likely motion of the cluster in the CMB frame induces a kinematic (Doppler) S-Z component,
| (4) |
where , with the line of sight component of the cluster peculiar velocity, and is the Thomson optical depth of the cluster. The associated temperature change of this component is (Sunyaev & Zeldovich 1980).
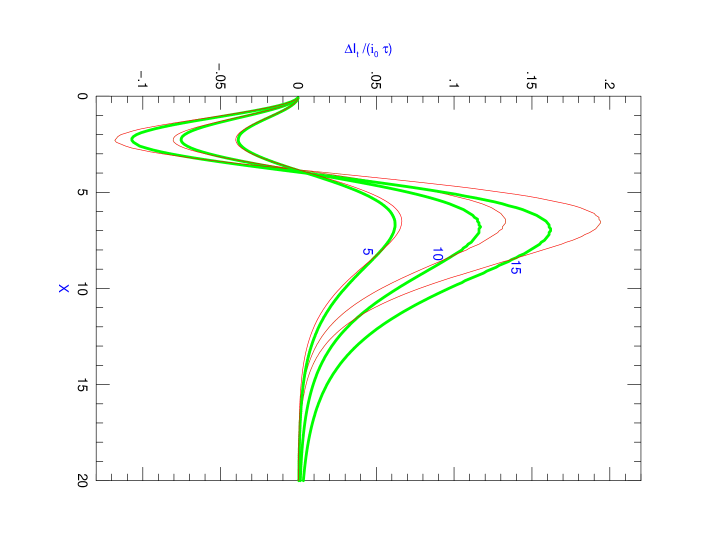
The above nonrelativistic expressions for the two components of the S-Z effect are sufficiently accurate only at low frequencies and low gas temperatures. An exact relativistic description of the effect is required for its use as a precise cosmological probe. Since electron velocities in the IC gas are high, the relative photon energy change in the scattering is large enough to require a relativistic calculation. Using the exact probability distribution in Compton scattering, and the relativistically correct form of the electron Maxwellian velocity distribution, an improved calculation of was performed in the limit of small (Rephaeli 1995b). Results of this semi-analytic calculation demonstrate that the relativistic spectral distribution of the intensity change is quite different from that derived by Sunyaev & Zeldovich (1972). Deviations from their expression increase with and can be substantial, as can be seen in Figure 1. These are particularly large near the crossover frequency, which shifts to higher values with increasing gas temperature.
Relativistic generalization of the Sunyaev & Zeldovich (1972) treatment has been discussed in many papers since 1995. For example, Challinor & Lasenby (1998) generalized the nonrelativistic Kompaneets equation and obtained analytic approximations to its solution by means of a power series in = . This approach was adopted by Itoh et al. (1998) who improved the accuracy of the analytic approximation by expanding to fifth order in . Sazonov & Sunyaev (1998), and Nozawa et al. (1998a), extended the relativistic treatment also to the kinematic component obtaining the leading cross terms in the expression for the total intensity change () which depends on both and . An improved analytic fit to the numerical solution, valid for , and ( GHz), was given by Nozawa et al. (2000). In all these treatments only terms linear in were calculated. Since in some rich clusters , the approximate analytic expansion to fifth order in necessitates also the inclusion of multiple scatterings, of order . Such terms were calculated by Itoh et al. (2000), and Shimon & Rephaeli (2002). The relativistically generalized expression for the total intensity change, , can be written (to first order in ) in the form:
| (5) |
where . The first two terms are just the nonrelativistic expressions for and , respectively, and the function includes the additional thermal and kinematic terms obtained in a relativistic calculation. This function can be written in the form
that includes terms to orders and . More details on the calculation, and the definitions of the functions and ( and ), can be found in Shimon & Rephaeli (2002).
Measurements with the interferometric BIMA and OVRO arrays have been made at (relatively) low frequencies ( GHz, or ) for which differences between the nonrelativistic and the above more exact expressions are small. But measurements of a few clusters have also been made at much higher frequencies (e.g. , up to in the case of the MITO telescope, and even higher for some of the upcoming S-Z projects). Use of the relativistically exact expressions for and is clearly necessary at high frequencies ( GHz). This is especially so when the effect is used for the purpose of determining precise values of cosmological parameters. Also, since the ability to determine peculiar velocities of clusters depends very much on measurements very close to the crossover frequency whose dependence on is approximately given by (Shimon & Rephaeli 2002). Note that because high precision S-Z work entails use of X-ray derived gas parameters, similarly accurate expressions for the X-ray bremsstrahlung emissivity have to be used (Rephaeli & Yankovitch 1997). In the latter paper first order relativistic corrections to the velocity distribution and electron-electron bremsstrahlung were taken into account in correcting values of the Hubble constant, , that were previously derived using the nonrelativistic expression for the emissivity (see also Hughes & Birkinshaw 1998, Nozawa et al. 1998b).
We briefly note that there are various ways by which the scattering of the CMB in clusters can (linearly) polarize the radiation, generally at levels which are below 1 K (Sazonov & Sunyaev 1999). First, polarization is induced due to the CMB quadrupole component, at a maximal level of K. When the cluster has a finite velocity component transverse to the line of sight, , there are two contributions to the polarization that are , and . The radiation will also be polarized when scattered in a cluster with aspherical electron distribution.
The great property of the S-Z effect which makes it a uniquely important cosmological probe is its (essentially) redshift independence. Measurements of the effect yield directly the integrated pressure of the hot IC gas, and thereby also the total mass of the cluster. The cluster velocity along the los can be deduced from measurement of the effect close to the corossover frequency. From S-Z and X-ray measurements (the angular diameter distance, and therefore) can be determined. This method to measure has clear advantages over the traditional galactic distance ladder method. It is also possible to determine the density parameter, , from the Hubble diagram (or from the redshift dependence of the gas mass fraction) when a sufficiently precise database on a large sample of clusters is available. The feasibility of detecting clusters at large redshifts strongly motivates performing number counts through cluster surveys in order to characterize the population and its cosmological evolution. Also, mapping the CMB anisotropy induced by clusters can yield important information on the cluster mass function, cluster properties and evolutio of the population. Finally, the anisotropy and redshift evolution of the CMB temperature, , can be tested and verified through multi-frequency measurements of the effect in clusters at different sky directions and redshifts. A brief summary of current results is given below.
Recent Measurements
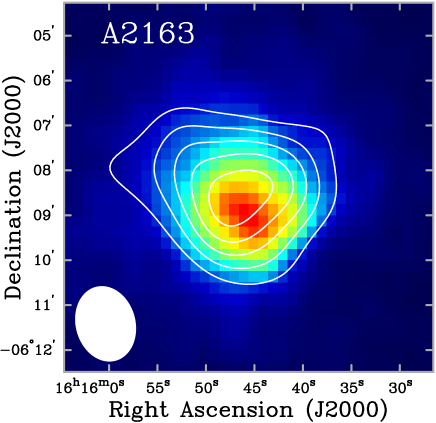
Sensitive ground based measurements of the thermal and kinematic components of the S-Z effect with single dish telescopes face the major challenge of accounting for atmospheric emission. The significance of astrophysical sources of confusion – such as emission from Galactic dust, cluster radio sources, and CMB anisotropy – varies greatly with the frequency of observation and telescope beam size. Over the last decade observational S-Z work has been carried out mostly with interferometric arrays. These have major advantages over single dish telescopes, including sensitivity to specific angular scales and to signals which are correlated between array elements, insensitivity to changes in atmospheric emission, and high angular resolution that enables nearly optimal subtraction of signals from point sources. The improved sensitivity of radio receivers made it feasible (mainly through the use of low-noise HEMT amplifiers) to image the effect in moderately distant clusters, first with the Ryle telescope (Jones et al. 1993), and then mostly with the BIMA and OVRO arrays (Carlstrom et al. 1996, 2001). The extensive program of S-Z observations with BIMA and OVRO has resulted in high quality measurements (at frequencies near GHz) of about 60 clusters in the redshift range . An example of the higher sensitivity and resolution of interferometric images over the traditional one dimensional drift scans, the BIMA image of A2163 (Carlstrom et al. 2001) is shown in Figure 2 above a profile of the effect in the same cluster from measurements with the small SuZIE array (Holzapfel et al. 1997a). The BIMA contour plot is superposed on a ROSAT X-ray image (false color) of the cluster; as expected, the cluster X-ray size appears smaller than its S-Z size.

The array configurations of BIMA and OVRO telescope systems used in the (above mentioned) measurements are not suitable for S-Z observations of nearby clusters. A more optimal system for imaging the effect over larger angular scales is the CBI – an interferometric array of 13 small (0.9m) dishes, with spatial resolution in the , operating in the 26-36 GHz spectral range. Work with the CBI began at the Atacama desert (Chile), and has already resulted (Udomprasert et al. 2001) in measurements of the effect in 9 clusters.
There are major advantages in measuring the effect at several high ( GHz) frequencies (close to and on the Wien side) where its characteristic spectral shape can be used as a powerful discriminant to control observational and systematic uncertainties. Multi-frequency measurements of the effect also enhance its scope as a cosmological probe; an example for this will be shown in the next section. High frequency observations were made with the SuZIE array, the PRONAOS and MITO telescopes, and the Diabolo bolometer. Three moderately distant clusters were measured with the SuZIE element array: A1689 & A2163 (Holzapfel et al. 1997a, 1997b; the S-Z profile across A2163 is shown in Figure 2), and A1835, which was observed at three spectral bands centered on 145, 221, 279 GHz (Mauskopf et al. 2000). Work with SuZIE continued with measurements of at 6 more clusters (S. Church, private communication).
PRONAOS, a stratospheric 2m telescope, measured the effect in A2163 at four broad spectral bands in the combined range of 285-1765 GHz (Lamarre et al. 1998). This seems to have been the first detection of the effect by a balloon-borne experiment. The MITO 2.6m telescope (located in Testa Grigia in the Italian Alps) originally had only a single photometer with a large beam and four high-frequency bands. Even so it was possible to measure the effect in the Coma cluster (De Petris et al. 2002), in spite of the fact that the fluctuating atmospheric emission dominated the signals. The sample of clusters in which the S-Z effect was measured includes the distant (z=0.45) cluster RXJ 1347 with the largest deduced Comptonization parameter, (Pointecouteau et al. 1999), one of 5 clusters observed with the Diabolo bolometer used at the IRAM 30m radio telescope.
Cluster and Cosmological Parameters
The well understood nature of the S-Z effect and its redshift independence have always provided strong motivation for using it as a cosmological probe. Availability of the high quality interferometric S-Z data obtained with BIMA and OVRO has significantly improved the scientific yield from results of S-Z and X-ray measurements. The following is only brief update on current results; discussion of the basic methodologies can be found in the reviews by Rephaeli (1995a), Birkinshaw (1999), and Carlstrom et al. (2001).
Cluster Quantities
Density and temperature profiles of IC gas can be determined from X-ray and S-Z measurements. Spatially resolved S-Z measurements can, in principle, yield these distributions out to larger radii due to the linear dependence of on , as compared to the dependence of the thermal X-ray brightness profile. The equation of hydrostatic equilibrium can then be used to find the cluster total mass, , and therefore also the gas mass fraction at a given radius, . Grego et al. (2001) determined gas mass fractions in 18 clusters from interferometric BIMA and OVRO measurements. They assumed isothermal gas with the familiar density profile, . The core radius, , and were determined from the S-Z data; only the temperature was taken from results of spectral X-ray measurements. This analysis yielded the gas mass fraction in the region were the S-Z data are sufficiently sensitive (typically 1’). Scaling relations from numerical simulations were then used to extrapolate the gas mass fraction to a distance where the cluster mean density is 500 times the critical density (at the appropriate redshift), since it is presumed that at this distance the cluster gas mass fraction well samples the universal baryon fraction (Evrard 1997). In the currently popular open and flat, -dominated CDM models, mean values in the range (where is the value of in units of km s-1 Mpc-1) were obtained for the gas mass fraction (Carlstrom et al. 2001). Use of more realistic temperature profiles that can now be measured by XMM and Chandra will reduce the substantial modeling uncertainties in these mass estimates.
To measure cluster radial velocities from the kinematic component of the S-Z effect observations have to be made in a narrow spectral band near the crossover frequency, where the thermal effect vanishes while the kinematic effect (which is usually swamped by the much larger thermal component) is maximal (Rephaeli & Lahav 1991). This necessitates knowledge of the exact spectral shape of the thermal component near this frequency, and control of significant systematic uncertainties (such as due to the primary CMB anisotropy). SuZIE is the first experiment with a spectral band centered on the crossover frequency. Measurements of the clusters A1689 and A2163 (Holzapfel et al. 1997b) and A1835 (Mauskopf et al. 2000) yielded substantially uncertain results for (, , and km s-1, respectively). Balloon-borne measurements of the effect with PRONAOS have also resulted in a statistically insignificant value for the peculiar velocity of A2163 (Lamarre et al. 1998).
and
The Hubble constant and the contributions to the cosmological density parameter – that of matter, , and the cosmological constant, – can be determined from a plot of the angular diameter distance, , vs. redshift (Hubble diagram). The ability to infer from S-Z and X-ray observations is essentially based on the different density dependences of Comptonization and thermal bremsstrahlung. Specifically, can be deduced from , the X-ray surface brightness, and their spatial profiles. It is (at least currently) unrealistic to obtain a usefully precise value of from measurements of any single cluster, due mostly to large systematic uncertainties. Modeling and other systematic errors can be significantly reduced by averaging over values of from measurements of a large number of clusters. First, can be determined from a sufficiently large sample of nearby clusters (whose angular diameter distances are little affected by the geometry of the universe). An initial sample of eight measured values yielded km s-1 Mpc-1 (Rephaeli 1995b). A similar mean value ( km s-1 Mpc-1) was deduced by Birkinshaw (1999) based on a somewhat updated data set. The interferometric BIMA and OVRO S-Z survey provides the first relatively uniform dataset for the determination of . Since the set of 33 available values (from single dish as well as interferometric measurements) for includes measurements of clusters up to , the deduced mean value depends on the cosmological model: km s-1 Mpc-1 for a flat model with and , and km s-1 Mpc-1 for an open model with (Carlstrom et al. 2001). While this overall () observational error is small, the estimated systematic uncertainty is .
In principle, the dependence of the cluster gas mass fraction on the angular diameter distance provides a way to constrain the matter and cosmological constant density parameters. In a flat model, , the fit to the interferometric data yields (Carlstrom et al. 2001).
CMB Temperature
Measurements with the COBE/FIRAS experiment have shown that the CMB spectrum is a precise Planckian with K at the current epoch (Mather et al. 1999). In the standard cosmological model, , a fundamental relation which has not yet been observationally confirmed to the desired extent. Cosmological models with a purely blackbody spectrum but with a different dependence than in the standard model are – formally, at least – unconstrained by the FIRAS measurements. Also unconstrained are models with spectral distortions that are now negligible, but may have been appreciable in the past. Thus far has been determined mainly from measurements of microwave transitions in interstellar clouds in which atoms and molecules are excited by the CMB; for more on this see the review by LoSecco et al. (2001). The temperature has been determined in the Galaxy, as well as in clouds at redshifts up to . Results are, however, substantially uncertain due to the poorly known physical conditions in the absorbing clouds.
The use of the thermal S-Z effect to measure has been suggested long ago. Fabbri, Melchiorri & Natale (1978) proposed spectral mapping of the effect near the crossover frequency whose value depends on . This is very challenging given the dominating confusing signals – such as due to the primary CMB anisotropy and the kinematic S-Z component – and the fact that in the relativistic treatment (of the effect) the crossover frequency depends on gas temperature, whose value has to be known very precisely if this method is to yield useful results for . Rephaeli (1980) proposed a more feasible method which exploits the steep frequency dependence of on the Wien side, and the weak dependence of ratios of the intensity change at different frequencies on the properties of the cluster. Formally, in the nonrelativistic limit such a ratio is completely independent of the Comptonization parameter. Most of the dependence on the cluster parameters still drops out also in the exact relativistic description, but a weak dependence remains on the gas temperature. When unknown, the cluster velocity introduces a small systematic uncertainty (which is, however, much smaller than in the case of measurements near the crossover frequency). Thus, S-Z measurements have the potential of yielding more precise values of than can be obtained from ratios of atomic and molecular lines.
With the availability of spectral measurements of the S-Z effect, the method of Rephaeli (1980) has recently been employed to measure in the Coma and A2163 clusters (Battistelli 2002). Spectral measurements of Coma () included observations at central frequencies , , and GHz (each with a GHz bandwidth), made with with the MITO telescope (De Petris et al. 2002), and the low frequency GHz (with a GHz bandwidth) OVRO measurement (Herbig et al. 1995). Measurements of A2163 () were made with the SuZIE array (Holzapfel et al. 1997a) at , , and GHz (with GHz bandwidths), and a combined BIMA and OVRO measurement at GHz (LaRoque et al. 2002). The measurements yield three independent intensity ratios for each cluster; all combinations of these ratios were compared to the theoretically predicted values. The latter were calculated by performing integrations of the relativistic expression for over the spectral bands of the MITO photometer, and of the other receivers when available. Fits of the measured ratios to the predicted values were performed, yielding best fit values for the CMB temperature at the redshifts of the two clusters. (For more on the data analysis and estimates of the uncertainties, see Battistelli et al. 2002.)
The results for the temperatures are K and K (at 68% confidence). These values are consistent with those expected from the standard relation . Battistelli et al. (2002) have also tested two alternative scaling relations that are conjectured in non-standard cosmologies, , and (e.g., Lima et al. 2000). They determined the best fit values for the two parameters to be , and (at 95% confidence). Within the large uncertainties these values are consistent with zero, so no significant deviation is found from the standard model. LoSecco et al. (2001) obtained and (at 95% CL) from measurements of microwave transitions. The two sets of results are consistent. Thus, the S-Z results of Battistelli et al. (2002) already provide the same level of precision even though the two clusters are at much lower redshifts than the galaxies in the observational sample used by LoSecco et al. (2001). With more precise multi-spectral S-Z measurements expected in the future, it is anticipated that the S-Z method will provide a preferred alternative to the atomic and molecular lines method.
S-Z Anisotropy
The anisotropy in the CMB induced by clusters has been extensively explored (since it was first modeled [Rephaeli 1981] in the context of a simple model for IC gas evolution), reflecting increased realization of its significance on arcminute scales. Since this anisotropy arises from the scattering of the CMB in the evolving population of clusters, its power spectrum and cluster (S-Z) number counts can potentially yield important information on the properties of IC gas, the cluster mass function, cosmological evolution of clusters and their gaseous contents, as well as some of the global cosmological and large scale parameters. Clearly, therefore, a quantitative description of this anisotropy entails the added need (when compared with a calculation of the primary CMB anisotropy) of modeling gas properties across the evolving population of clusters.
The usual approach to the calculation of the S-Z anisotropy is based on the Press-Schechter model for the cluster mass function, , the comoving density of clusters of mass M at redshift z. Following collapse and virialization, IC gas is presumed to have reached hydrostatic equilibrium at the virial temperature, with a density distribution that is commonly assumed to have an isothermal profile. The mass function is normalized by specifying the mass variance on a scale of , , a parameter that is determined from the observed X-ray temperature function by using a mass-temperature calibration. The calibration is limited to clusters at small redshifts. The cluster induced anisotropy has been studied at an increasingly greater degree of sophistication and detail and in wide range of cosmological and dark matter models beginning about a decade ago (e.g. , Makino & Suto 1993, Bartlett & Silk 1994). In particular, Colafrancesco et al. (1994) calculated the temperature anisotropy in a flat CDM model including gas evolution (based on results from the Einstein Medium Sensitivity Survey [EMSS]). They later extended the work to other cosmological models and estimated also that many thousands of clusters are expected to be detected during the planned Planck survey (Colafrancesco et al. 1997). S-Z maps and power spectra can also be generated directly from hydrodynamical simulations (e.g. , da Silva et al. 2000). The range of cosmological models was extended to include currently viable CDM models (e.g. , Komatsu & Kitayama 1999, Molnar & Birkinshaw 2000, Cooray et al. 2000).
Reflecting the parameter intensive nature of the S-Z anisotropy (with the added complexity due to the need to describe the dynamical as well as hydrodynamical evolution of clusters), results for predicted power spectra and number counts span a wide range even when calculated for the same cosmological model. Aside from obvious reasons for some of the differences, such as differing choices of gas parameters and degree of the evolution of the gas mass fraction, results differ also due to inconsistent choice of parameters whose values are coupled. An example is a conflicting choice of the adopted value of , and a different mass-temperature relation than assumed in order to determine itself (for more on this, see Sadeh & Rephaeli 2002).
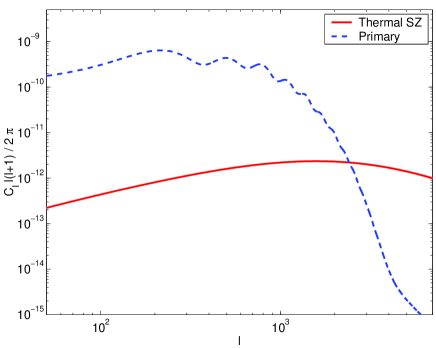
The main features of the power spectrum of the thermal component of the S-Z anisotropy are shown in Figure 3; results are from the work of Sadeh & Rephaeli (2002) who have calculated power spectra of the S-Z and primary anisotropies in an array of cosmological and dark matter models. The S-Z power spectrum, based on a Press & Schechter mass function, was normalized by the observed X-ray luminosity function. The primary power spectrum (dashed line) was calculated using the CMBFAST code of Seljak & Zaldarriaga (1996). The plots are of the predicted power spectrum, vs. multipole , in a flat cosmological model with , and CDM density parameter . IC gas was assumed to evolve in a simple manner consistent with the results of the EMSS survey, as parametrized by Colafrancesco et al. (1994). In this model the S-Z anisotropy (which is dominated by the thermal effect; the contribution of the kinematic effect is of second order) is appreciable already at . Clearly, the S-Z anisotropy has to be accounted for in the detailed modeling of the small scale structure of the CMB, if parameter extraction is to be precise. The first observational evidence for S-Z anisotropy could possibly be the recent CBI measurement of excess power (at an estimated level) over what is predicted in standard models for the primary anisotropy at multipoles – (Mason et al. 2002, Bond et al. 2002).
Prospects for the Near Future
The quality of the scientific yield from the many S-Z images obtained over the last few years with interferometric arrays has made quite apparent the great potential of the S-Z effect as a major cosmological probe. This is just the beginning: Numerous S-Z projects will become operational in the near future, both bolometric multi-frequency arrays, and interferometric arrays; these include the ground-based (upgraded) MITO telescope, the SZA, AMiBA, and the balloon-borne telescopes BOOST and OLIMPO. Improved sensitivity, higher spatial resolution, and expanded spectral range will greatly improve the quality of S-Z measurements. Better understanding and control of systematics will continue to determine the overall value of cosmological results from S-Z and X-ray measurements. Beacause of this, optimal results will likely be obtained from measurements of the effect in nearby () clusters. For example, higher quality S-Z and X-ray measurements of a sufficiently large sample of nearby clusters are expected to result in an overall uncertainty of in the value of .
References
- Bartlett and Silk (1994) Bartlett, J.G., and Silk, J. (1994), ApJ, 423, 12.
- Battistelli et al. (2002) Battistelli, E. et al. (2002), ApJ, in press (astro-ph/0208027).
- Birkinshaw (1999) Birkinshaw, M. (1999), Phys.Rep., 310, 97.
- Bond et al. (2002) Bond, J.R.. et al. (2002), astro-ph/0205386.
- Carlstrom et al. (1996) Carlstrom, J.E., Joy, M. and Grego, L. (1996), ApJ, 456, L75.
- Carlstrom et al. (2001) Carlstrom, J.E. et al. (2001), astro-ph/0103480.
- Challinor and Lasenby (1998) Challinor, A. and Lasenby, A. (1998), ApJ, 510, 930.
- Colafrancesco et al. (1994) Colafrancesco, S., Mazzotta, P., Rephaeli, Y. and Vittorio, N. (1994), ApJ, 433, 454.
- Colafrancesco et al. (1997) Colafrancesco, S., Mazzotta, P., Rephaeli, Y. and Vittorio, N. (1997), ApJ, 479, 1.
- Cooray et al. (2000) Cooray, L., Hu, W. and Tegmark, M. (2000), ApJ, 540, 1.
- da Silva et al. (2000) da Silva, A.C. et al. (2000), MNRAS, 317, 37.
- (12) De Petris, M. et al. (2002), ApJ, 574, L119.
- Evrard (1997) Evrard, A. (1997), MNRAS, 292, 289.
- (14) Fabbri, R., Melchiorri, F., & Natale V. (1978), Astrophy. & Space Science, 59, 223.
- Grego et al. (2000) Grego, L. et al. (2000), ApJ, 539, 39.
- Grego et al. (2001) Grego, L. et al. (2001), ApJ, 552, 2.
- Herbig et al. (1995) Herbig, T., Lawrence, C.R. & Readhead, A.C.S., (1995), ApJ, 449, 5.
- Holzapfel et al. (1997a) Holzapfel, W.L. et al. (1997a), ApJ, 480, 449.
- Holzapfel et al. (1997b) Holzapfel, W.L. et al. (1997b), ApJ, 481, 35.
- Hughes and Birkinshaw (1998) Hughes, J.P. and Birkinshaw, M. (1998), ApJ, 501, 1
- Itoh et al. (1998) Itoh, N., Kohyama, Y. and Nozawa, S. (1998), ApJ, 502, 7.
- Itoh et al. (2000) Itoh, N., Nozawa, S. and Kohyama, Y. (2000), MNRAS, 327, 567.
- Jones et al. (1993) Jones, M. et al. (1993), Nature, 365, 320.
- Komatsu and Kitayama (1999) Komatsu, E. & Kitayama T. (1999), ApJ, 526, L1.
- Lamarre et al. (1998) Lamarre, J.M. et al. (1998), ApJ, 507, L5.
- 2002 (2002) LaRoque, S.J., et al. (2002), submitted to ApJ (astro-ph/0204134).
- Lima et al. (2000) Lima, J.A.S., et al. (2000), MNRAS, 312, 747.
- (28) LoSecco, J.M., Mathews, G.J. and Wang, Y. (2001), astro-ph/0108260.
- Mason et al. (2002) Mason, B.S., et al. (2002), astro-ph/0205384.
- Mather et al. (1999) Mather, J.C., et al. (1999), ApJ, 512, 511.
- Makino and Suto (1993) Makino, N. & Suto, Y. (1993), ApJ, 405, 1.
- Molnar and Birkinshaw (2000) Molnar. S.M., and Birkinshaw M. (2000), ApJ, 537, 542.
- Mauskopf et al. (2000) Mauskopf, P.D. et al. (2001), ApJ, 538, 505.
- Nozawa et al. (1998a) Nozawa, S., Itoh, N. and Kohyama, Y. (1998), ApJ, 507, 530.
- Nozawa et al. (1998b) Nozawa, S., Itoh, N. and Kohyama, Y. (1998b), ApJ, 508, 17.
- Nozawa et al. (2000) Nozawa, S. et al. (2000), ApJ, 536, 31.
- Pointecouteau et al. (1999) Pointecouteau, E. et al. (1999), ApJ, 519, L115.
- Reese et al. (2000) Reese, E.D. et al. (2000), ApJ, 533, 38.
- Rephaeli (1980) Rephaeli, Y. (1980), ApJ, 241, 858.
- Rephaeli (1981) Rephaeli, Y. (1981), ApJ, 351, 245.
- Rephaeli (1995a) Rephaeli, Y. (1995a), ARAA, 33, 541.
- Rephaeli (1995b) Rephaeli, Y. (1995b), ApJ, 445, 33.
- Rephaeli and Lahav (1991) Rephaeli, Y. and Lahav, O. (1991), ApJ, 372, 21.
- Rephaeli and Yankovitch (1997) Rephaeli, Y. and Yankovitch, D. (1997), ApJ, 481, L55.
- Sadeh and Rephaeli (2002) Sadeh, S. and Rephaeli, Y. (2002), preprint.
- Sazonov and Sunyaev (1998) Sazonov, S.Y. and Sunyaev, S.Y. (1998), ApJ, 508, 1.
- Sazonov and Sunyaev (1999) Sazonov, S.Y. and Sunyaev, S.Y. (1999), MN, 310, 765.
- Seljak and Zaldarriaga (1996) Seljak, U. and Zaldarriaga, M. (1996), ApJ, 469, 437.
- Shimon and Rephaeli (2002) Shimon, M. and Rephaeli, Y. (2002), preprint
- Sunyaev and Zeldovich (1972) Sunyaev, R.A. and Zeldovich, Y.B. (1972), Comm.Ap.Sp.Phys., 4, 173.
- Sunyaev and Zeldovich (1980) Sunyaev, R.A. and Zeldovich, Y.B. (1980), MN, 190, 413.
- Udomprasert et al. (2000) Udomprasert, P.S., Mason, B.S. and Readhead, A.C.S. (2000), astro-ph/0012248.
- Zeldovich and Sunyaev (1969) Zeldovich, Y.B. and Sunyaev, R.A., (1969), Comm.Ap.Sp.Phys., 4, 301.