Star Cluster Formation and Disruption Time-Scales – II. Evolution of the Star Cluster System in M82’s Fossil Starburst
Abstract
We obtain new age and mass estimates for the star clusters in M82’s
fossil starburst region B, based on improved fitting methods. Our new
age estimates confirm the peak in the age histogram attributed to the
last tidal encounter with M81; we find a peak formation epoch at
slightly older ages than previously published, , with a Gaussian of . The actual duration of the burst of cluster formation
may have been shorter because uncertainties in the age determinations
may have broadened the peak. Our improved mass estimates confirm that
the (initial) masses of the M82 B clusters with mag are
mostly in the range , with a median mass of . The formation history of the observed
clusters shows a steady decrease towards older ages. This indicates
that cluster disruption has removed a large fraction of the older
clusters.
Adopting the expression for the cluster disruption time-scale of
with
(Paper I), we find that the ratios between the real cluster formation
rates in the pre-burst phase (), the
burst-phase () and the post-burst phase
() are about . The formation
rate during the burst may have been higher if the actual duration of the
burst was shorter than adopted.
The mass distribution of the clusters formed during the burst shows a
turnover at which is not caused by
selection effects. This distribution can be explained by cluster
formation with an initial power-law mass function of slope up
to a maximum cluster mass of , and
cluster disruption with a normalisation time-scale . For a burst age of yr, we find that the disruption time-scale of a cluster of
is years, with an uncertainty of
approximately a factor of two. This is the shortest disruption
time-scale known in any galaxy.
keywords:
diffusion – galaxies: individual: M82 – galaxies: starburst – galaxies: star clusters1 Introduction
1.1 Multiple starbursts in M82
M82 is often regarded as the “prototype” starburst galaxy. Observations over the entire wavelength range, from radio waves to X-rays (see, e.g., Telesco 1988 and Rieke et al. 1993 for reviews), seem to support a scenario in which tidal interactions, predominantly with its large neighbour M81, triggered intense star formation in the centre of this small irregular galaxy during the last several 100 Myr. The resulting starburst, with the high star formation rate of yr-1, has continued up to about 50 Myr ago (e.g., O’Connell & Mangano 1978, Rieke et al. 1993). Energy and gas ejection from supernovae and combined stellar winds drive a large-scale galactic wind along the minor axis of M82 (e.g., Lynds & Sandage 1963, McCarthy et al. 1987, Shopbell & Bland-Hawthorn 1998).
All of the bright radio and infrared sources associated with the active starburst are found in a small region within a radius of pc from the galaxy’s centre, but most of this volume is heavily obscured by dust at optical wavelengths.
However, there is now compelling evidence that the active starburst was not the only major starburst event to have occurred in M82. A region at pc from the centre, “M82 B” (nomenclature from O’Connell & Mangano 1978), has the high surface brightness and spectral features expected for an ancient starburst with an age in excess of several 100 Myr and an amplitude similar to the active burst (O’Connell & Mangano 1978, Marcum & O’Connell 1996, de Grijs et al. 2001, hereafter dGOG). Its spectral features resemble the characteristics of the anomalous “E+A” spectra found in distant galaxy clusters, which are generally interpreted as the signature of a truncated burst of star formation that occurred Myr earlier (e.g., Couch & Sharples 1987, Dressler & Gunn 1990, Couch et al. 1998). It is thought that these starbursts are closely related to the process by which disc galaxies are converted into elliptical or lenticular galaxies and they are thought to result from tidal interactions, mergers, or perhaps ram-pressure stripping by the intergalactic medium (Butcher & Oemler 1978, Oemler 1992, Barger et al. 1996).
The significance of the detailed study of M82’s starburst environment lies, therefore, in the broader context of galaxy evolution. Starbursts of this scale are likely to be common features of early galaxy evolution, and M82 is the nearest analogue to the sample of star-forming galaxies recently identified at high redshifts (; Steidel et al. 1996, Giavalisco et al. 1997, Lowenthal et al. 1997). In addition, M82 affords a close-up view not only of an active starburst – in M82 A, C and E – but also, in region B and elsewhere, of the multiple post-burst phases.
In a recent study focusing on the fossil starburst site, M82 B, we found a large population of () evolved compact star clusters (dGOG), whose properties appear to be consistent with them being evolved (and therefore faded) counterparts of the young (super) star clusters detected in the galaxy’s active core (O’Connell et al. 1995). Based on broad-band optical and near-infrared colours and comparison with stellar evolutionary synthesis models, we estimated ages for the M82 B cluster population from Myr to over 10 Gyr, with a peak near 650 Myr (see also de Grijs 2001). About 22 per cent of the clusters in M82 B are older than 2 Gyr, with a roughly flat distribution to over 10 Gyr. Very few clusters are younger than 300 Myr. The full-width of the peak at 650 Myr is Myr, but this is undoubtedly broadened by the various uncertainties entering the age-dating process. The selection bias of the star clusters in dGOG is such that the truncation of cluster formation for ages Myr is better established than the roughly constant formation rate at ages Gyr.
Thus, we suggested steady, continuing cluster formation in M82 B at a very modest rate at early times ( Gyr ago) followed by a concentrated formation episode lasting from 400–1000 Myr ago and a subsequent suppression of cluster formation (dGOG).
1.2 Cluster disruption time-scales
In the determination of the cluster formation history from the age distribution of magnitude-limited cluster samples, cluster disruption must be taken into account. This is because the observed age distribution is that of the surviving clusters only. Therefore, in this study of the evolution of the star cluster system in M82’s fossil starburst region, we determine both its cluster formation history and the characteristic disruption time-scales.
The dynamical evolution of star clusters is determined by a combination of internal and external time-scales. The free-fall and two-body relaxation time-scales, which depend explicitly on the initial cluster mass density (e.g., Spitzer 1957, Chernoff & Weinberg 1990, de la Fuente Marcos 1997, Portegies Zwart et al. 2001), affect the cluster-internal processes of star formation and mass redistribution through energy equipartition, leading to mass segregation and, eventually, core collapse (see, e.g., de Grijs et al. [2002a,b] for a detailed description of mass segregation effects in young star clusters). While the internal relaxation process will, over time, eject both high-mass stars from the core (e.g., due to interactions with hard binaries; see Brandl et al. 2001, de Grijs et al. 2002a) and lose lower-mass stars from its halo through diffusion (e.g., due to Roche-lobe overflow), the external process of tidal disruption and stripping by the surrounding galactic field is in general more important for the discussion of the disruption of star clusters.
Tidal disruptive processes are enhanced by “normal” stellar evolutionary effects such as mass loss by winds and/or supernova explosions, which will further reduce the stellar density in a cluster, and thus make it more sensitive to external tidal forces.
From the bimodal age distribution of (young) open and (old) globular clusters in the Milky Way, Oort (1957) concluded that disruption of Galactic star clusters must occur on time-scales of yr. Around the same time, Spitzer (1957) derived an expression for the disruption time scale as a function of a cluster’s mean density, ( pc-3): yr, for pc-3. More advanced recent studies, based on N-body modeling, have shown that the cluster disruption time-scale is sensitive to the cluster mass, the fraction of binary (or multiple) stars, and the initial mass function (IMF) adopted (e.g., Chernoff & Weinberg 1990, de la Fuente Marcos 1997).
Boutloukos & Lamers (2001, 2002) derived an empirical relation between the disruption time and a cluster’s initial mass for the Milky Way, the Small Magellanic Cloud (SMC), M33 and the inner spiral arms of M51. They showed, based on an analysis of the mass and age distributions of magnitude-limited samples of clusters, that the empirical disruption time of clusters depends on their initial mass () as
| (1) |
where is the disruption time of a cluster of initial mass . The value of is approximately the same in these four galaxies, . However, the characteristic disruption time-scale is widely different in the different galaxies. The disruption time-scale is longest in the SMC ( Gyr) and shortest in the inner spiral arms of M51 ( Myr). We will derive the disruption time-scale of clusters in M82 B and allow for disruption in the determination of the cluster formation history.
In Section 2, we will summarise the observations on which our discussion is based, and in Section 3 we obtain new age and mass estimates for the clusters in M82 B, based on the 3/2DEF method (3/2-dimensional energy-fitting method; Bik et al. 2002) of fitting the observed spectral energy distribution to that of cluster evolution models. In Section 4 we derive the cluster formation history and the characteristic cluster disruption time-scale. In Section 5 we discuss the mass distribution of the clusters formed during the burst. The methods and assumptions are discussed in Section 6; finally, we will summarise and conclude the paper in Section 7.
2 Observations
The observations on which our analysis of the M82 cluster formation history is based were described in detail in dGOG. Briefly summarised, we observed region B with the Wide Field Planetary Camera 2 (WFPC2) on board the Hubble Space Telescope (HST) through the F439W, F555W and F814W filters, roughly corresponding to the standard Johnson-Cousins B, V and I passbands, respectively. We obtained WFPC2 observations using two pointings, so that the entire region B was covered by the Planetary Camera (PC) chip, the highest-resolution optical imaging instrument available on board HST at that time, with a pixel size of . The effective integration times used for the F439W, F555W, and F814W observations were 4400s, 2500s and 2200s, respectively, for the western half of M82 B and 4100s, 3100s and 2200s, respectively, for the eastern half closest to the galaxy’s starburst core.
In addition, we imaged the entire region with HST’s Near-Infrared Camera and Multi-Object Spectrometer (NICMOS) (Camera 2; pixel size ) in both the F110W and F160W filters (comparable to the Bessell J and H filters, respectively), in a tiled pattern of partially overlapping exposures. The integrations, with effective integration times of 768s for each of the eastern and western halfs of M82 B and each filter, were taken in MULTIACCUM mode to preserve dynamic range and to correct for cosmic rays.
We subsequently obtained integrated photometry for the extended objects (i.e., star clusters) in M82 B down to a 50 per cent completeness limit of mag. Because of the highly variable background and the numerous spurious features due to dust lanes and background variations, we decided to select only genuine star cluster brighter than for further analysis, corresponding to close to 100 per cent completeness (dGOG).
3 Observed cluster mass and age distributions
For the final 113 objects obtained following the procedures outlined in the previous section, dGOG used versus colour-colour diagrams to disentangle age and extinction effects, since the age and extinction vectors are not entirely degenerate for this choice of optical colours.
Accurate age and mass determinations are essential for the analysis of cluster formation and disruption time-scales performed in this paper. Combining the observed luminosities of the M82 B star cluster population with the appropriate, age-dependent mass-to-light ratios from spectral synthesis models provided us with photometric mass estimates with an accuracy of well within an order of magnitude. Independent dynamical mass estimates from high-resolution spectroscopy are available only for a few of the most luminous super star clusters seen in the nearest starburst galaxies (M82, the Antennae, NGC 1569 and NGC 1705), and are approximately (Ho & Filippenko 1996a,b, Smith & Gallagher 2000, Mengel et al. 2002). Because of the proximity of M82, we have been able to probe the young cluster population in M82 B to fainter absolute magnitudes, and thus lower masses, than has been possible before in other starburst galaxies. Other young star cluster samples are biased towards high masses by selection effects due to their host galaxies’ greater distances.
Keeping the importance of the age dependence on our photometric mass estimates in mind, we decided to redetermine the M82 B cluster ages using the full parameter space available. We obtained more accurate age determinations by also including the NICMOS observations, and solving for the best-fitting ages matching the full spectral energy distributions (SEDs) of our sample clusters, from the F439W to the F160W passband. We compared the observed cluster SEDs with the model predictions for an instantaneous burst of star formation, assuming a Salpeter IMF from with power-law slope to obtain our new estimates for the cluster age t, initial mass and extinction ; for the latter we adopted the (Galactic) extinction law of Scuderi et al. (1996). For ages yr we used the Starburst99 models (Leitherer et al. 1999), while for older ages we used the most recent single stellar population models by Bruzual & Charlot (2000, hereafter BC00). Examples of our model fits to the observed cluster SEDs are shown in Fig. 1.
We realise that recent determinations of the stellar IMF deviate significantly from a Salpeter-type IMF at low masses, in the sense that the low-mass stellar IMF is significantly flatter than the Salpeter slope. The implication of using a Salpeter-type IMF for our cluster mass determinations is therefore that we have overestimated the individual cluster masses (although the relative mass distribution of our entire cluster sample remains unaffected). Therefore, we used the more modern IMF of Kroupa, Tout & Gilmore (1993, hereafter KTG) to determine the correction factor, , between our masses and the more realistic masses obtained from the KTG IMF (both normalised at ). This IMF is characterised by slopes of for , for , and for . Depending on the adopted slope for the lowest mass range, we have therefore overestimated our individual cluster masses by a factor of for an IMF containing stellar masses in the range .

The fitting of the observed cluster SEDs to the Starburst99 and BC00 models was done using a three-dimensional maximum likelihood method, 3/2DEF, with the initial mass , age and extinction as free parameters (see Bik et al. 2002). For the 46 clusters with upper limits in one or more filters we used a two-dimensional maximum likelihood fit, using the extinction probability distribution for . This distribution was derived for the clusters with well-defined SEDs over the full wavelength range (see Bik et al. 2002). We obtained reliable age estimates based on the full SED modeling for 81 of the 113 clusters. The new age and mass estimates for these 81 clusters are listed in Table 1, where the individual clusters are identified by their dGOG ID. The dGOG mass estimates in Table 1 were determined by combining the absolute magnitudes of the clusters with their age-dependent mass-to-light ratios.
| This paper | dGOG | ||||||||||||
| Object | log(Age/yr) | log()a | E (mag) | log(Age/yr) | log() | E | |||||||
| min | best | max | min | best | max | min | best | max | (mag)b | ||||
| B1-01 | 9.16 | 9.88 | 10.05 | 5.20 | 5.62 | 5.74 | 0.00 | 0.02 | 0.20 | 10.24 | 5.92 | 0.31 | |
| B1-02 | 8.96 | 9.28 | 9.36 | 4.66 | 4.90 | 4.98 | 0.00 | 0.00 | 0.16 | 9.27 | 4.90 | 0.04 | |
| B1-04 | 5.10 | 8.46 | 8.81 | 4.14 | 5.21 | 5.34 | 0.06 | 0.18 | 0.70 | 8.78 | 5.25 | 0.58 | |
| B1-05 | 9.74 | 10.05 | 10.15 | 5.76 | 5.95 | 6.03 | 0.00 | 0.00 | 0.06 | 10.14 | 6.04 | 0.18 | |
| B1-06 | 5.10 | 6.58 | 8.76 | 4.33 | 4.53 | 5.54 | 0.00 | 0.52 | 0.60 | 8.67 | 5.46 | 0.44 | |
| B1-07 | 8.96 | 9.01 | 9.16 | 5.53 | 5.60 | 5.69 | 0.00 | 0.06 | 0.08 | 9.03 | 5.53 | 0.12 | |
| B1-08 | 8.51 | 8.66 | 8.66 | 5.14 | 5.24 | 5.24 | 0.00 | 0.02 | 0.04 | 8.68 | 5.24 | 0.09 | |
| B1-09 | 5.10 | 8.91 | 9.01 | 3.14 | 4.24 | 4.34 | 0.00 | 0.00 | 0.72 | 8.89 | 4.21 | 0.00 | |
| B1-10 | 5.10 | 8.71 | 8.86 | 3.14 | 4.33 | 4.41 | 0.00 | 0.04 | 0.64 | 8.76 | 4.33 | 0.18 | |
| B1-11 | 8.71 | 8.86 | 8.86 | 5.36 | 5.38 | 5.41 | 0.00 | 0.00 | 0.08 | 8.84 | 5.36 | 0.09 | |
| B1-12 | 8.71 | 9.01 | 9.21 | 4.81 | 4.88 | 5.02 | 0.00 | 0.06 | 0.22 | 9.03 | 4.81 | 0.06 | |
| B1-14 | 8.51 | 8.86 | 9.01 | 5.11 | 5.24 | 5.28 | 0.00 | 0.10 | 0.22 | 8.89 | 5.13 | 0.34 | |
| B1-16 | 8.56 | 9.95 | 10.30 | 4.94 | 5.63 | 5.87 | 0.00 | 0.04 | 0.50 | 10.00 | 5.63 | 0.40 | |
| B1-17 | 8.66 | 9.01 | 9.16 | 4.47 | 4.56 | 4.68 | 0.00 | 0.04 | 0.24 | 9.03 | 4.50 | 0.17 | |
| B1-18 | 8.86 | 8.91 | 8.91 | 5.54 | 5.56 | 5.56 | 0.00 | 0.00 | 0.02 | 8.85 | 5.50 | 0.15 | |
| B1-20 | 9.01 | 9.16 | 9.16 | 5.48 | 5.65 | 5.65 | 0.00 | 0.00 | 0.08 | 9.10 | 5.60 | 0.07 | |
| B1-22 | 8.56 | 8.76 | 8.86 | 5.23 | 5.29 | 5.33 | 0.00 | 0.04 | 0.12 | 8.78 | 5.26 | 0.25 | |
| B1-24 | 8.66 | 8.86 | 8.91 | 5.15 | 5.20 | 5.23 | 0.00 | 0.02 | 0.12 | 8.83 | 5.15 | 0.13 | |
| B1-25 | 8.91 | 9.01 | 9.26 | 5.00 | 5.10 | 5.23 | 0.00 | 0.10 | 0.16 | 9.05 | 4.97 | 0.16 | |
| B1-26 | 5.10 | 8.61 | 8.66 | 3.09 | 4.26 | 4.32 | 0.00 | 0.00 | 0.56 | 8.68 | 4.33 | 0.00 | |
| B1-27 | 8.76 | 8.86 | 8.91 | 4.44 | 4.49 | 4.51 | 0.00 | 0.02 | 0.08 | 8.86 | 4.46 | 0.00 | |
| B1-28 | 8.86 | 8.86 | 8.86 | 5.97 | 5.97 | 5.97 | 0.04 | 0.04 | 0.04 | 8.86 | 5.90 | 0.13 | |
| B1-29 | 5.10 | 8.76 | 8.91 | 3.52 | 4.71 | 4.78 | 0.00 | 0.06 | 0.68 | 8.81 | 4.68 | 0.25 | |
| B1-32 | 8.76 | 9.01 | 9.01 | 4.64 | 4.69 | 4.72 | 0.00 | 0.02 | 0.14 | 8.98 | 4.65 | 0.10 | |
| B1-34 | 5.10 | 6.84 | 8.36 | 3.31 | 3.39 | 4.44 | 0.00 | 0.12 | 0.46 | 7.55 | 3.94 | 0.35 | |
| B1-35 | 8.61 | 8.86 | 9.01 | 5.02 | 5.08 | 5.12 | 0.00 | 0.08 | 0.20 | 8.88 | 4.98 | 0.24 | |
| B1-36 | 8.96 | 10.14 | 10.30 | 5.13 | 5.90 | 6.01 | 0.00 | 0.00 | 0.34 | 10.14 | 5.91 | 0.24 | |
| B1-37 | 9.16 | 9.40 | 9.44 | 5.75 | 5.88 | 5.91 | 0.00 | 0.00 | 0.10 | 9.32 | 5.80 | 0.18 | |
| B1-38 | 5.10 | 8.81 | 8.96 | 3.57 | 4.63 | 4.71 | 0.00 | 0.04 | 0.68 | 8.83 | 4.60 | 0.16 | |
| B1-39 | 8.81 | 9.34 | 9.44 | 4.29 | 4.58 | 4.70 | 0.00 | 0.00 | 0.28 | 9.28 | 4.53 | 0.15 | |
| B1-40 | 5.10 | 8.66 | 8.76 | 2.79 | 3.97 | 4.03 | 0.00 | 0.02 | 0.60 | 8.68 | 3.97 | 0.13 | |
| B1-43 | 9.01 | 9.48 | 9.68 | 4.35 | 4.69 | 4.87 | 0.00 | 0.00 | 0.20 | 9.70 | 4.90 | 0.11 | |
| B2-01 | 9.01 | 9.94 | 10.25 | 4.43 | 5.09 | 5.34 | 0.00 | 0.00 | 0.28 | 10.00 | 5.16 | 0.00 | |
| B2-04 | 9.01 | 9.23 | 9.28 | 5.23 | 5.44 | 5.47 | 0.00 | 0.02 | 0.14 | 9.32 | 5.51 | 0.15 | |
| B2-05 | 5.10 | 8.46 | 8.71 | 4.14 | 5.21 | 5.35 | 0.00 | 0.08 | 0.62 | 8.66 | 5.28 | 0.32 | |
| B2-07 | 8.66 | 8.96 | 9.41 | 5.41 | 5.55 | 5.78 | 0.00 | 0.18 | 0.34 | 9.19 | 5.56 | 0.43 | |
| B2-08 | 8.66 | 9.01 | 10.26 | 5.49 | 5.60 | 6.35 | 0.00 | 0.32 | 0.50 | 9.72 | 5.89 | 0.77 | |
| B2-12 | 9.74 | 9.76 | 9.80 | 6.86 | 6.88 | 6.91 | 0.00 | 0.00 | 0.00 | 9.70 | 6.83 | 0.22 | |
| B2-13 | 9.30 | 9.83 | 9.90 | 5.38 | 5.71 | 5.77 | 0.00 | 0.00 | 0.12 | 9.76 | 5.66 | 0.19 | |
| B2-14 | 8.71 | 9.44 | 10.14 | 4.75 | 5.13 | 5.63 | 0.00 | 0.08 | 0.40 | 10.13 | 5.64 | 0.43 | |
| B2-17 | 8.96 | 9.48 | 9.80 | 5.21 | 5.56 | 5.81 | 0.00 | 0.02 | 0.26 | 9.46 | 5.52 | 0.26 | |
| B2-18 | 5.10 | 7.49 | 8.66 | 4.09 | 4.79 | 5.44 | 0.08 | 0.26 | 0.74 | 9.23 | 5.69 | 1.03 | |
| B2-21 | 6.86 | 7.00 | 7.60 | 4.46 | 4.57 | 5.17 | 0.00 | 0.04 | 0.24 | 8.90 | 5.82 | 1.13 | |
| B2-22 | 8.96 | 10.20 | 10.30 | 4.53 | 5.36 | 5.47 | 0.00 | 0.00 | 0.36 | 10.26 | 5.39 | 0.15 | |
| B2-25 | 5.10 | 8.51 | 8.81 | 3.90 | 5.01 | 5.14 | 0.00 | 0.10 | 0.64 | 8.71 | 5.05 | 0.29 | |
| B2-26 | 8.71 | 8.76 | 8.76 | 5.60 | 5.62 | 5.62 | 0.02 | 0.02 | 0.04 | 8.77 | 5.63 | 0.14 | |
| B2-28 | 5.10 | 7.49 | 8.36 | 3.51 | 4.09 | 4.65 | 0.00 | 0.00 | 0.48 | 7.26 | 3.91 | 0.60 | |
| B2-29 | 5.10 | 6.66 | 8.71 | 2.95 | 3.21 | 4.22 | 0.00 | 0.44 | 0.58 | 8.71 | 4.21 | 0.25 | |
| B2-30 | 8.41 | 8.71 | 9.01 | 4.99 | 5.12 | 5.19 | 0.00 | 0.16 | 0.24 | 8.89 | 5.05 | 0.37 | |
| B2-31 | 5.10 | 8.51 | 8.71 | 3.21 | 4.29 | 4.39 | 0.00 | 0.06 | 0.60 | 8.65 | 4.34 | 0.24 | |
| B2-32 | 8.81 | 9.16 | 9.60 | 5.05 | 5.23 | 5.50 | 0.00 | 0.12 | 0.28 | 9.83 | 5.70 | 0.37 | |
| B2-33 | 5.10 | 8.71 | 9.01 | 3.03 | 4.27 | 4.42 | 0.00 | 0.12 | 0.78 | 8.83 | 4.23 | 0.24 | |
| B2-34 | 5.10 | 6.48 | 8.71 | 2.97 | 3.32 | 4.19 | 0.00 | 0.54 | 0.58 | 8.56 | 4.08 | 0.29 | |
| B2-36 | 9.16 | 9.16 | 9.21 | 5.32 | 5.34 | 5.36 | 0.00 | 0.02 | 0.02 | 9.20 | 5.38 | 0.00 | |
| B2-37 | 6.84 | 7.14 | 7.65 | 4.42 | 4.70 | 5.11 | 0.00 | 0.00 | 0.16 | 7.51 | 4.97 | 0.69 | |
| B2-38 | 5.10 | 8.76 | 8.96 | 3.08 | 4.34 | 4.52 | 0.00 | 0.00 | 0.70 | 8.83 | 4.42 | 0.00 | |
| B2-39 | 8.71 | 8.76 | 8.81 | 4.56 | 4.57 | 4.62 | 0.00 | 0.00 | 0.04 | 8.83 | 4.65 | 0.00 | |
| B2-40 | 8.41 | 8.46 | 8.56 | 5.07 | 5.08 | 5.14 | 0.00 | 0.02 | 0.04 | 8.51 | 5.10 | 0.13 | |
| B2-41 | 8.96 | 9.01 | 9.01 | 5.91 | 5.92 | 5.92 | 0.04 | 0.04 | 0.06 | 9.00 | 5.86 | 0.20 | |
| B2-43 | 8.66 | 8.86 | 8.91 | 5.15 | 5.20 | 5.23 | 0.00 | 0.02 | 0.12 | 8.81 | 4.54 | 0.00 | |
| B2-44 | 5.10 | 8.66 | 8.76 | 3.57 | 4.61 | 4.64 | 0.00 | 0.04 | 0.60 | 8.70 | 4.61 | 0.12 | |
| B2-45 | 8.71 | 9.01 | 9.70 | 5.00 | 5.09 | 5.51 | 0.00 | 0.20 | 0.36 | 9.93 | 5.70 | 0.37 | |
| B2-47 | 9.01 | 9.26 | 9.32 | 4.12 | 4.36 | 4.42 | 0.00 | 0.00 | 0.12 | 9.28 | 4.39 | 0.00 | |
| B2-48 | 5.10 | 8.61 | 8.81 | 3.32 | 4.52 | 4.61 | 0.00 | 0.06 | 0.64 | 8.68 | 4.50 | 0.24 | |
| B2-50 | 5.10 | 7.68 | 8.51 | 3.54 | 4.24 | 4.69 | 0.00 | 0.06 | 0.52 | 8.31 | 4.57 | 0.48 | |
| B2-51 | 8.96 | 10.14 | 10.30 | 5.13 | 5.90 | 6.01 | 0.00 | 0.00 | 0.34 | 8.63 | 3.90 | 0.00 | |
| B2-52 | 8.96 | 9.01 | 9.01 | 4.66 | 4.67 | 4.71 | 0.00 | 0.00 | 0.06 | 9.01 | 4.67 | 0.00 | |
| B2-54 | 5.10 | 8.66 | 8.71 | 3.39 | 4.44 | 4.47 | 0.00 | 0.02 | 0.58 | 8.68 | 4.44 | 0.00 | |
| B2-55 | 8.56 | 8.71 | 8.76 | 3.87 | 3.94 | 3.98 | 0.00 | 0.00 | 0.04 | 8.78 | 4.03 | 0.00 | |
| B2-56 | 8.86 | 9.26 | 9.36 | 4.76 | 5.00 | 5.10 | 0.00 | 0.00 | 0.22 | 9.23 | 4.98 | 0.00 | |
| B2-57 | 8.86 | 9.23 | 9.41 | 5.21 | 5.42 | 5.55 | 0.00 | 0.04 | 0.22 | 9.26 | 5.40 | 0.26 | |
| B2-59 | 5.10 | 8.21 | 8.96 | 3.69 | 4.73 | 5.00 | 0.00 | 0.24 | 0.72 | 8.75 | 4.82 | 0.65 | |
| B2-60 | 5.10 | 8.76 | 8.86 | 3.46 | 4.48 | 4.54 | 0.00 | 0.02 | 0.64 | 8.78 | 4.49 | 0.18 | |
| B2-62 | 8.76 | 8.96 | 9.01 | 4.05 | 4.12 | 4.14 | 0.00 | 0.02 | 0.12 | 8.95 | 4.09 | 0.00 | |
| B2-64 | 8.96 | 9.23 | 9.30 | 4.25 | 4.48 | 4.55 | 0.00 | 0.00 | 0.14 | 9.26 | 4.52 | 0.00 | |
| B2-65 | 8.91 | 9.11 | 9.16 | 5.02 | 5.12 | 5.20 | 0.00 | 0.00 | 0.12 | 9.03 | 5.01 | 0.20 | |
| B2-67 | 8.81 | 8.91 | 8.96 | 5.22 | 5.25 | 5.27 | 0.06 | 0.08 | 0.12 | 8.90 | 5.11 | 0.35 | |
| B2-68 | 8.86 | 9.16 | 9.30 | 4.51 | 4.69 | 4.77 | 0.00 | 0.04 | 0.18 | 9.20 | 4.70 | 0.07 | |
| B2-69 | 8.86 | 8.96 | 8.96 | 4.09 | 4.14 | 4.16 | 0.00 | 0.00 | 0.04 | 8.85 | 4.04 | 0.00 | |
| B2-70 | 8.76 | 8.81 | 8.81 | 4.97 | 4.99 | 4.99 | 0.02 | 0.02 | 0.04 | 8.81 | 4.97 | 0.03 | |
Notes: a based on a Salpeter-type IMF; comparison with results from more modern IMFs (e.g., KTG) implies that we have overestimated our individual cluster masses by a factor of about 1.7–3.5, depending on the adopted IMF slope for the lowest stellar masses (see Sect. 3); b E.
Our analysis in both dGOG and the present paper is based on the assumption of solar metallicity, which should be a reasonable match to the young objects in M82 (Gallagher & Smith 1999; see also Fritze-v. Alvensleben & Gerhard 1994), but the effects of varying the metallicity between one-fifth and 2.5 times solar are small compared to the photometric uncertainties (see also dGOG). We therefore assert that our results are not significantly affected by possibly varying metallicities. Ongoing analysis (Parmentier, de Grijs & Gilmore, 2002) suggests that this assumption was indeed justified. We should caution, however, that we have only been able to sample the star clusters located close to the surface of region B, as evidenced by the derived extinction estimates: dGOG find mag in general, while our new determinations (this paper) restrict the extinction even more, to mag for the clusters with well-determined ages, and possibly up to for some of the others.
In Fig. 2 we compare the age and mass estimates from the more sophisticated 3/2DEF method used in this paper with the corresponding parameters obtained by dGOG based on their location in the vs. diagrams. The black dots represent clusters for which the range between the minimum and maximum plausible ages, ; the open circles are objects with more uncertain age determinations. We conclude that the new age and mass determinations are consistent with the dGOG values; this consistency is better for the photometric cluster mass estimates than for their ages, as shown by the larger scatter in Fig. 2a with respect to panel b. However, we also note that the age and mass distributions obtained for the subsample with well-determined ages and for the full sample are internally consistent.

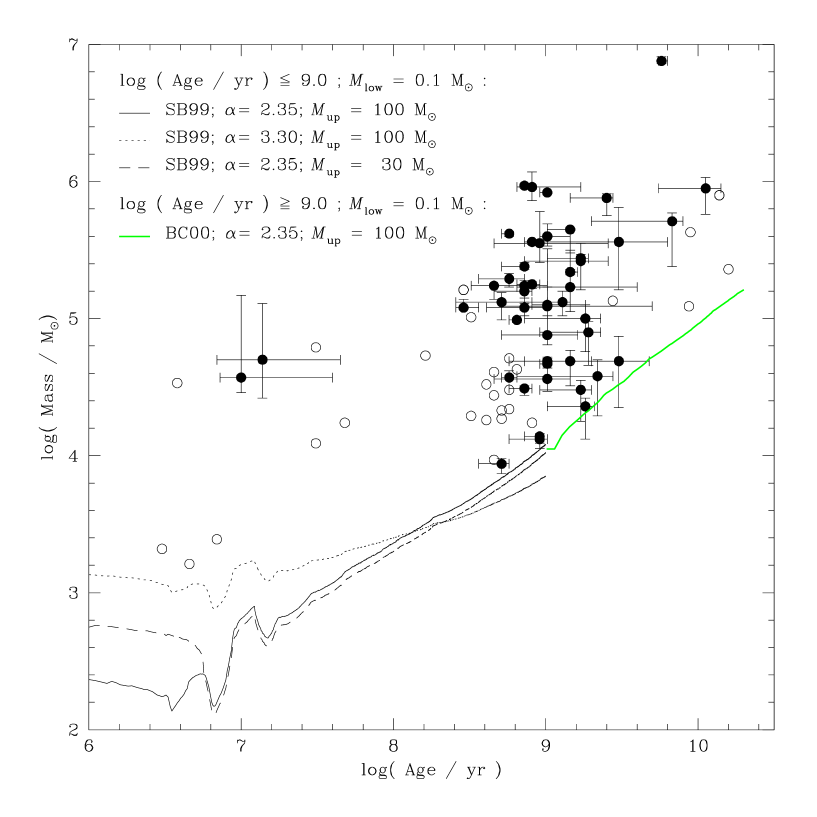
Fig. 3 shows the distribution of the M82 B clusters in the age vs. mass plane. It is immediately clear that the lower mass limit increases with increasing cluster age. The various (solid, dashed and dotted) lines overplotted on the figure show that this is indeed the expected effect of normal evolutionary fading of a synthetic single stellar population of an instantaneously formed cluster. For ages yr, we show the unreddened fading line for clusters with a limiting magnitude of at the distance of M82 (; see dGOG), and various choices for the IMF (indicated in the figure are the IMF slope , and the lower and upper mass cut-offs), predicted by the Starburst99 models (“SB99”). For older ages ( yr), we show its extension predicted by the BC00 models. These predicted lower limits agree well with our data points.
4 The derived cluster formation history
4.1 Cluster age and mass distributions
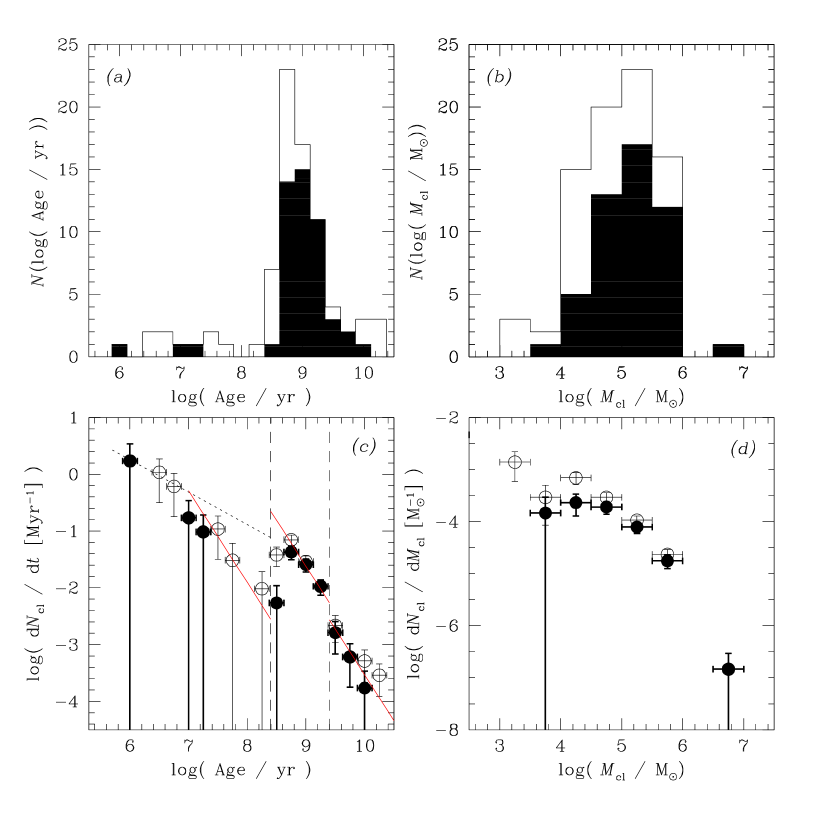
The cluster age and mass distributions for the M82 B cluster sample are shown in Figs. 4a and b. Our new age estimates confirm the peak in the age histogram attributed to the last tidal encounter with M81 by dGOG. For the subsample of clusters with well-determined ages (shaded histogram), we find a peak formation epoch at Gyr), with a Gaussian of , corresponding to a FWHM of . The corresponding numbers for the full sample are Gyr) for the peak of cluster formation, and for , (FWHM, ). In dGOG (see also de Grijs 2001), we concluded that there is a strong peak of cluster formation at Myr ago, which have formed over a period of Myr, but very few clusters are younger than ( Myr). Our new age estimates date the event triggering the starburst to be slightly older than the value of 650 Myr derived by dGOG. Our estimate of the duration of the burst should be considered an upper limit, because uncertainties in the cluster age determination may have broadened the peak in Fig. 4a.
At the distance from the centre of region B, one would expect M82’s differential rotation (cf. Shen & Lo 1995) to have caused the starburst area to disperse on these time-scales. The reason why the fossil starburst region has remained relatively well constrained is likely found in the complex structure of the disc. It is well-known that the inner kpc of M82 is dominated by a stellar bar (e.g., Wills et al. 2000) in solid-body rotation. From observations in other galaxies, it appears to be a common feature that central bars are often surrounded by a ring-like structure. If this is also true for M82, it is reasonable to assume that stars in the ring are trapped, and therefore cannot move very much in radius because of dynamical resonance effects. The phase mixing around the ring might be slow enough for a specific part of the ring to keep its identity over a sufficient time so as to appear like region B (see de Grijs 2001): if the diffusion velocity around the ring is sufficiently small, any specific region would remain self-constrained for several rotation periods. In addition, since the density in the region is high (see Sect. 6.1), simple calculations imply that the area’s self-gravity is non-negligible compared to the rotational shear, therefore also prohibiting a rapid dispersion of the fossil starburst region.
The improved mass estimates also confirm that the (initial) masses of the young clusters in M82 B with mag are mostly in the range , with a median of (dGOG). In fact, based on a Gaussian fit, we find that the mean mass of our M82 B cluster sample is and 4.88 for the subsample with well-determined ages and the full sample, respectively, corresponding to and , respectively.
4.2 Cluster disruption and the cluster formation history
In Figs. 4c and d we show the formation rate and the mass spectrum of the observed clusters in M82 B. The open circles were derived for the entire sample, whereas the filled data points represent only those clusters for which we could obtain good age estimates. These distributions depend on the cluster formation history and on the cluster disruption time-scale of M82 B.
As shown by Boutloukos & Lamers (2002, hereafter Paper I), with only a few well-justified assumptions, the mass and age distributions of a magnitude-limited sample of star clusters in a given galaxy can be predicted both accurately and robustly, despite the complex physical processes underlying the assumptions (for a full discussion see Paper I). If all of the following conditions are met:
-
1.
the cluster formation rate, , is constant;
-
2.
the slope of the cluster IMF is constant with ;
-
3.
stellar evolution causes clusters to fade as , as predicted by cluster evolution models; and
-
4.
the cluster disruption time depends on their initial mass as , where is the disruption time-scale of a cluster with . It is well-established, however, that the disruption time-scale does not only depend on mass, but also on the initial cluster density and internal velocity dispersion (e.g., Spitzer 1957, Chernoff & Weinberg 1990, de la Fuente Marcos 1997, Portegies Zwart et al. 2001). Following the approach adopted in Paper I, however, we point out that if clusters are approximately in pressure equilibrium with their environment, we can expect the density of all clusters in a limited volume of a galaxy to be roughly similar, so that their disruption time-scale will predominantly depend on their (initial) mass (with the exception of clusters on highly-eccentric orbits). In the opposite case that the initial cluster density depends on their mass in a power-law fashion, e.g., with being the (arbitrary) power-law exponent, the disruption time-scale will also depend on mass if (Paper I).
then it can be shown easily that the age distribution of the observed cluster population will obey the following approximate power-law behaviours (see Paper I):
-
•
for young clusters due to fading;
-
•
for old clusters due to disruption.
Similarly the mass spectrum of the observed clusters will be
-
•
for low-mass clusters due to fading;
-
•
for high-mass clusters due to disruption.
So both distributions will show a double power law with slopes determined by , and . The crossing points are determined by the cluster formation rate and the characteristic disruption time-scale of a cluster with an initial mass of , .
In Paper I we showed that the observed age and mass distributions of the star cluster systems in four well-studied galaxies indeed show the predicted double power-law behaviour. From the analysis of these observed distributions Boutloukos & Lamers (2002) showed that the value of is approximately constant, , under the very different environmental conditions in the four galaxies, but the characteristic disruption time-scales differ significantly from galaxy to galaxy.
For the clusters in M82 B the situation is more complex, because the cluster formation rate was certainly not constant. In fact the distribution in Fig. 4c suggests that we can distinguish three phases, which we will discuss separately.
We will assume that the cluster formation rate has been constant within each phase, but may differ strongly among the phases. We adopt a cluster IMF of slope (Harris & Pudritz 1994; McLaughlin & Pudritz 1996; Elmegreen & Efremov 1997; Zhang & Fall 1999; Bik et al. 2002). We will also adopt a slope for the evolutionary fading of clusters in the V band, derived from the Starburst99 cluster models (see also Paper I). For the mass scaling of the disruption time-scale we adopt (Paper I).
-
1.
The pre-burst phase, at . The age distribution of this earliest phase is represented by only three age-bins of high age at . The predicted slope is . We have fitted a straight line through the last three age-bins with this slope. We see that the predicted slope matches the observations within the uncertainties.
-
2.
The burst phase, in the approximate time interval . Its distribution can be fitted with a line of the same predicted slope of . This is also shown in Fig. 4c. The predicted slope fits the observations very well. We see that this disruption line of the burst-phase is higher than in the pre-burst phase by () dex. This implies that the cluster formation rate during the burst was approximately a factor of 2 higher than before. However, this factor depends on the assumed duration of the burst. The duration of the burst may have been shorter than the value of suggested by the figure, because uncertainties in the derived cluster ages may have broadened the burst peak. If the duration of the burst was a factor shorter than we adopted, then the overall cluster formation rate during the burst was a factor higher than we estimated.
-
3.
The post-burst phase, at . The age distribution of this most recent, post-burst phase extends from . Unless the disruption time was extremely short with of order a few Myr (which is contradicted by the analysis of the mass distribution in the burst, see Sect. 5), the age distribution of the youngest bins is governed by the fading of the clusters and the detection limit. Despite the rather large uncertainties for young ages, , we find a best-fitting slope , so that (formal uncertainty, not including the large error bars) for a mass-function slope (dotted line in Fig. 4c). This is, within the rather large uncertainties, similar to the value of expected from the Starburst99 and BC00 models. Therefore we have assumed a fading line with the predicted slope for the youngest three age bins. The age bins in the range of fall below the extrapolated fading line. The difference is about one dex at , although the number of observed clusters is small. This suggest that the number of clusters for ages yr is already affected by disruption. We can fit a disruption line with the predicted slope of through the data points, despite their rather large uncertainties. We see that the best-fitting line is displaced by () dex compared to the pre-burst disruption line. This shows that the cluster formation rate in the post-burst phase was approximately a factor of 40 smaller than during the pre-burst phase.
We conclude from this analysis that the cluster formation rate during the burst was at least a factor of 2 higher than during the pre-burst phase (depending on the duration of the burst), and that the cluster formation rate was a factor of smaller after the burst than before the burst. This is not surprising because the intense episode of cluster formation during the burst will have consumed a large fraction of the available number of molecular clouds, leaving little material for cluster formation at later times. In fact, it is likely that starbursts are strongly self-limited, or quenched, by supernova-driven outflows, which remove the remaining cool gas from the immediate starburst region (e.g., Chevalier & Clegg 1985, Doane & Mathews 1993). The remarkable minor-axis wind in M82 is a dramatic example of this process. However, the disturbed conditions near an early burst may discourage re-ignition at the same site when cool gas inflows resume, shifting the location of active star formation (e.g., dGOG).
5 The mass distribution of clusters formed in the burst.
In this section we analyse the mass distribution of the clusters that were formed during the burst of cluster formation, roughly defined to have occurred in the age range (see the vertical dashed lines in Fig. 4c). In Fig. 5 we show their mass distribution. Although the M82 B cluster system does not contain large numbers of very massive clusters, its mass distributions shows a clear increase in cluster numbers from the high-mass end towards lower masses, for . For lower masses, however, the number of clusters decreases rapidly. If the mass spectrum of young, newly formed clusters resembles a power-law distribution, this turn-over at is not expected, unless disruption effects have preferentially removed the lower-mass clusters from our magnitude-limited sample.
In dGOG we concluded that the distribution of cluster luminosities (and therefore the equivalent mass distribution) in M82 B – corrected to a common age of 50 Myr – shows a broader and flatter mass distribution than typical for young cluster systems, although this distribution is subject to strong selection effects. For the small age range considered here, the selection limit in observable mass at imposed by the brightness limit at mag (Fig. 3) occurs at almost an order of magnitude lower masses than the turn-over mass in Fig. 5, at . The arrow in Fig. 5 indicates the mass where the onset of significant selection effects, and therefore of sample incompleteness, is expected to occur, based on the selection limit in the (age vs. mass) plane shown in Fig. 3. The expected effect of the mag extinction for the clusters with well-determined ages is a marginal shift in mass towards higher masses of . This implies that the observed turnover is not a spurious effect due to varying extinction. In addition, we do not observe a systematic trend between cluster mass and extinction, derived from the SED fitting, which would be expected if the higher-mass clusters (and therefore brighter at the same age) were located slightly deeper into M82 B, while the fainter lower-mass clusters were only observed near the very surface of the region.
Therefore, we conclude that if the initial mass spectrum of the M82 B clusters formed in the burst of cluster formation resembled a power-law distribution down to the low-mass selection limits, cluster disruption must have transformed this distribution on a time-scale of yrs into a distribution resembling a log-normal or Gaussian distribution.

We now compare the observed mass distribution of the clusters formed in the burst with model predictions. These predictions are based on the assumption that the clusters were formed with a cluster IMF of slope , and that the distribution has been modified subsequently by cluster disruption. For the cluster disruption we adopt the same relation with (Eq. (1)), as found in Paper I for four galaxies, and used in the previous section. We can then model the mass distribution of the observed burst clusters with only one free parameter, i.e. the disruption time of a cluster with an initial mass of .
The decreasing mass of a cluster with time is given by111Recent simulations, based on both Monte Carlo realisations (e.g., Giersz 2001, his Fig. 2) and N-body modeling (e.g., Portegies Zwart et al. 2002, their Fig. 2; S.J. Aarseth, priv. comm.), show that this is a close approximation to real cluster evolution, provided that the initial cluster has reached an equilibrium state.
| (2) |
so that
| (3) |
where and are, respectively, the present and the initial mass of the cluster, both in units of , and .
Suppose that clusters form in a burst as
| (4) |
over the mass range , and governed by a formation rate in units of yr-1. We assume an instantaneous burst of cluster formation, so that is a function at age yr. We adopt (i.e., , one mass bin beyond the maximum mass of clusters formed in the burst, thus allowing for some disruption effects) and , but this lower limit is not important since it is below the detection limit of for the burst clusters (see Fig. 2). The function is related to the total number of clusters formed per unit time as
| (5) |
where d is the total number of clusters formed per year. It is easy to show that the present mass distribution of clusters formed in an instantaneous burst of age can be written as
| (6) | |||||
for masses above the detection limit and smaller than . We see that the initial mass distribution, d, has been modified by a factor that depends on the ratio , for given values of and .
We have calculated the predicted mass distribution, using Eq. (6), for a burst age of 1 Gyr and for several values of the cluster disruption time-scale , see Fig. 6. To match the observed peak in the cluster mass distribution, a characteristic disruption time-scale between 7.5 and 8.0 is required, with the most likely value closer to .

We then calculated the expected number of clusters in the same age bins as observed (Fig. 5) and normalised the distribution to the observed total number of clusters. The results are shown in Fig. 7a for the subsample of the 42 clusters with the most accurately determined ages, and in panel b for the full sample of 58 clusters. The location of the predicted peak is very sensitive to the value of , which follows from Eq. (6), and is shown in Fig. 6. We found the best fit for a cluster disruption time of , with an uncertainty of approximately a factor of two. This corresponds to yr if Gyr. We conclude that the mass distribution of the clusters formed during the burst can be explained by an initial cluster IMF with a slope of , an upper limit to their mass of and cluster disruption with a time-scale given by Eq. (1), yr if the age of the burst is yr. The uncertainties in both the observed and predicted numbers of clusters of a given mass are governed by identical Poisson-type statistical errors. The uncertainties in the mass and age scales, on the other hand, are dominated by systematic uncertainties introduced by the adopted stellar evolutionary synthesis models, and – to some extent – by the specific extinction law adopted, although the relative mass and age distributions are robust.


6 Discussion
6.1 The cluster disruption time-scale
We have derived the characteristic cluster disruption time-scale from the mass distribution of the clusters formed during the burst. In principle this disruption time-scale could also be derived from the the age distributions of the clusters formed during the post-burst phase, shown in Fig. 4c. However the number of observed young clusters is very small, only a few per age bin so that the crossing point between the (dotted) fading line and the (solid) disruption line is very uncertain. However, the crossing point suggested in Fig. 4c agrees approximately with that expected for the disruption time-scale of yr derived from the clusters formed during the burst (see the description of the method in Paper I).
In Paper I we have shown that the disruption time-scale can also be derived from the mass distribution of clusters in a magnitude limited sample if the cluster formation rate is constant. This last assumption is certainly not justified for M82 B. For a strongly variable cluster formation rate, as in M82 B, the mass distribution is heavily affected such that the crossing point between the power-law fit to the distribution of low mass clusters (the fading line) and the power-law fit to the distribution of the massive clusters (the disruption line) does no longer represent the value of . Therefore, we could only use the mass distribution of the clusters formed during the burst to derived the disruption time-scale.
An initial comparison among the characteristic cluster disruption time-scales found in Paper I reveals large differences. However, the characteristic cluster disruption time-scale for the clusters in region B of its low-mass host galaxy M82 is, within the uncertainties, comparable to that in the dense centre of the massive grand-design spiral M51. Lamers & Portegies Zwart (in prep.) are currently analysing the cluster disruption time-scales derived for the galaxies studied in Paper I and in this paper, using N-body simulations. Here, we will therefore simply explore whether this similarity between in the centre of M51 and in M82 B can be understood from a comparison of the ambient density in both regions.
In order to estimate the density in M82 B, we determined its total V-band luminosity, after correcting for a nominal extinction throughout the region of mag, from our HST observations (dGOG), so that , . Spectral synthesis of region B suggests that it has a V-band mass-to-light ratio, (R.W. O’Connell, priv. comm.), as expected from the Starburst99 models for a stellar population of several 100 Myr, so that the total mass contained in the objects providing most of the V-band luminosity is . If we now assume that the volume occupied by these objects is roughly similar to a sphere with a radius determined by the radius of the area in which we measured the total flux, we derive an average density for M82 B of , or . Note, however, that we have introduced large uncertainties by adopting the above assumptions, in particular because we have assumed to have sampled the entire volume of the “spherical region” M82 B. This implies that the region has been assumed transparent, as opposed to the conclusion in dGOG that the M82 B cluster sample contains likely only the subset of M82 B clusters on the surface of the “sphere”. The implications of our assumptions are therefore that we expect to have missed a large number of clusters present in the interior of M82 B. For these missed clusters in the interior we expect the disruption time to be shorter because of the higher densities predicted there.
For the interstellar medium in the centre of M51, Lamers & Portegies Zwart (in prep.) derive a mean density of , based on column density estimates by Athanassoula et al. (1987) and similar geometrical arguments as used above for M82 B. Within the large uncertainties involved in such back-of-the-envelope approximations, these two estimates of the mean density in the centre of M51 and in M82 B are remarkably similar, within an order of magnitude, as are their characteristic cluster disruption time-scales. Thus, we conclude that, although M82 as such is a small, low-mass irregular galaxy, its fossil starburst region B has achieved a similarly dense interstellar medium as the centre of M51, so that similar cluster disruption time-scales are not a priori ruled out.
6.2 The cluster formation rate
We have derived the cluster formation history of M82 B from the age distribution shown in Fig. 4c. The age distribution itself, Fig. 4a already shows a very strong peak around years. Part of the steep increase between is owing to the use of logarithmic age bins. Therefore we have transformed the age distribution into the formation history of the observed clusters, Fig 4c. The general decrease with age clearly shows the effect of cluster disruption. Disruption of clusters formed at a constant formation rate and with a mass-dependent disruption time-scale will result in a power-law decrease of the observed cluster formation rate (Paper I), roughly in agreement with the observations. The deviations from the power law, e.g., the peak in the observed formation history around 1 Gyr, reflect changes in the real formation history, or in the disruption time.
For magnitude-limited cluster samples with a constant cluster formation rate and a constant mass-dependent disruption time-scale, the disruption time and its dependence on mass can be derived from the age distribution. Because of the non-constant cluster formation rate and the small number of clusters, such an analysis is not possible here. Therefore we opted for the reasonable alternative of adopting the mass dependence of the disruption time-scale, i.e., the value of in Eq. (1), which seems to be a universal value found in four galaxies with very different conditions (Paper I). We also assumed that the scaling factor of the disruption time-scale is constant. With these two assumptions, we derived the ratios between the real cluster formation rates in the pre-burst phase (), the burst-phase () and the post-burst phase ( of, roughly, . The formation rate during the burst may have been higher if the actual duration of the burst was shorter than adopted.
Alternatively, we could have adopted a constant cluster formation rate, but wildly variable cluster disruption time-scales. In that case the cluster disruption time-scale should have been much longer (i.e. much slower disruption) during the burst than before the burst, and again much shorter (faster disruption) after the burst. We think that this alternative is very unlikely because (a) disruption is a slow process that occurs over an extended period of time, so large changes are not to be expected, (b) there is no obvious physical process that would produce such large changes and (c) the alternative of a variable cluster formation rate is much more likely, because this effect is observed in several interacting galaxies and in M82 regions A, C and E (dGOG). Therefore, we are confident that the changes in the apparent formation rates of the observed clusters are due to changes in the real cluster formation rate.
7 Summary and Conclusions
In this paper, we have reanalysed the previously published optical and near-infrared HST photometry of the star clusters in M82’s fossil starburst region B (dGOG) to obtain improved individual age and mass estimates. We have also extended this study to obtain estimates for the cluster formation history and include the importance of cluster disruption. Our main results and conclusions can be summarised as follows:
-
1.
Our new age estimates, based on improved fitting methods, confirm the peak in the age histogram attributed to the last tidal encounter with M81 by dGOG. For the subsample of clusters with well-determined ages we find a peak formation epoch at Gyr), with a Gaussian of , corresponding to a FWHM of . The corresponding numbers for the full sample are Gyr) for the peak of cluster formation, and for , (FWHM, ). In dGOG (see also de Grijs 2001), we concluded that there is a strong peak of cluster formation at Myr ago, which have formed over a period of Myr, but very few clusters are younger than 300 Myr (). Our new age estimates date the event triggering the starburst to be slightly older. Our estimate of the duration of the peak is an upper limit because the observed width of the peak in the age histogram may have been broadened by uncertainties in the derived cluster ages.
-
2.
The improved mass estimates confirm that the (initial) masses of the young clusters in M82 B with mag are mostly in the range , with a median of (dGOG). We find that the mean mass of our M82 B cluster sample is and 4.88 for the subsample with well-determined ages and the full sample, respectively, corresponding to and , respectively. If the initial mass spectrum of the clusters formed at the burst epoch was a power law, disruption effects have transformed it into a broader and flatter distribution on time-scales of Gyr.
-
3.
The (apparent) formation history of the observed clusters shows a gradual increase to younger ages, reaching a maximum at the present time. This shows that cluster disruption must have removed a large fraction of the older clusters. Adopting the expression for the cluster disruption time, with , that was derived for four galaxies characterized by very different conditions (Paper I), we found that ratios between the real cluster formation rates in the pre-burst phase (), the burst-phase () and the post-burst phase () are roughly . The formation rate during the burst may have been higher if the actual duration of the burst was shorter than adopted. We see that the cluster formation rate in the post-burst phase is much smaller than in the pre-burst phase, because the burst has consumed a large fraction of the available molecular clouds, leaving little material for the cluster formation in the post-burst phase.
-
4.
The mass distribution of the clusters formed during the burst shows a turnover at . This turnover is not due to selection effects, because the magnitude limit of our sample would produce a turnover near . The observed distribution can be explained by cluster formation with an initial power-law mass function of exponent up to a maximum cluster mass of , and cluster disruption given by Eq. (1) with the adopted value of with only one free fitting parameter: . For a burst age of yr, we find that years, with an uncertainty of a factor of two.
-
5.
The time-scale of Myr is much shorter than derived in Paper I for any of the SMC ( Gyr), the solar neighbourhood ( Gyr), M33 ( Gyr) and even shorter than in the inner spiral arms of M51 ( Myr). The characteristic disruption time-scale in M82 B is the shortest known in any disc (region of a) galaxy.
Acknowledgments
RdeG wishes to thank the Astronomical Institute of Utrecht University for their hospitality and partial support on a visit when this work was started. We acknowledge interesting and useful discussions with Bob O’Connell and Sverre Aarseth and helpful suggestions by the anonymous referee. This research has made use of NASA’s Astrophysics Data System Abstract Service.
References
- [] Athanassoula E., Bosma A., Papaioannou 1987, A&A, 179, 23
- [] Barger A.J., Aragón-Salamanca A., Ellis R.S., Couch W.J., Smail I., Sharples R.M., 1996, MNRAS, 279, 1
- [] Bik A., Lamers H.J.G.L.M., Bastian N., Panagia N., Romaniello M., Kirshner R., 2002, A&A, in press (astro-ph/0210594)
- [] Boutloukos S.G., Lamers H.J.G.L.M., 2001, in: Extragalactic Star Clusters, eds. Grebel E.K., Geisler D., IAU Symp. 207, (San Francisco: ASP), in press
- [] Boutloukos S.G., Lamers H.J.G.L.M., 2002, MNRAS, in press (astro-ph/0210595; Paper I)
- [] Brandl B., Chernoff D.F., Moffat A.F.J., 2001, in: Extragalactic Star Clusters, eds. Grebel E.K., Geisler D., IAU Symp. 207, (San Francisco: ASP), in press
- [] Bruzual G., Charlot S., 2000, updated version of Bruzual G., Charlot S., 1996, in: Leitherer, C., et al. 1996, PASP, 108, 996 (AAS CDROM Series 7) (BC00)
- [] Butcher H., Oemler A., 1978, ApJ, 219, 18
- [] Chernoff D.F., Weinberg M.D., 1990, ApJ, 351, 121
- [] Chevalier R.A., Clegg A.W., 1985, Nat., 317, 44
- [] Couch W.J., Barger A.J., Smail I., Ellis R.S., Sharples R.M., 1998, ApJ, 497, 188
- [] Couch W.J., Sharples R.M., 1987, MNRAS, 229, 423
- [] de Grijs R., 2001, A&G, 42, 14
- [] de Grijs R., Johnson R.A., Gilmore G.F., Frayn C.M., 2002a, MNRAS, 331, 228
- [] de Grijs R., Gilmore G.F., Johnson R.A., Mackey A.D., 2002b, MNRAS, 331, 245
- [] de Grijs R., O’Connell R.W., Gallagher J.S., 2001, AJ, 121, 768 (dGOG)
- [] de la Fuente Marcos R., 1997, A&A, 322, 764
- [] Doane J.S., Mathews W.G., 1993, ApJ, 419, 573
- [] Dressler A., Gunn J.E., 1990, in: Evolution of the Universe of Galaxies, ed. Kron R.G., (San Francisco: ASP), p. 200
- [] Elmegreen B.G., Efremov Y.N., 1997, ApJ, 480, 235
- [] Elson R.A.W., 1991, ApJS, 76, 185
- [] Elson R.A.W., 1992, MNRAS, 256, 515
- [] Elson R.A.W., Freeman K.C., Lauer T.R., 1989, ApJ, 347, 69
- [] Fritze-v. Alvensleben U., Gerhard O.E., 1994, A&A, 285, 775
- [] Gallagher J.S., Smith L.J., 1999, MNRAS, 304, 540
- [] Giavalisco M., 1997, in: The Hubble Deep Field, eds. Livio M., Fall S.M., Madau P., (Cambridge: CUP), p. 121
- [] Giersz M., 2001, MNRAS, 324, 218
- [] Girardi L., Chiosi C., Bertelli G., Bressan A., 1995, A&A, 298, 87
- [] Harris W.E., Pudritz R.E., 1994, ApJ, 429, 177
- [] Ho L.C., Filippenko A.V., 1996a, ApJ, 466, L83
- [] Ho L.C., Filippenko A.V., 1996b, ApJ, 472, 600
- [] Kroupa P., Tout C.A., Gilmore G.F., 1993, MNRAS, 262, 545
- [] Leitherer C., Schaerer D., Goldader J.D., Gonzalez Delgado R.M., Robert C., Kune D.F., de Mello D.F., Devost D., Heckman T.M., 1999, ApJS, 123, 3 (Starburst99)
- [] Lowenthal J.D., et al., 1997, ApJ, 481, 673
- [] Lynds C.R., Sandage A.R., 1963, ApJ, 137, 1005
- [] Marcum P., O’Connell R.W., 1996, in: From Stars to Galaxies: The Impact of Stellar Physics on Galaxy Evolution, eds. Leitherer C., Fritze-von Alvensleben U., Huchra J., (San Francisco: ASP), p. 419
- [] McCarthy P.J., Heckman T., van Breugel W., 1987, AJ, 92, 264
- [] McLaughlin D.E., Pudritz R.E., 1996, ApJ, 457, 578
- [] Mengel S., Lehnert M.D., Thatte N., Genzel R., 2002, A&A, 383, 137
- [] O’Connell R.W., Gallagher J.S., Hunter D.A., Colley W.N., 1995, ApJ, 446, L1
- [] O’Connell R.W., Mangano J.J., 1978, ApJ, 221, 62
- [] Oemler A., 1992, in: Clusters & Superclusters of Galaxies, ed. Fabian A.C. (Dordrecht: Kluwer), p. 29
- [] Oort J.H., 1957, “Stellar Populations”, Rome: Pontifical Academy of Science, discussion in session on star clusters
- [] Parmentier G., de Grijs R., Gilmore G.F., 2002, MNRAS, submitted
- [] Portegies Zwart S.F., Makino J., McMillan S.L.W., Hut P., 2001, ApJ, 546, L101
- [] Portegies Zwart S.F., Makino J., McMillan S.L.W., Hut P., 2002, ApJ, 565, 265
- [] Rieke G.H., Loken K., Rieke M.J., Tamblyn P., 1993, ApJ, 412, 99
- [] Scuderi S., Panagia N., Gilmozzi R., Challis P.M., Kirshner R.P., 1996, ApJ, 465, 956
- [] Shen J., Lo K.Y., 1995, ApJ, 445, L99
- [] Shopbell P.L., Bland-Hawthorn J., 1998, ApJ, 493, 129
- [] Smith L.J., Gallagher J.S., 2001, MNRAS, 326, 1027
- [] Spitzer L. Jr., 1957, ApJ, 127, 17
- [] Steidel C.C., Giavalisco M., Pettini M., Dickinson M., Adelberger K.L., 1996, ApJ, 462, L17
- [] Telesco C.M., 1988, ARA&A, 26, 343
- [] Vesperini E., 2000, MNRAS, 318, 841
- [] Vesperini E., 2001, MNRAS, 322, 247
- [] Wills K.A., Das M., Pedlar A., Muxlow T.B.W., Robinson T.G., 2000, MNRAS, 316, 33
- [] Zhang Q., Fall S.M., 1999, ApJ, 527, L81