The Optical Afterglows of Gamma-Ray Bursts
Stephen T. Holland
Department of Physics
University of Notre Dame
Notre Dame, IN 46556–5670, U.S.A.
1 Introduction
The first gamma-ray burst (GRB) for which an optical afterglow was observed was GRB 970228 [1, 2], and the first redshift for a GRB came from the optical afterglow of GRB 970508 [3, 4]. The inferred redshift for GRB 970508 was , which demonstrated that GRBs have cosmological origins and required that the bursts have isotropic equivalent energies of – erg, which was difficult to explain. Over the next five years intensive efforts were made to observe the optical afterglows of GRBs. The ROTSE telescope saw prompt optical emission from GRB 990123 just 22 seconds after the burst [5, 6], and [7] identified a possible star-forming region at the location of this burst. The purpose of this article is to provide a brief overview of optical observations of GRBs and what they can tell us about the physics, geometry, and environments of the bursts.
2 The Relativistic Fireball Model
Over the past few years a consensus has developed that the optical afterglow of a GRB is caused by an expanding relativistic fireball that is independent of the details of the central engine. In this picture the optical emission is produced when the expanding fireball collides with material surrounding the progenitor to produce an external shock. Electrons in the shocked material are accelerated and acquire a power law distribution of energies, , for electrons with greater than some minimum value. The electrons then emit synchrotron radiation which we observe as the afterglow. A detailed review of the expanding fireball model and the production of optical afterglows is given by [8].
The optical flux from the afterglow, , is related to the frequency, and time since the burst, , by . The indices and are in turn related to the electron index, , in ways that depend on the values of the cooling, synchrotron, and self-absorption frequencies (, , and ). If both and can be determined observationally then this information can be used to determine the relative ordering of these three characteristic frequencies. Once this is known the electron index and other physical parameters of the fireball can be determined.
3 The Spectral Energy Distribution
The key to interpreting the spectrum is the fact that a synchrotron spectrum is made up of power laws, except near the spectral breaks. Observed spectra however, often show curvature due to extinction along the line of sight to the burst. This curvature can be used to estimate the amount of extinction in the host galaxy by assuming that the observed spectrum is the result of an intrinsic power law that has been reddened by some extinction law. The intrinsic spectral slope of an afterglow can be determined by reddening an assumed intrinsic power law spectrum until it matches the observed spectrum. This allows both the intrinsic and the amount of extinction in the host galaxy along the line of sight to the burst to be determined (see Fig. 1).

The relationship between the spectral slope and the electron index depends on the relative ordering of the cooling and synchrotron frequencies with respect to the optical, and there are cases where is independent of . Some case can usually be ruled out by the intrinsic value of the spectral slope. Also, if spectra from other frequency bands are available, such as -ray data, then they can also be used to estimate the value of the electron index. The requirement that the electron index must be the same at all frequencies can help rule out some orderings of and .
Models for ten GRB afterglows are presented by [10]. The mean electron index for these bursts is , but five bursts have . In the standard relativistic fireball model represents infinite energy in the electrons thus is unphysical. This problem can be avoided by introducing an upper limit for the electron energy distribution, However, detailed modelling of the acceleration of particles in highly relativistic shocks predict that the electron index should be [11], which is inconsistent with what is seen in many bursts. The fact that many GRBs appear to have electron indices of less than two may indicate the need for detailed magnetohydrodynamic modelling of GRB afterglows in order to accurately determine the fireball parameters.
4 Optical Decay
The rate of decay of the optical flux, , is related to the value of the electron index. These relationships are given by [12] for an expanding sphere, and a jet, in a homogeneous ambient medium. Similarly, [13] find corresponding relationships for a burst in a pre-existing stellar wind. If the value of the electron index can be securely determined from spectra then it can be used to predict the value of . This can then be compared to the observed optical decay to determine the relative ordering of and with respect to the optical band, as well as the nature of the ambient medium around the progenitor. In practice it is not always possible to determine solely from spectral data, and sparse photometry can make it difficult to determine the location of the break in the optical decay. In these cases must be determined simultaneously from the optical decay and spectral slope using closure relations [14]. However, it is not always possible to unambiguously distinguish between different cases. Fig. 2 shows examples of well-determined optical decays.
5 Breaks
There are several mechanisms that can cause a break in the observed power-law decay of the optical afterglow of a GRB. When the cooling break passes through the optical (moving towards lower frequencies in a homogeneous ambient medium and moving towards higher frequencies in a pre-existing stellar wind) the slope of the optical decay will change. In a homogeneous ambient medium the decay becomes steeper by while in a pre-existing stellar wind the decay becomes shallower by the same amount. The time of this break depends on frequency, so it will occur at different times in different optical bands. A similar break will occur when the synchrotron frequency passes through the optical. This is expected to occur within hours of the burst and the change in the optical decay will depend on the details of the the ambient medium and location of and .
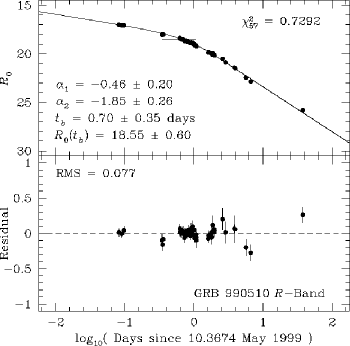
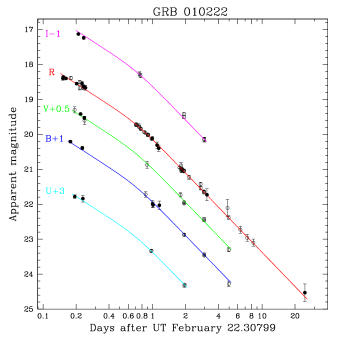
Breaks have been seen in the optical decays of several afterglows. The first detections were [16] and [17] who claimed a chromatic break in the optical decay of GRB 990123. The break was later shown to be achromatic by [18]. The first clear detection of an achromatic break was by [19, 18] (see Figure 2). As of this writing breaks have been seen in 19 afterglows with break times ranging from days for GRB 010222 to days for GRB 000418 and GRB 970508. Since none of these breaks have shown any dependence on colour it is unlikely that they are due to a spectral break moving through the optical.
Another break occurs when the relativistic fireball slows down sufficiently that relativistic beaming stops. The fireball is initially expanding at highly relativistic speeds, so all of the radiation from the external shock is relativistically beamed into a cone with a half-opening angle of where is the Lorentz factor of the expanding fireball. As the fireball expands into the surrounding medium it decelerates. At early times, when is large, all of the radiation is relativistically beamed toward the observer. However, when becomes small only that fraction of the light that is intrinsically radiated towards the observer is visible. This causes the observed flux to decrease more rapidly and results in a break in the observed decay rate. The beaming break is a purely geometric effect and thus will be achromatic. The beaming break will occur regardless of the geometry of the fireball and will result in the decay becoming steeper by .
If the fireball is intrinsically collimated into a cone with a half-opening angle of (i.e., a jet) then yet another break can occur. When drops to the shock front stops expanding and sideways expansion begins to dominate the dynamics of the jet. This leads to a rapid increase in the rate of the optical decay, . In general the late-time decay is once sideways expansion dominates. The critical Lorentz factors for both the onset of sideways expansion, and the end of relativistic beaming are similar, so it is difficult to separate these two breaks observationally. In general the observed change in the decay slope is significantly steeper than what is expected from the end of relativistic beaming. This strongly suggests that the fireball is intrinsically collimated. However, several bursts, such as GRB 990510 and GRB 010222, exhibit breaks which appear to occur over an extended period of time. Some of this is due to sampling uncertainties and some of it is probably a result of the processes that cause the breaks occurring over a finite period of time. In some cases, however, the long durations may indicate that both beaming and the sideways expansion are contributing to the change in the optical decay at approximately the same time.
6 Alternative Models
There are several alternate models to the standard relativistic fireball for GRBs. The cannonball model [20, 21] proposes that some supernovæ eject “cannonballs” of baryonic matter at highly relativistic speeds. The gamma-ray pulses come from interactions of the ejected material with circumstellar shells of material. These “cannonballs” are similar to those seen in microquasars. There are also several binary progenitor models which propose that bursts are due to the merging of two compact objects. These models include the binary neutron star model [22] and the merger of a black hole and a neutron star [23].
7 The Late-Time Bump
To within the observational uncertainties the unusually faint, in gamma rays, burst GRB 980425 occurred at the same time and location on the sky as the unusually radio-loud Type Ib/c supernova SN1998bw [24]. This was the first evidence that some GRBs might be related to supernovæ. The maximum brightness of a supernova typically occurs approximately one week (in the rest frame) after the explosion. The optical afterglows of GRBs, on the other hand, usually reach a maximum brightness within minutes or hours after the burst. GRB 970508 was an exception. Its optical afterglow remained at a constant luminosity for approximately one day then brightened by a factor of about seven. The difference in time scales for the maximum brightness of supernovæ and GRBs means that the supernova component of the light should be visible as a rebrightening over what is predicted from the power-law decay at days after the burst.
The first evidence for a late-time bump was GRB 980326 [25]. The optical afterglow of this burst brightened by mag over the magnitude predicted by the best-fitting power law decay approximately 20 days after the burst. This was interpreted by [25] as an overluminous SN Ib/c at superimposed on the power-law decay of GRB 980326. Since then bumps have been claimed for several bursts, but many of these bumps have had low significance and are consistent with uncertainties in the photometry or contamination from the host galaxy.

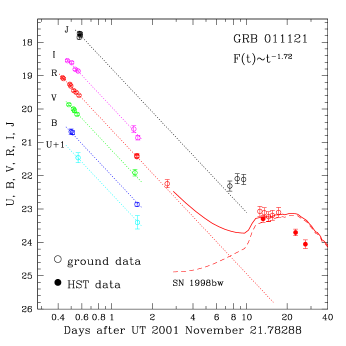
The strongest evidence for an association between GRBs and supernovæ comes from optical observations of GRB 011121. The optical afterglow of this burst showed a large deviation from a power-law decay starting approximately one week after the burst [26, 27]. The duration and magnitude of this bump were consistent with a supernova peaking days, in the rest frame, after the burst. The bump exhibited colour evolution that was consistent with the local Type IIn supernova SN1998S. Unfortunately the presence of a supernova component to GRB 011121 did not become known until the HST/WFPC2 images became public, three months after they were obtained [28], so a golden opportunity for intensive follow-up observations of the closest () known classical GRB with a supernova component was lost.
An alternate explanation for the late-time bump is light from the burst being scattered by dust located between and 1.0 pc from the progenitor. The bumps seen in the optical decays of GRB 970228 and GRB 980326 –30 days after the burst are consistent with such a dust echo [29]. As of this writing there is no burst where a dust echo provides a better description of a late-time bump than a supernova does. Most late-time bumps can be equally-well described by a supernova, a dust echo, or even no bump (e.g., [30]).
8 Rapid variations
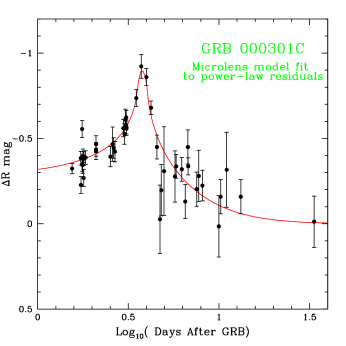
The classic GRB optical light decay shows no evidence for rapid variations away from a power law decay. As of the writing of this article the two exceptions are GRB 000301C and GRB 011211 (see Figure 4). GRB 000301C exhibited achromatic flux variations of up to % over time scales of several hours between three and six days after the burst. This was interpreted as the signature of gravitational lensing from an approximately star located at [31].
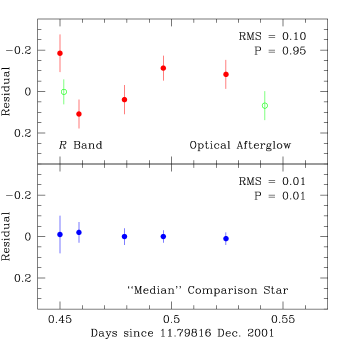
Rapid variations in the optical decay have been observed for GRB 011211 [32, 33] approximately half a day after the burst. These variations are at the % level and have time scales of hour. They can be interpreted, using the framework of [34], as being due to small-scale inhomogeneities in the environment –0.2 pc from the burst’s progenitor. Their analyses of the optical light curve from this burst suggests that GRB 011211 occurred in a circumburst medium that is homogeneous over large scales but with density variations of a factor of approximately two over distances of –125 AU.
These small-scale fluctuations are similar to those seen in the interstellar medium in the Galaxy [35, 36]. Similar small-scale density fluctuations are also common in the environments of Wolf–Rayet stars. Radiative instabilities in Wolf–Rayet stars can give rise to extensive structure and strong clumping in their stellar wind [37, 38]. If GRBs are related to the death throes of massive stars then it is reasonable to expect similar sub-structure in the local environments of GRBs. This makes the paucity of rapid fluctuations in most GRB light curves difficult to explain. One possible explanation is the geometry of the direction of the progenitor’s rotation axis relative to Earth. Another possibility is that the winds from the GRB progenitors are not symmetric. If the wind is denser near the equatorial regions of the progenitor, yet the GRB occurs from the poles, the burst may avoid the bulk of the structure in the local ambient medium.
9 What about the future
The future of optical observations of GRBs promises to be an exciting one. The upcoming Swift mission will dramatically increase the rate of well-localized bursts. An onboard optical/ultraviolet telescope will be able to locate optical afterglows to within a few arcseconds with-in minutes of the burst. This rapid identification will permit study of the still-mysterious early time behavior of the optical afterglow. Swift’s rapid follow-up capabilities may also allow us to solve the puzzle of the short–hard bursts. Complementary to rapid follow-up observations will be large-scale surveys and infrared observations. These will allow us to estimate the true rate of optical afterglows and thus probe the nature of dark bursts.
Perhaps the most important need for the future is continuous monitoring of afterglows from immediately after the burst to as late as possible. We need to understand the early time behavior of afterglows to disentangle the effects of internal, external, and reverse shocks. We also need to map out the breaks for as many bursts as possible so that we can make statistically rigorous statements about the times and durations of the breaks and their relation (if any!) to the geometry of GRBs. Finally, we need long-term monitoring after each burst so that late-time bumps can be identified or ruled out for all bursts.
This work was partially supported from the NASA LTSA grant NAG-9364, by the Neils Bohr Institute for Astronomy, Physics, and Geophysics, and by the University of Copenhagen.
References
- [1] P. J. Groot, T. Galama, J. van Paradijs, et al., IAUC 6584, (1997)
- [2] J. van Paradijs, P. J. Groot, T. Galama, et al., Nature 386, 686, (1997)
- [3] M. R. Metzger, S. G. Djorgovski, C. C. Steidel, et al., IAUC 6655, (1997)
- [4] M. R. Metzger, S. G. Djorgovski, S. R., Kulkarni, et al., Nature 387, 878, (1997)
- [5] C. W. Akerlof, & T. A. McKay, IAUC 7100, (1999)
- [6] C. Akerlof, R. Balsano, S. Barthelemy, et al., Nature 398, 400, (1999)
- [7] S. T. Holland, & J. Hjorth, A&A 344, L67, (1999)
- [8] Mészáros, P., ARAA 40, 137, (2002)
- [9] J. P. U. Fynbo, J. Gorosabel, T. H. Dall, et al., A&A 373, 796 (2001)
- [10] A. Panaitescu, & P. Kumar, ApJ 571, 779, (2002)
- [11] A. Achterberg, Y. A. Gallant, J. G. Kirk, & A. W. Guthmann, MNRAS 328, 393, (2001)
- [12] R. Sari, T. Piran, & J. P. Halpern, ApJL 519, L17, (1999)
- [13] R. A. Chevalier, & Z.-Y. Li, ApJL 520, L29, (1999)
- [14] P. A. Price, E. Berger, D. E. Reichart, et al., ApJL 572, 51, (2002)
- [15] K. Z. Stanek, P. M. Garnavich, S. Jha, et al.. ApJ 563, 592, (2001)
- [16] S. R. Kulkarni, S. G. Djorgovski, S. C. Odewahn, et al., Nature 398, 389, (1999)
- [17] A. J. Castro-Tirado, M. R. Zapatero-Osorio, N. Caon, et al., Science 283, 2069, (1999)
- [18] S. T. Holland, G. Björnsson, J. Hjorth, & B. Thomsen, A&A 364, 467, (2000)
- [19] K. Z. Stanek, P. M. Garnavich, J. Kaluzny, W. Pych, & I. Thompson, ApJ 522, L39, (1999)
- [20] S. Dado, A. Dar, & A. De Rújula, A&A 393, L25, (2002)
- [21] S. Dado, A. Dar, & A. De Rújula, A&A, submitted, (2003), astro-ph/0204474
- [22] R. Narayan, B. Paczyński, & T. Piran, ApJL 395, L83, (1992)
- [23] B. Paczyński, Acta 41, 257, (1991)
- [24] T. Galama, P. Vreeswijk, J. van Paradijs, et al. Nature 395, 670, (1998)
- [25] J. S. Bloom, S. R. Kulkarni, S. G. Djorgovski, et al., Nature 401, 453, (1999)
- [26] P. M. Garnavich, K. Z. Stanek, L. Wyrzykowski, et al., ApJ, in press, (2002), astro-ph/0204234
- [27] J. S. Bloom, S. R. Kulkarni, P. A. Price, et al., ApJL 572, L45, (2002)
- [28] P. M. Garnavich, S. T. Holland, S. Jha, R. P. Kirshner, D. Bersier, & K. Z. Stanek, GCNC 1273, (2002)
- [29] A. A. Esin, & R. Blandford, ApJL 534, L151, (2000)
- [30] S. T. Holland, J. P. U. Fynbo, J. Hjorth, et al.. A&A 371, 52, (2001)
- [31] P. M. Garnavich, A. Loeb, & K. Z. Stanek, ApJL 544, L11, (2000).
- [32] S. T. Holland, I. Soszyński, M. D. Gladders, et al., AJ 124, 639, (2002).
- [33] P. Jakobsson, J. Hjorth, J. P. U. Fynbo, et al., A&A, submitted, (2002).
- [34] X. Wang, & A. Loeb, ApJ 535, 788, (2000).
- [35] P. J. Diamond, W. M. Goss, J. D. Romney, R. S. Booth, P. M. W. Kalberla, & U. Mebold, ApJ, 347, 302, (1989)
- [36] M. D. Faison & W. M. Goss, AJ, 121 2706, (2001)
- [37] K. G. Gayley & S. .P. Owocki, ApJ 446, 801, (1995)
- [38] D. J. Hillier, A&A 247, 455, (1991)
- [39] J. S. Bloom, GCN 1260, (2002)
Discussion
Edo Berger (Caltech): Why wasn’t a spectrum of GRB 011121 taken say after 14 days since it is the lowest redshift known GRB? An indication of a SN from photometry was not really required.
At 14 days after the burst there was no indication that a SN bump was present. In addition, [39] reported that HST observations showed “no evidence of an intermediate-time light curve bump (from an underlying supernova, etc.)”. Telescope time is valuable, so it was not used to obtain a spectrum of an object that the initial analysis of the best available imaging data suggested did not exist. It was not until the HST data became public and was reanalysed by [28] that there was any publicly-available evidence for a supernova component.
Edo Berger (Caltech): In response to the speakers claim that radio observations allow us to study events only out to , I would like to point out that this is in fact incorrect (e.g. GRB 000301C). The main problem is that both radio and optical probe a narrow range of the broad-band synchrotron spectrum and therefore both are needed to infer wind vs ISM circumburst medium.
This is correct. Radio can be used to study afterglows beyond .
S. Woosley (UCO/Lick): One should be careful drawing inferences pro or con regarding a SN presence based on the colour of the bump in the optical afterglow of a GRB. An aspherical SN viewed down its explosion axis may have peculiar characteristics. SN1998ba accompanied a non-standard GRB (either because it had low explosion energy or was viewed off axis.). The colour of a SN Ic is sensitive to the amount of Ni made. Less Ni gives a blue supernova.
This is a very good point. What is needed is high-resolution spectra of the late-time bumps which can be tested for supernova signatures.
Jens Hjorth (Copenhagen): Do alternative models for the late light curve bump explain the preference for bumps to peak at around 10–20 days at a peak magnitude comparable to a redshift SN1998bw spectrum?
There is no single explanation that I am aware of.
D. Lazzati (Cambridge): What is the increasing evidence that bumps are related to SNe? Aren’t they simply consistent with SNe?
All of the observed bumps are consistent with supernovae. This is not proof, but it is suggestive that there is a link.
M. Rees (Cambridge): The steepening in the light curves at late times obviously fits nicely with the Rhoads model. But if we didn’t believe in beaming for other reasons (energetics, astrophysical, redshifting etc.), maybe we would not find it too hard to interpret the data differently?
I agree with this statement. However, the Rhoads model reproduces the general features seen in GRB afterglows. This suggests that the general features of the model are a reasonable approximation to reality.
M. Rees (Cambridge): It would be rather surprising if the spectral break at the cooling frequency were naturally very sharp. There are various effects (reacceleration, inhomogeneities, etc.) that could smear it out. How sharp do the data require it to be?
The identification of break times is somewhat uncertain and can depend on the fitting function used (e.g., [18]). The times of the best-defined breaks tend to be uncertain by several hours. This is probably the smallest time scale that breaks occur on. However, more bursts, and continuous monitoring of afterglows during their breaks are needed to address this issue properly.
M. Rees (Cambridge): Do you think SN1998bw could be a “standard” GRB that is misaligned without its radio emission being stronger than is observed?
I suspect that SN1998bw is one point on a continuum of GRBs. At present I lean towards the idea that SN1998bw was a standard, collimated GRB which was oriented away from us. However, I will leave a a detailed response to those who are far more familiar with this supernova than I am.