Superluminal Motion and Relativistic Beaming in Blazar Jets
Abstract
High resolution radio observations remain the most direct way to study the formation and evolution of radio jets associated with the accretion onto massive black holes. We report preliminary results of our seven year VLBA observational program to understand the nature of relativistic beaming in blazars and the surrounding environment of massive black holes.
Most blazars show an apparent outward flow away from an active core. However, in a few sources the motion appears inward, most likely the result of projection of a curved trajectory which bends back toward along the line of sight. The apparent motion of jet features is not always oriented along the direction separating the feature from the core, and in a few cases we have observed a clear change in the direction and velocity of a feature as it flows along the jet. In other sources, the motion appears to follow a simple ballistic trajectory. We find no simple relation between the time scales of flux density changes and apparent component velocities.
NRAO, 520 Edgemont Rd., Charlottesville, VA, 22903, U.S.A.
MPIfR, Auf dem Hugel 69, Bonn, D-53121, Germany
Astronomy 105-24, Caltech, Pasadena, CA 91125, U.S.A.
ASTRON, P.O. Box 2, NL-7990 AA Dwingeloo, The Netherlands
1. Background
It is generally accepted that the blazar phenomenon is due to the anisotropic boosting of the radiation along the direction of motion which gives rise to an apparent enhanced luminosity at all wavelengths if the observer is located close to the direction of motion. There are many observations which support this interpretation including the one sided appearance of blazar jets and the rapid flux density variability observed at many wavelengths. However, the only direct observations of relativistic motion are at radio wavelengths when motion close to the line of sight produces a compression of the time frame resulting in apparent superluminal motion. High resolution interferometric radio images are able to measure such motions which are typically less than one milliarcsecond per year.
Since 1994, we have been using the NRAO Very Long Baseline Array (VLBA) at 15 GHz (2 cm) to study this relativistic outflow in a sample of quasars and active galactic nuclei (AGN). Our goal is to understand the nature of the relativistic flow and the origin and propagation of relativistic jets. In particular, we want to know how blazars differ from other quasars and active galactic nuclei. The high resolution radio images often show pronounced bends and twists. We want to know whether or not the flow appears ballistic, that is if individual features have straight trajectories as would occur from a precessing nozzle, or, whether features follow the curvature of the jet characteristic of plasma instabilities. Are there changes in the speed or direction of features as they propagate down the jet? Does the moving pattern actually reflect the bulk flow velocity, or is there a separate pattern velocity, for example reflecting the propagation of shocks along the jet? Is there a characteristic Lorentz factor for different classes of AGN? If not, what is the distribution of Lorentz factors and what determines their value? Blazars typically show pronounced flux density variations on time scales ranging from minutes to years. Do these flux density outbursts reflect the origin of new superluminal components, and how do the time scales of intensity variations relate to apparent velocity?
Our full sample consists of 173 galaxies, quasars, and BL Lac Objects. In order to relate our observations to relativistic beaming models, we wished to define a complete un-biased flux density limited sample. However, as there are no sky surveys at 15 GHz, and AGN are generally flux density variable, there is no simple objective way of obtaining a precisely defined flux density limited sample.
Assuming a constant intrinsic value of the Lorentz factor, , then if the bulk velocity is equal to the pattern velocity, it is easy to calculate the distribution of observed apparent velocity (e.g., Vermeulen & Cohen 1994). However, if there is a distribution of ’s, then an analytic solution is more difficult. One of our goals was to compile a sample whose properties can be compared with Monte Carlo simulations of relativistic beaming, so we selected sources on the basis of the parsec scale flux density only, ignoring any contribution from extended (kiloparsec-scale) structure that is not necessarily beamed. Our sample includes all known sources which meet the following criteria.
-
•
Declination
-
•
Galactic latitude
-
•
Total 2 cm VLBA flux density Jy, ( Jy if below the celestial equator) at any epoch since 1995.
We refer to this sample as an unbiased representative sample. We have, so far, good multi epoch observations of 96 sources. Observations in progress are expected to increase the number of sources to what will be a complete unbiased sample of about 120 sources. We have constructed the sample by reference to the Kühr 1 Jy catalog (Kühr 1981), the VLA calibrator manual, the JVAS survey, the VLBA Calibrator Survey (Beasley et al. 2002), the 22 GHz VLBI survey of Moellenbrock et al. (1996) the high-frequency peaked samples of Teräsranta et al. (2001) and Dallacasa et al. (2000), and the UMRAO (http://www.astro.lsa.umich.edu/obs/radiotel/umrao.html) and RATAN (Kovalev et al. 1999) monitoring programs. Although our selection method is somewhat complex, it is based on the directly-measured compact flux density, and does not use a single-epoch spectral index criterion to estimate compact flux density. Also the fact that survey membership is not determined from a single ”snapshot” epoch means that we are not excluding potentially interesting sources simply because they happened to be in a low state at the time of the original investigation.
In this paper we present data on the 157 individual features found in the 96 sources in our full sample which have core-jet structure for which we have obtained good multi-epoch data on their motion and which have measured redshifts. We have generally observed each source about once per year, but more often for those sources with rapid changes and less often for those with slow changes. Each image typically has an angular resolution better than 1 milliarcsec, rms noise about 250 Jy, and dynamic range better than 1000:1. Images of all of our observations are available at http://www.nrao.edu/2cmsurvey which will soon be supplemented by material describing the motions observed in each source. Throughout this paper we use a cosmology with km/sec/Mpc, , and .
2. Statistics of Superluminal; Motion
In spite of decades of studying superluminal source motions, the details of the kinematics have remained elusive. One of the problems is, that contrary to indications of early observations (e.g., Cohen et al. 1977), the radio jets often do not contain simple well defined moving components. Instead, the jets may show a complex brightness distribution with regions of enhanced intensity that may brighten and fade with time. Some features appear to move; others are stationary, or may break up into two or more separate features, and it is often unclear how these moving features are related to the actual underlying relativistic flow.
With these sensitive, high-resolution, high-dynamic range images from the VLBA, we are generally able to define one or more components in each source which have lasted for the duration of our observing program. Figure 1 shows the distribution of apparent linear velocity for the 157 components contained in our full sample that have well-determined motions. This includes 104 quasar components, 31 BL Lac components, and 22 components associated with the nucleus of an active galaxy.

Figure 1 is in marked contrast to early discussions of superluminal motion, which indicated typical values of in the range 5 to 10 (Cohen et al. 1977, Porcas 1987). We believe that these earlier studies were biased in favor of faster apparent velocities since they were not based on unbiased samples, but rather used velocities which had been reported in the literature and which contained a disproportionate fraction of high velocities, as the slow velocities being ”uninteresting” and more difficult to measure, were usually not followed up with further observations nor were they reported in the literature.
Most of the sources in our sample are quasars and their velocity distribution is peaked near low values of v/c between zero and ten, but there is a tail extending out to v/c 34. Features associated with the active nuclei of galaxies all appear to have motions in the range , while the BL Lac objects appear more uniformly distributed over the entire range from 0 to 35.
Several of the observed velocities are negative, that is the jet component appears to be approaching rather than receding from the core. However, most of these reported negative velocities are consistent, within the errors, with no significant motion. In other cases, there is evidence of a newly emerging component ejected from the core, and the combination is not resolved by our beam. This causes an apparent shift in the position of the core and a corresponding decrease in the apparent separation of the core and jet component. It is also possible that the true core is not seen, possibly due to absorption, and that both of the components we are observing are part of the moving jet. In a few cases, such as 0454+844, 0735+178, and 1128+385, the apparent decrease in component separation from the core may be due to component motion away from the core along a highly curved jet which bends back toward the line of sight so that the apparent projected separation from the core appears to decrease with time.
We interpret our observations based on relativistic beaming models which assume all sources are relativistic with an intrinsic velocity close to the speed of light described by a Lorentz factor, . In a simple ballistic model, in which all jets have the same Lorentz factor, the effect of Doppler boosting increases the probability of observing sources close to the line of sight. In the case of a flux limited sample, angles close to are commonly observed where (e.g., Vermeulen & Cohen 1994, Vermeulen 1995). If there is no Doppler boosting, then most sources are expected to lie near the plane of the sky with an apparent velocity near c. The observed velocities do not show the expected concentration near the upper end of the distribution corresponding to the simple single-gamma ballistic model. Ekers & Laing (1990) have commented that light echo models, in particular, which do not invoke any Doppler boosting, are consistent with this kind of observed velocity distribution. Our observed distributions actually peak at lower values than expected from simple light echo models. Moreover, we find a strong correlation between apparent velocity and apparent radio luminosity as expected if the apparent radio luminosity is enhanced by Doppler boosting (Lister et al. 2003a).
Lister and Marscher (1997) have shown that an observed velocity distributions similar to that shown in Figure 1, may be reproduced with a power law distribution of intrinsic Lorentz factors. Our data are consistent with such a distribution having a large excess of small Lorentz factors contained in a volume limited sample (Lister et al. in preparation). Alternatively, the bulk velocity flow which determines the amount of Doppler boosting may be less than the pattern flow which may reflect the propagation of shock fronts rather than the relativistic flow (e.g., Vermeulen Cohen 1994). The interpretation of jet kinematics is further complicated if there is a distribution of velocities within a single jet. For example, there may be a fast inner jet surrounded by a more slowly moving outer sheath. In such cases the appearance and apparent velocity will be a complex function of the orientation with respect to the line of sight

3. Kinematics of Curved jets
Many of the jets we have observed show pronounced curvature sometimes with multiple oscillations characteristic of plasma instabilities. Individual components may follow a wide range of trajectories. In some cases, such as 3C 273 (1226+023), the location of the bend appears to propagate away from the center of activity. In such cases the motion may be described as ballistic, that is components appear to move along a straight trajectory, but one which may not be pointed toward the most compact feature assumed to be the core. In other cases, such as 3C 279 (1253055), the component motion is more complex and appears to flow along a non radial or even curved trajectory (Homan et al. in preparation).
Figure 2 illustrates an example of non radial motion in the jet of the quasar 3C390.3 (1845+797). In this case the two prominent components appear to be moving with similar velocities of , but along slightly different trajectories of 27 and 30 degrees. Neither are aligned with the direction of the core or with the extended jet feature which points toward the distant hot spot along position angle = 35∘.
The Ultra Luminous Infra Red Galaxy 1345+125 (4C 12.50) which has a very curved jet along with a weak counterjet, is consistent with a conical helix of wavelength 280 pc that is the result of Kelvin-Helmholtz instabilities driven by a slow precession of the jet nozzle with a half-angle of 23 degrees oriented along an angle of 82 degrees to the line of sight (Lister et al. 2003b).
4. Time Variability and Motions
It is generally assumed that the large rapid changes in flux density which are frequently observed in blazars are the result of Doppler boosting combined with time compression of the relativistic plasma moving nearly along the line of sight. Small changes in the direction of the flow then can lead to large changes in the apparent luminosity and velocity. Provided that the bulk flow velocity and the pattern velocity are the same, we would expect to see a relation between variability time scale and the apparent transverse linear velocity. Lähteenmäki Valtaoja (1999) have calculated Doppler boosting factors from Metsähovi 1.3 cm and 8 mm variability data assuming an intrinsic brightness temperature of K characteristic of a self absorbed synchrotron source where the particle and magnetic energy is in equilibrium.
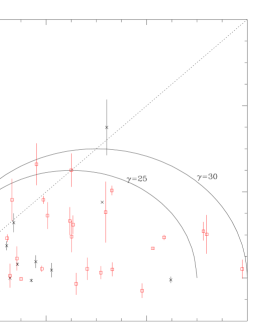
We have compared our VLBA observations with both the Metsähovi and 2 cm University of Michigan (UMRAO) variability data. The UMRAO data covers a longer time period and is more densely sampled; however events which appear to be well defined at 8 mm and 1.3 cm are often blended at the longer wavelength. Figure 3 shows that the observations essentially all fit inside the curve, as they should for a flux density limited sample (Lister Marsher 1997), but the detailed distribution does not match the expected one. Further, there are a number of highly variable sources sources, such as 3C 454.3, CTA 102, and 2134+00 which show little or no significant motions. Each of these sources has a highly bent or oscillating jet. Possibly, the bright features which we have observed in these sources reflect stationary positions along the jet where the relativistic flow is oriented close to the line of sight thus giving rise to enhanced radiation due to Doppler boosting. There does appear to be a well defined upper limit to the measured apparent velocity which is close to the variability Doppler factor. Calculations of the variability Doppler factor using intrinsic brightness temperatures closer to the inverse Compton limit lead to even larger scatter and the lack of any clear envelope to the distribution. Also, we note that there is a large dispersion between between Doppler factors deduced from the UMRAO 2 cm data and the shorter wavelength Metsähovi data, so the robustness of the Doppler factors calculated in this way appears to be very uncertain. The relation between and will be discussed in more detail by Cohen et al. (in preparation).
We acknowledge valuable discussions with Hugh and Margo Aller, Yuri Kovalev jr. and Matthias Kadler.
References
- Beasley et al.(2002) Beasley, A. J., Gordon, D., Peck, A. B., Petrov, L., MacMillan, D. S., Fomalont, E. B., & Ma, C. 2002, ApJS, 141, 13
- Cohen et al.(1977) Cohen, M. H. et al. 1977, Nature, 268, 405
- Dallacasa, Stanghellini, Centonza, & Fanti(2000) Dallacasa, D., Stanghellini, C., Centonza, M., & Fanti, R. 2000, A&A, 363, 887
- Ekers & Laing(1990) Ekers, R., & Laing, R. A. 1990, in Parsec Scale Radio Jets, eds. J.A. Zensus and T. Pearson (Cambridge: University Press), 333
- Kovalev et al.(1999) Kovalev, Y. Y., Nizhelsky, N. A., Kovalev, Y. A., Berlin, A. B., Zhekanis, G. V., Mingaliev, M. G., & Bogdantsov, A. V. 1999, A&AS, 139, 545
- Kühr et al.(1981) Kühr, H., Witzel, A., Pauliny-Toth, I. I. K., & Nauber, U. 1981, A&AS, 45, 367
- Lähteenmäki & Valtaoja(1999) Lähteenmäki, A. & Valtaoja, E. 1999, ApJ, 521, 493
- Lister, M. L. et al. (2003a) Lister, M. Ł, 2003a in Active Galactic Nuclei: from Central Engine to Host Galaxy, eds.: S. Colin, F. Combes, & Shlosman, to be published in ASP Conference Series.
- Lister, M. L. et al. (2003b) Lister, M., L. 2003b, ApJ, in press
- Lister & Marscher(1997) Lister, M. L. & Marscher, A. P. 1997, ApJ, 476, 572
- Moellenbrock et al.(1996) Moellenbrock, G. A. et al. 1996, AJ, 111, 2174
- Porcas(1987) Porcas, R. W. 1987, Superluminal Radio Sources, eds. J. A. Zensus & T. J. Pearson, Cambridge University Press, pg. 12
- Teräsranta, Urpo, Wiren, & Valtonen(2001) Teräsranta, H., Urpo, S., Wiren, S., & Valtonen, M. 2001, A&A, 368, 431
- Vermeulen & Cohen(1994) Vermeulen, R. C. & Cohen, M. H. 1994, ApJ, 430, 467
- Vermeulen (1995) Vermeulen, R. C. 1995, PNAS, 92, 11385