Advanced Camera for Surveys Observations of Young Star Clusters in the Interacting Galaxy UGC 10214
Abstract
We present the first Advanced Camera for Surveys (ACS) observations of young star clusters in the colliding/merging galaxy UGC 10214. The observations were made as part of the Early Release Observation (ERO) program for the newly installed ACS during service mission SM3B for the Hubble Space Telescope (). Many young star clusters can be identified in the tails of UGC 10214, with ages ranging from 3 Myr to 10 Myr. The extreme blue (F606WF814W) colors of the star clusters found in the tail of UGC 10214 can only be explained if strong emission lines are included with a young stellar population. This has been confirmed by our Keck spectroscopy of some of these bright blue stellar knots. The most luminous and largest of these blue knots has an absolute magnitude of , with a half-light radius of 161 pc, and if it is a single star cluster, would qualify as a super star cluster (SSC). Alternatively, it could be a superposition of multiple scaled OB associations or clusters. With an estimated age of 4-5 Myr, its derived mass is 1.3 . Thus the young stellar knot is unbound and will not evolve into a normal globular cluster. The bright blue clusters and associations are much younger than the dynamical age of the tail, providing strong evidence that star formation occurs in the tail long after it was ejected. UGC 10214 provides a nearby example of processes that contributed to the formation of halos and intra-cluster media in the distant and younger Universe.
Accepted for publication in The Astrophysical Journal
1 Introduction
In 2002 April, as part of the early release observations (EROs) to demonstrate the new capabilities of the Advanced Camera for Surveys (ACS; Ford et al. 1998) installed in early March 2002 on the Hubble Space Telescope (), deep images of the interacting galaxies NGC 4676 (“The Mice”) and UGC 10214 (“Tadpole” = VV 29 = Arp 188) were obtained, using the Wide Field Channel (WFC) with the F475W (), F606W (broad ) and F814W () filters. NGC 4676 is a pair of galaxies caught in the act of a collision, while UGC 10214 appears as a disturbed spiral with a long tail of stars. In this paper, we present the observations, and focus on the search and identification of very young star clusters found in the long tidal tail of one of these galaxies, UGC 10214. In addition, we present optical spectroscopy of some of these brightest clusters obtained with the Keck 10m telescope. A detailed analysis of the data, including the magnitudes, colors, specific frequencies and spatial distributions of candidate clusters found in the both systems of interacting galaxies will be the subject of a future paper (Sirianni et al. 2002). Analysis of the numerous faint galaxies visible in the background field will also be presented in a separate paper (Benítez et al. 2002). The redshift of UGC 10214 is (Briggs et al., 2001), placing it at a distance of 125 Mpc ( km s-1 Mpc-1). At this distance, 1″ corresponds to 606 pc, and 1 WFC pixel covers 30.3 pc.
2 Observations and Reduction
2.1 ACS Imaging
The initial ACS observations of UGC 10214, dubbed the Tadpole, were obtained on 2002 April 1 (UT), using the ACS/WFC through the F475W (), F606W (broad ) and F814W () filters. We used POS TARG command offsets of 3″ in the Y direction to bridge the gap between the two WFC chips. In order to minimize the visibility of the gap, for each filter, we commanded the telescope offsets to three pointings, at (0″, 0″), (0248, 3001) and (0248, 3001). At each POS TARG position, two individual exposures were taken to aid in the removal of cosmic rays. Unfortunately, there was an error in the telescope pointing for the first set of observations, which caused part of the “head” of the Tadpole to get cut off from the field of view. A second set of observations were subsequently obtained on 2002 April 9, using the identical settings and sequence of exposures as the first, but with a slight change in the position and telescope orientation to include the entire head and body of the “Tadpole” in the full WFC field of view. The total exposure times for the sum of both sets of observations were 13,600s (6 orbits) in F475W, 8,040s (4 orbits) in F606W, and 8,180s (4 orbits) in F814W.
The data were reduced by first calibrating with CALACS, which included bias and dark subtraction, flat fielding, and cosmic ray rejection, then processed through the ACS Investigation Definition Team pipeline at Johns Hopkins University, which measured offsets and rotations between individual dithered images from both datasets and combined them while removing geometric distortion, residual cosmic rays and detector defects. We used the best reference files available at the time of reduction. The reader is referred to the ACS Data Handbook (Mack et al. 2002) for details.
Identification of point-like objects (stars and clusters) and their photometry were performed using DAOPHOT with an aperture radius of 3 pixels (015) and sky background between 10-15 pixels. Since the size of a WFC pixel (30.3 pc) is much larger than the typical effective radius of young blue clusters found in nearby galaxies (Larsen, 1999), the majority of the compact clusters identified in our image are not resolved. The aperture correction was therefore calculated by measuring the encircled energy profiles for three isolated stars in the field. The corrections applied were: 0.11 (F475W), 0.14 (F606W) and 0.17 (F814W). All magnitudes are in AB system with the following zero points: 25.87 (F475W), 26.36 (F606W) and 25.86 (F814W). No correction for Galactic extinction was performed, as it is negligible. We used the following selection criteria to identify the cluster candidates: i) cluster must be present in all three bands, ii) FWHM 1 pixel in all 3 bands, iii) , to exclude stars, and iv) magnitude error in all three bands.
2.2 Keck Spectroscopy
Long-slit spectra were obtained on 2002 May 11 with the Echellette Spectrograph and Imager (ESI, Sheinis et al. 2002) on the Keck II telescope using the multiorder echellette mode with an 1″ wide slit. The slit was centered on a cluster or “knot” of bright blue stars in the tail of UGC 10214 [RA=16 06 15.16, Dec= +55 25 48.74 (2000)], and oriented at PA = 70° along the elongation of the blue knot to include a trail of nearby clumps of stars (see Fig. 1). A single 900s exposure was obtained through variable clouds, giving a wavelength coverage from 3900 Å to 11000 Å, with a two pixel spectral resolution of 55 km s-1(FWHM). The data were reduced using standard IRAF tasks.
3 Results
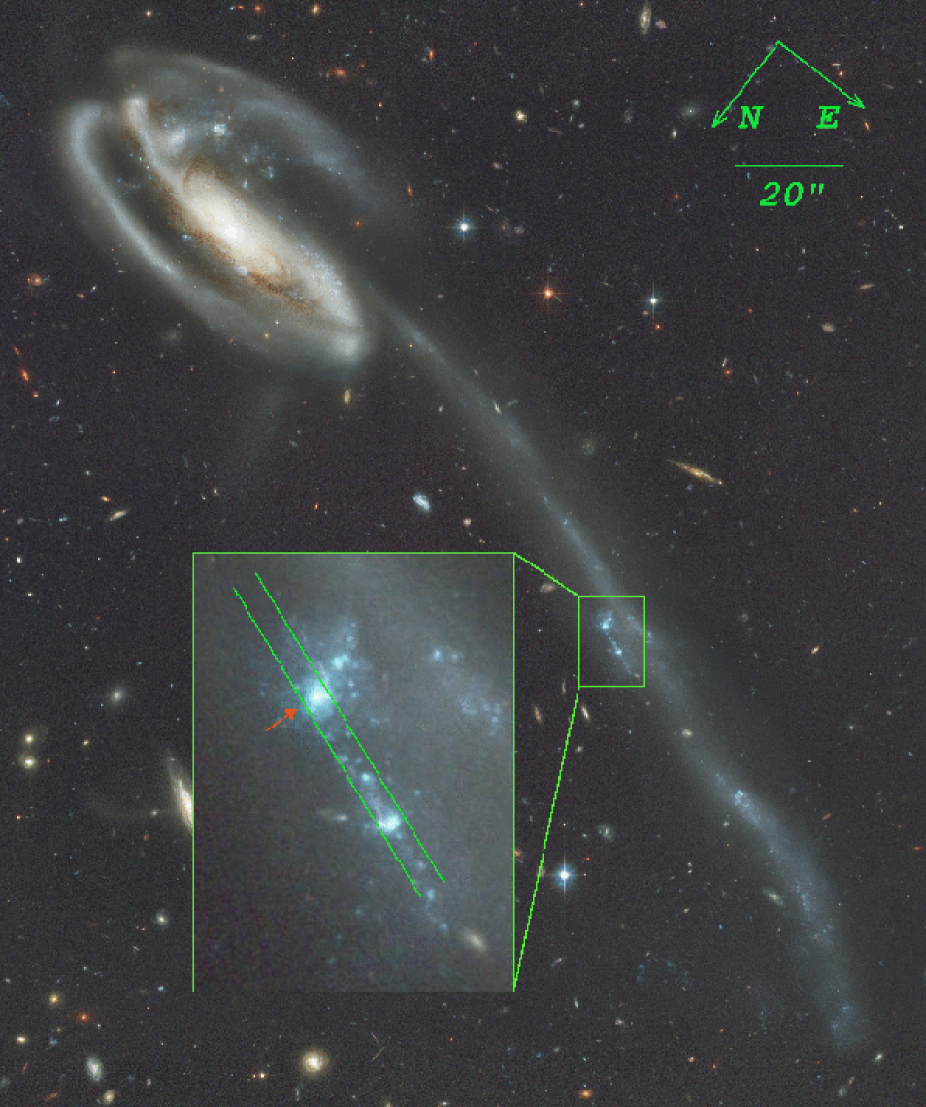
Figure 1 shows a color image of UGC 10214 and a close-up of the bright extended stellar association found in the tail of the galaxy. We identified a total of 42 cluster candidates in this region of the tail; their F475W F606W () vs. F606W F814W () color-color diagram is shown in Figure 3. The points generally cluster in a narrow range of color, but
![[Uncaptioned image]](/html/astro-ph/0211371/assets/x2.png)
F475W F606W () vs. F606W F814W () color-color diagram for the 42 clusters identified in the bright blue extended clump in the tail of UGC 10214. The solid curve shows the stellar evolutionary track from the population synthesis models (for instantaneous starburst with Salpeter IMF, and empirical stellar spectra with solar metallicity) of Bruzual & Charlot (2001). The dashed curve denotes the same model but with the addition of emission lines. Labels along the tracks indicate ages in Myr. A reddening vector for is also shown. The arrow marks the brightest stellar knot (red arrow in Fig. 1), which has an absolute magnitude of and qualifies as a super star cluster (SSC). The extreme blue color of this and other clusters cannot be explained by the stellar population alone, but is due instead to the presence of strong emission lines.
they cover a wider range in , from zero to 2.0.
The brightest stellar knot (marked by an arrow in Fig. 1) of the extended blue clump is very blue ( = 1.18, = 0.05), and has apparent AB magnitudes of F475W () = 21.07, F606W () = 21.12, F814W () = 22.30. With an absolute magnitude of , it is most likely a very young massive super star cluster (SSC). The combination of the moderate color but extremely blue color cannot be explained by the usual population synthesis models of Bruzual & Charlot (2001, hereafter BC01) or Starburst99 models of Leitherer et al. (1999, hereafter SB99), even for stars as young as 1 Myr (see Fig. 3). The simplest way that these colors could be fitted is to include strong emission lines in the starburst models of BC01 and SB99. The alteration of colors of young compact star clusters due to the presence of strong emission lines has been recognized for some time, as discussed in e.g., Mas-Hesse & Kunth (1991), Mayya (1995), Stiavelli et al. (1998) and Whitmore & Zhang (2002), among others.
Shown in Figure 3 are the model spectrum of such a cluster. The model was constructed from a combination of the stellar continuum of BC01 and the strongest and most common emission lines, whose strengths were derived based on the H equivalent width versus age relationship of SB99, and assuming typical line ratios for a starburst region. Also plotted in the figure are the filter bandpasses for the three filters used in the observation. As can be seen, for the redshift of UGC 10214, the F606W filter would allow all of the strongest emission lines through, while they are all excluded from the F814W filter. On the other hand, the strong emission lines of [O III] 4959, 5007, but not the H + [N II] complex, are allowed through the F475W filter. This results in a (F606WF814W) color that is too blue compared to a stellar continuum from a pure (i.e., no emission line) population synthesis model, but a (F475WF606W) color that is not unusual. This clearly demonstrates that the addition of emission lines could naturally explain the extreme observed color, while the color remained relatively unchanged.
The color-color evolutionary tracks derived from the model described above is shown in Figure 3. As can be seen, the model with emission lines (dashed curve) appears to fit better with the observed data points than that without (solid curve). Most of the candidate clusters lie close to and slightly below the
![[Uncaptioned image]](/html/astro-ph/0211371/assets/x3.png)
Model optical spectrum of the SSC in the tail of UGC 10214. Overlaid are the transmission curves of the three filters used. At the redshift of UGC 10214, most strong emission lines are able to pass through both F475W and F606W filters, while none is allowed through F814W.

modeled track, and are consistent with ages in the range 3-10 Myr. The slightly redder color of most of the older clusters compared to the modeled curve could be explained by a small amount of extinction. From a comparison with the model, the best age estimate for the SSC is about 4-5 Myr.
Based on these findings, in May 2002 we obtained Keck spectroscopy of the blue knot (see §2.2) in order to test the following: i) confirm the presence of strong emission lines as required by the models. ii) look for the expected signatures of Wolf-Rayet (W-R) stars which descended from the very massive O stars ( 30 ) in the cluster, and iii) better constrain the spectral energy distribution (SED) of the star cluster and test the theoretical models of BC01 and SB99.
A Keck spectrum of the brightest blue knot is shown in Figure 2. As predicted, very strong emission lines are seen. These lines include those of H, H, [O III] 4959, 5007, [N II] 6548, 6583, and [S II] 6717, 6731. The heliocentric velocity measured from these lines is 9422 7 km s-1. This is consistent with the HI velocity measured by Briggs et al. (2001) at the position of this knot. The emission line widths are very narrow, but may be slightly resolved in our spectra. The observed FWHM is 75 km s-1, giving an instrumental-corrected (subtraction in quadrature) width of 50 km s-1. The observed Balmer decrement H/H is 2.76, indicating very little or no reddening toward the tail of UGC 10214 at the position of this blue knot. Other line ratios are: [O III] 5007/H = 5.53, [N II] 6583/H =0.0705, [S II] (6717 + 6731)/H = 0.090, [O I] 6300/H = 0.012, [O III] (5007 + 4959)/4363 = 86, and [S II] 6717/6731 = 1.35. These emission-line ratios yield an electron temperature of about 1.36 K and density of 60 cm-3, fairly typical of photoionized gas in metal-poor H II regions. They also place them among areas typically occupied by H II regions and H II galaxies in the diagnostic diagrams of Veilleux & Osterbrock (1987).
The observed optical continuum is very faint and barely detectable. This results in a very uncertain determination of the equivalent width (EW) of the H emission line. We measure an H EW of 290 255 Å, the error for which is dominated by that of the continuum level. In principle, this can be used to constrain the age of the star cluster (SB99; Schaerer & Vacca 1998), yielding an estimate of 1-6 Myr, consistent with the age obtained from population synthesis model fits to ACS photometry. Due to the faintness of the continuum and the non-optimum observing conditions, the S/N is insufficient to allow a search for W-R features, such as the 4686Å bump, which is expected for a young star cluster of this age. Better quality spectra would be needed to confirm the existence of W-R stars and constrain the star formation history of the cluster.
4 Discussion
It is of interest to ask if the large knots or clumps of blue stars found in the tail of UGC 10214 were created from the galactic encounter and whether they are precursors to the compact globular clusters (GC) that are found in our Galaxy and essentially all galactic halos. These star clusters are similar to those found in the tidal debris of the Antennae Galaxies (NGC 4038/4039, e.g., Whitmore et al. 1999) or of the Stephan’s Quintet (NGC 7318/7319, Gallagher et al. 2001).
We can estimate the mass of the brightest blue stellar “knot”, or SSC in the tail of UGC 10214 from its estimated age and observed brightness by using an existing relationship between age and mass-to-light ratio () for young stellar clusters derived by Chandar et al. (1999) using Padua models (Chiosi, Vallenari, & Bressan 1997). With a derived age of 4-5 Myr, the correlation gives log . The observed absolute magnitude for the SSC in F606W is 14.45 or , yielding an estimated mass of 1.3 . We note that this actually represents an upper limit of the mass since the modeled does not include contribution from emission lines. To correct for the emission-line contribution, we compared the integrated flux of our modeled spectrum with and without emission lines through the F606W filter. The difference in cluster brightness is found to be 0.75 mag in F606W, giving a corrected (line-free) absolute magnitude of 13.70 or , and reducing the mass to 6.6 . These values are typical for a SSC. In particular, the luminosity and mass of this SSC are similar to those of the 60 Myr old SSC “F” in M82 (Smith & Gallagher, 2001), or of the 15 Myr old SSC “1447” in NGC 6946 (Larsen et al., 2001).
The 3 to 10 Myr ages of the clusters in the tidal tail show that they formed close to their present positions. The projected distance of the 4.5 Myr old SSC is 61 kpc from the center of UGC 10214. Assuming that the maximum ejection velocity available to the cluster is comparable to the 400 km s-1 rotation speed measured by Briggs et al. (2001) for the main galaxy, the dynamical age for the tail is at least 150 Myr old. Since this is much older than the estimated age of the SSC, we conclude that the young clusters in the tail formed long after the galactic encounter that produced the tidal debris. This conclusion is consistent with the mechanism proposed by Wallin (1990), who suggested that star formation was triggered in the tail by density enhancements produced from tidal forces in the collision. It is also consistent with the suggestion by Hibbard & van Gorkom (1996) that “gaps” (region of reduced surface brightness) in tidal tails are induced by self-gravity in the tails. The two most prominent regions of star formation in UGC 10214 tail are separated by the most conspicuous gap in the tail. In situ star formation in tidal tails has also been observed in many other systems (e.g., Schweizer 1978; Mirabel, Dottori, & Lutz 1992), and appears to be a common feature of such tails.
Fitting the surface brightness profiles of the SSC with a king model (King, 1962) gives a core radius of about 0155, or 94 pc, corresponding to a half light radius of = 0266 = 161 pc. To our knowledge, the largest measured for a SSC or a scaled OB association (SOBA) is 84 pc (Maíz-Apellániz, 2001). As a comparison, the F-M82 SSC, which has similar mass and luminosity, has a half light radius of 2.8 pc. Therefore, the unusually large size of the SSC in UGC 10214 suggests that this cluster could be a particularly populous OB association or an unresolved superposition of a multiple system like that in NGC 1569 A1-A2 (De Marchi et al., 1997). In contrast to the case of 30 Doradus Nebula, which has a very large emission-line region but the stellar component is largely confined to the very compact R136 star cluster (Walborn, Maíz-Apellániz, & Barbá, 2002), we can rule out the possibility of a similar significant nebula contribution to the large size of the UGC 10214 SSC. The UGC 10214 cluster radius measured from the F814W data, where stellar continuum dominates, is not significantly different from those measured from the F475W and F606W data, where line emission dominates. Thus, the measured size of the SSC in UGC 10214 can be taken as genuinely due mostly to stars.
The above estimated mass of the SSC (6.6 ) is 3 the mass of a typical globular cluster (GC; Mandushev, Spassova, & Staneva 1991), while its radius is approximately 50 the size of a GC. This corresponds to a mass density that is at least 4 orders of magnitude smaller than that of a GC. Assuming that the projected half-mass radius (Spitzer, 1987), the mass density within the half-mass radius is only . Thus, under the assumption that the SSC represents a single cluster of young stars, it appears to be quite “fluffy” for its mass. For an isotropic, gravitationally bound system, the total cluster mass is given by the virial theorem: , where is the line-of-sight velocity dispersion and is the effective radius. Therefore, to remain bound like a GC, for the blue SSC has to be . The velocity dispersion of a Galactic GC is typically less than 20 km s-1, with a mean of km s-1 (Mandushev et al. 1991), which means that the stellar velocities in the SSC cannot be greater than 5 km s-1, if it is to remain bound. This cannot be the case, if the stars move about like the gas ( 50 km s-1, §3) in the cluster. Thus the blue clump in the tail of UGC 10214 is unlikely grow up to be a GC, unless it is dynamically very cold.
Because we do not know the distribution of mass in UGC 10214’s halo and the geometry of the tidal tail, it is difficult to say whether or not the stars and gas in the tail are gravitationally bound to the parent galaxy. Briggs et al. (2001) found that the HI velocities in the tail are only 100 km s-1 higher than the HI systemic velocity of UGC 10214, with little or no velocity gradient over the 100 kpc length of the tail. They also revealed a possible counter tail on the western side of the main galaxy with an approaching velocity of 300 km s-1. Such tail kinematics are like those of other mergers sporting similarly long tidal tails (e.g., NGC 7252, Hibbard & Mihos 1995; Arp 299, Hibbard & Yun 1999). Numerical simulations of NGC 7252 (Hibbard & Mihos, 1995) have indicated that most of the tail material will remain bound, falling back towards the merger remnant over several billion years, perhaps forming rings, shells and high-velocity streams. Similar detailed modeling for UGC 10214 should be very valuable in accounting for its tidal morphology and tail kinematics, and predicting their future evolution, but it seems likely that the stars and gas will remain bound in the poor cluster WBL 608 (White et al., 1999) to which UGC 10214 belongs. UGC 10214 and galaxies like it provide nearby examples of processes that contributed to the formation of halos and intra-cluster media in the distant and younger Universe, when the density of galaxies was higher.
5 Conclusions
We obtained ACS WFC observations of the peculiar merging galaxy UGC 10214, and presented Keck optical spectra of a luminous, young blue stellar clump located in the tail of the galaxy. The unusually blue color but normal color of the clump can be well explained by the presence of strong emission lines characteristic of H II regions embedded in a super cluster of massive, young stars. Population synthesis models indicate the age of the star cluster to be 4-5 Myr. The large size of the cluster, combined with its moderate estimated mass of suggest that its mass density is too low to allow it to evolve into a normal globular cluster. The bright blue clusters and associations lie at large projected distances, with an age much younger than that of the tail, providing strong evidence that star formation occurs in the tail long after it was ejected.
References
- Benítez et al. (2002) Benítez, N. et al. 2002, ApJ, in preparation
- Briggs et al. (2001) Briggs, F. H., Moller, O., Higdon, J. L., Trentham, N., & Ramirez-Ruiz, E. 2001, A&A, 380, 418
- Bruzual & Charlot (2001) Bruzual, A. G., & Charlot, S. 2001, Population Synthesis Models, http://www.mpa-garching.mpg.de/ menard/SDSS/Spectral_Tools/ (BC01)
- Chandar et al. (1999) Chandar, R., Bianchi, L., Ford, H. C., & Salasnich B. 1999, PASP, 111, 794
- Chiosi et al. (1997) Chiosi, C., Vallenari, A., & Bressan A. 1997, A&AS, 121, 301
- De Marchi et al. (1997) De Marchi, G., Clampin. M., Greggio, L., Leitherer, C., Nota, A., & Tosi, M. 1997, ApJ, 479, 27
- Ford et al. (1998) Ford, H. C., & The ACS Science Team 1998, SPIE Vol. 3356, 234
- Hibbard & Mihos (1995) Hibbard, J. E., & Mihos, J. C. 1995, AJ, 110, 140
- Hibbard & van Gorkom (1996) Hibbard, J. E. & van Gorkom, J. H. 1996, AJ, 111, 655
- Hibbard & Yun (1999) Hibbard, J. E. & Yun, M. S. 1999, AJ, 118, 162
- King (1962) King. I. 1962, AJ, 67, 471
- Larsen (1999) Larsen, S. S. 1999, A&AS, 139, 393
- Larsen et al. (2001) Larsen, S. S., Brodie, J. P., Elmegreen, B. G., Efremov, Y. N., Hodge, P. W., & Richtler, T. 2001, ApJ, 556, 801
- Leitherer et al. (1999) Leitherer, C. et al. 1999, ApJS, 123, 3 (SB99)
- Mack et al. (2002) Mack, J. et al. 2002, in HST ACS Data Handbook, version 1.0, ed. B. Mobasher, Baltimore, STSci
- Maíz-Apellániz (2001) Maíz-Apellániz, J. 2001, ApJ, 563,151
- Mandushev et al. (1991) Mandushev, G., Spassova, N., & Staneva, A. 1991, A&A, 252, 94
- Mas-Hesse & Kunth (1991) Mas-Hesse, J. M. & Kunth, D. 1991, A&AS, 88, 399
- Mayya (1995) Mayya, Y. D. 1995, AJ, 109, 2503
- Mirabel, Dottori, & Lutz (1992) Mirabel, I. F., Dottori, H., & Lutz, D. 1992, A&A, 256, L19
- Gallagher et al. (2001) Gallagher, S. C., Charlton, J. C., Hunsberger, S. D., Zaritsky, D., & Whitmore, B. C. 2001, AJ, 122, 163
- Schaerer & Vacca (1998) Schaerer, D., & Vacca. W. D. 1998, ApJ, 497, 618
- Schweizer (1978) Schweizer, F. 1978, IAU Symp. 77: Structure and Properties of Nearby Galaxies, 77, 279
- Sheinis et al. (2002) Sheinis, A. I., Bolte, M., Epps, H. W., Kibrick, R. I., Miller, J. S., Radovan M. V., Bigelow, B. C., & Sutin, B. M. 2002, PASP, 114, 851
- Sirianni et al. (2002) Sirianni, M. et al. 2002, ApJ, in preparation
- Smith & Gallagher (2001) Smith, L. J., & Gallagher, J. S. 2001, MNRAS, 326, 1027
- Spitzer (1987) Spitzer, L. Jr. 1987, Dynamical Evolution of Globular Clusters. Princeton Univ. Press, Princeton, NJ
- Stiavelli et al. (1998) Stiavelli, M., Panagia, N., Carollo, M., Romaniello, M., Heyer, & M., Gonzaga, S. 1998, ApJ, 492, L135
- Veilleux & Osterbrock (1987) Veilleux, S., & Osterbrock, D. E. 1987, ApJS, 63, 295
- Walborn, Maíz-Apellániz, & Barbá (2002) Walborn, N. R., Maíz-Apellániz, J., & Barbá, R. H. 2002, AJ, 124, 1601
- Wallin (1990) Wallin, J. F. 1990, AJ, 100, 1477
- White et al. (1999) White, R. A., Bliton, M., Bhavsar, S. P., et al. 1999, AJ, 118, 2014
- Whitmore & Zhang (2002) Whitmore, B. C., & Zhang, Q. 2002 AJ, 124, 1418
- Whitmore et al. (1999) Whitmore, B. C., Zhang, Q., Leitherer, C., Fall, S. M., Schweizer, F., & Miller, B. W. 1999, AJ, 118, 1551