Comparing Young Stellar Populations Across Active Regions in the M31 Disk
Abstract
I present preliminary BV resolved stellar photometry of the M31 disk measured from the data set of the NOAO/CTIO Local Group Survey. I have performed detailed analyses of the star formation histories in and around three currently active regions in the M31 disk: OB 78, OB 102 and the northeast spiral arm. The results suggest that low H emission from OB 78 compared to other active regions is directly related to the details of the recent star formation histories of the regions. In addition, while every active region I analyzed shows a recent increase in star formation activity, some active regions also contain overdensities of stars with ages 100 Myr compared to adjacent regions. The adjacent regions show a relatively constant, low star formation rate over the past 100 Myr. There is no significant difference between the stellar populations on either side of the active regions. This symmetry provides no obvious signature of recent propagation of star formation near these currently active regions of the M31 disk.
1 Introduction
The stellar populations of the M31 disk provide an excellent laboratory in which to measure the progression of star formation through a large galactic disk. Resolved photometric studies of the stellar populations in the disk structures, in conjunction with accurate models of stellar evolution, allow the star formation histories (SFHs) of these structures to be measured. Efforts to disentangle the stellar populations in the M31 disk date back to Hubble (1929) who first resolved the stars, and Baade (1944), who first noticed the multiple stellar populations.
Stellar photometry of the M31 disk has provided clues about the age structure of its young stellar populations. Ivanov & Kynchev (1985) used a handful of the brightest stars in several of the southern OB associations to suggest an age structure in the southern disk. Haiman et al. (1994) found evidence that the populations of the OB associations in the eastern and western spiral arms differ, but they were unable to measure ages. Humphreys (1979) found the characteristics of the brightest stars in the outer parts of M31 similar to those in our region of the Galaxy, suggesting similar evolution scenarios. Hodge & Lee (1988) found the upper main sequence luminosity function to be similar across the disk, indicating only slight differences in recent SFHs. Furthermore, the age distribution of the Cepheid variables and compact star clusters in the southern disk of M31 are suggestive of a recent wave of star formation propagating through the disk, currently located at NGC 206 ((Magnier et al. (1997b)), (Williams & Hodge (2001b))). In addition, infrared work by Kodaira et al. (1999) has provided evidence for episodic star formation in different subregions of the OB association A24 during each spiral wave passage Kodaira et al. (1999).
In the past few years several groups have used the Hubble Space Telescope (HST) to put constraints on the metallicity and age distributions of the stars in the M31 disk. Magnier et al. (1997a) found the age and reddening distributions of several OB associations. Williams & Hodge (2001a) performed an automated search for young open clusters in portions of these complexes, finding them to have a wide range of reddenings and ages. Sarajedini & Van Duyne (2001) found strong evidence for a thick disk population in an HST field in the M31 disk. They found the populations similar to the Galaxy, although the metallicities of the populations were higher. Ferguson & Johnson (2001) analyzed an HST field in the outer disk of M31, finding that it was dominated by an old population with an intermediate metallicity. Williams (2002) studied 27 HST fields in the M31 disk taken from the HST archive, also seeing an intermediate age, potential thick disk component in all fields. In addition, Williams (2002) found that the disk is dominated by an older population high in metallicity, confirming that the current star formation rate of the disk is low compared with 1 Gyr ago.
While these recent HST studies have been essential for understanding the stellar populations of the M31 disk, they were unable to search for large scale star formation patterns in the disk. While the older populations are well mixed and can be used to draw general conclusions about the disk’s early evolution from pointed observations, the young population is still near the location of its formation and is therefore much more structured within the disk. Making sense of this structure in the young stellar populations requires a data set with large angular coverage to probe for propagation of star formation through the disk. Such a study of the young populations in the M31 disk is not easily done with the small field of view of HST because each field only contains a small sample of the youngest stars. Until recently, such a study was not easily done from the ground because of the limited field of view of most high resolution ground-based imagers; however, with newly-developed, multi-CCD, wide-field imagers available on large telescopes, it is now possible to obtain high-resolution, homogeneous data sets covering large fields. This ability has allowed us to compare the stellar populations in different regions of the disk with confidence that our conclusions will not be due to systematic differences within the data set.
In this paper, I use data from the recently conducted Local Group Survey (LGS) Massey et al. (2001) to analyze the stellar populations of several key regions in the M31 disk: OB 102, OB 78 van den Bergh (1964), and the northeastern spiral arm. These regions were chosen as ideal for understanding how star formation progresses and propagates through a complex galactic disk. The large, homogeneous, high-resolution stellar photometry allows the reconstruction of the recent SFHs across these active regions. Results are compared with areas that have had their SFHs examined with HST data in order to look for consistency.
2 Data Acquisition and Reduction
2.1 Photometry
All of the ground-based data used for this project were generously supplied by the Local Group Survey (LGS) collaboration ((Massey et al. (2001)); http://www.lowell.edu/users/massey/lgsurvey) which is acquiring 1” resolution, photometric data with the 8k x 8k Mosaic cameras on the 4m telescopes at KPNO and CTIO, entirely covering ten LG galaxies in U, B, V, R, I, and narrow-band H, [S II] (6717,6731), and [O III] (5007). The LGS is working on providing their own, more rigorous, calibration of these data, leading towards a complete UBVRI catalog of stars. However for the purposes of the present paper I draw upon photometry in the literature for calibration. The modeling effort requires only 10% photometry, which can readily be achieved by the means described here. These data will soon be, but are not yet, public.
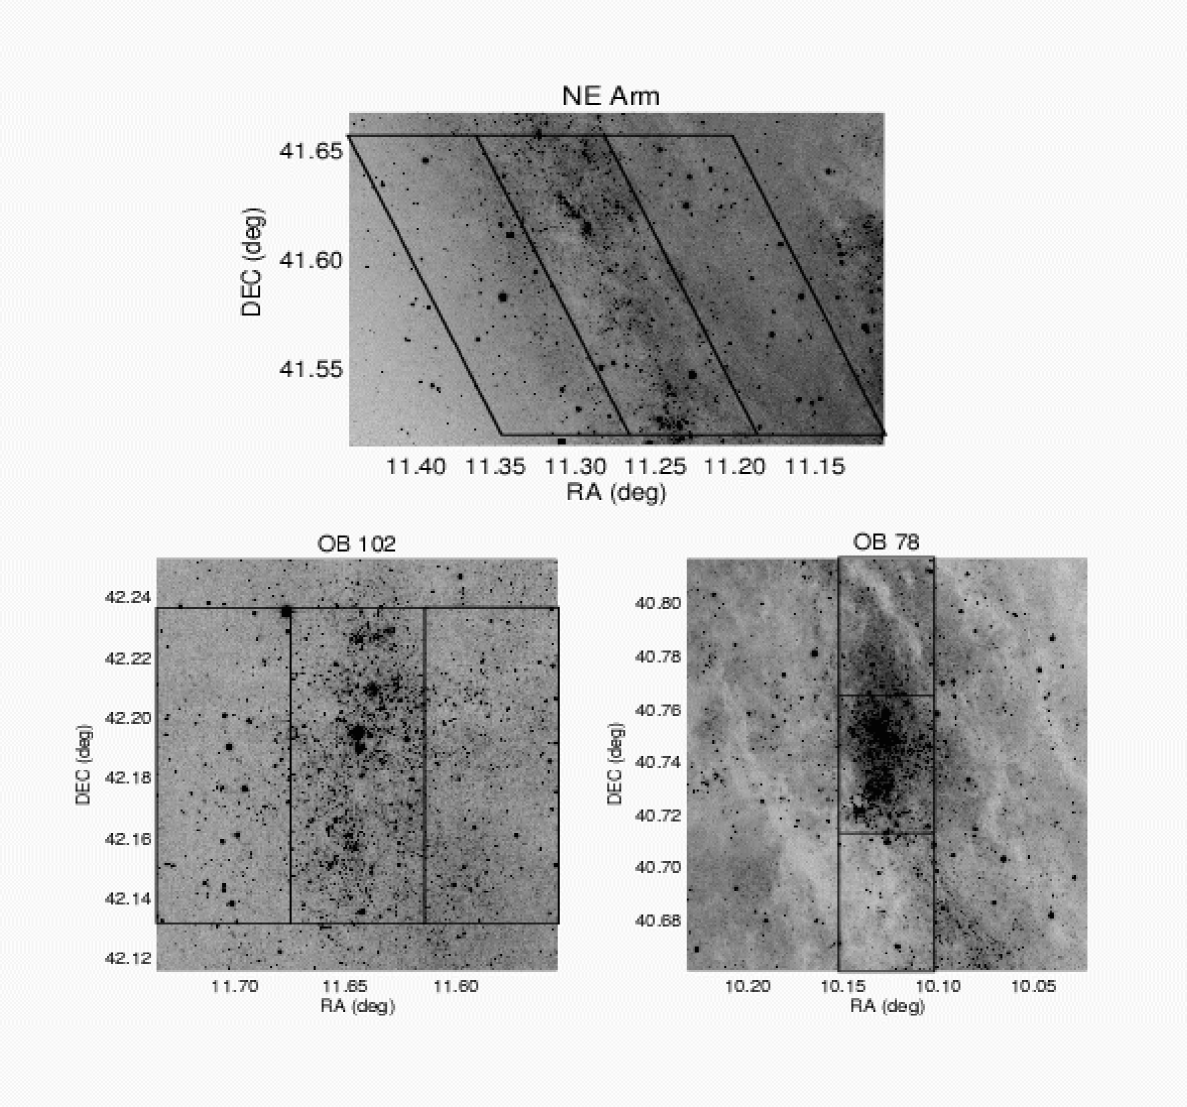
I obtained the data for six Mosaic fields in the M31 disk from the LGS team. These data consisted of 5 dithered frames in B and V for each field. Each dithered frame had been flat-fielded, bias-corrected, and the geometric distortions removed by the LGS team. Fields F1, F2 and F3 cover the northern disk; fields F8, F9 and F10 cover the southern disk. The B and V observations of each of the regions of interest were completed in the same hour. In order to measure the photometry from the images efficiently, the dithered frames for each field were aligned and stacked. Because the B and V observations of each field were completed within minutes of one another, photometry of variable stars in the stacked images is similar to that of a single snapshot of their changing colors and luminosities. The stacked B band images of the regions of interest for this study are marked and labeled in Figure 1.
All of the photometry for this project, including PSF fitting, measurement of instrumental magnitudes and execution of artificial star tests, was done using the automated photometry routines DAOPHOT II and ALLSTAR Stetson et al. (1990). Because the chips of the Mosaic camera are not precisely coplanar, point-spread-function (PSF) fitting was performed on each chip individually. I tested the accuracy of the PSF fitting photometry on the stacked images by running the same routine on a single exposure and comparing the results. Figure 2 shows the results of this comparison for the B and V photometry. The stacking had only a negligible systematic effect on the measured magnitudes. The mean was shifted by only 0.01 mag in B and 0.002 mag in V at the bright end.
The zero point offsets for the photometry were determined statistically, matching stars from the catalogs of Magnier et al. (1992) and Mochejska et al. (2001). Field F2 overlapped with fields F1 and F3, and field F9 overlapped with fields F8 and F10. In cases where there were few stars on which to base the B and V zero points (the outermost fields, F1 and F10, used for the foreground sample), I found duplicate measurements of stars in the overlapping field with a well-sampled zero point, and I set the zero point to match the photometry for these stars. In these cases, I quote the root of the sum of the square error from the original zero point measurement and the square error from the dispersion from the separate measurements. I also corrected each zero point by applying the color terms of the LGS111see http://www.lowell.edu/users/massey/lgsurvey/colorterms.html to the mean B-V color of the calibration stars. This correction factor accounts for the effect of the Mosaic color terms on the zero point measurement. Table 1 provides the final zero points used and the standard deviation along with the number of stars used for the determination for each of the six fields. Although the zero points have fairly large errors associated with them, the large number of stars that have gone into these zero points provide a robust mean. Outliers were removed using Chauvenet’s criterion. In these crowded fields, some fainter stars can be mistakenly matched to bright neighbors. Chauvenet’s criterion was an effective way of removing such mismatches. Most of the dispersion about this mean is most likely due to the older catalogs, which often had less homogeneous data sets.
In order to test the accuracy of the zero points, I found stars measured independently in fields F2 and F3, the fields with the greatest difference in V-band zero point. I corrected these stars with the appropriate zero point and looked at the residuals. These residuals are plotted in Figure 3. The figure shows that the zero point offsets were effective. The independent measurements had rms scatter of 0.041 in B and 0.046 in V at the bright end. Having measured these statistics, I believe that this relative photometry marks one of the most complete and homogeneous set of stellar photometry in the M31 disk to date in B and V.
After obtaining the mean zero points for each field in each color, the photometry of each star was corrected for the color terms of each chip222see http://www.lowell.edu/users/massey/lgsurvey/colorterms.html. These corrections resulted in the final colors and magnitudes used for the analysis. While this photometry is preliminary to the final version that will be measured by the LGS, the experiments described later reveal that it is sufficiently precise for my purposes. I dissected these data in order to examine several key regions of the M31 disk.
In order to determine accurate SFHs from the photometry, it is extremely important to have excellent statistics on the completeness and measurement errors as a function of B-V color and V magnitude. In order to achieve this goal, I ran large numbers of artificial star tests in each region under consideration. Each test had to be run separately because of the large differences in the effects of crowding in different regions of the galaxy. I found that I could obtain accurate statistics from a set of 150,000 artificial stars in each field section. These tests were performed by adding a unique set of 1500 stars to each of a set of 100 copies of the image section in question. Each of these 100 copies were then run through my photometry routine in order to determine completeness and errors. Plots of random subsets of the artificial star results for the three OB 102 field sections are shown in Figure 4. The plots show only 5 percent of the results to make the figure easier to read; these subsets are entirely random and representative of the full set of tests. The errors are mainly random Poisson errors; however, there are some stars with large, negative residuals from crowding. These stars were added too close to a brighter star already in the image, causing an over-estimation of the brightness.
2.2 Foreground Contamination
If confused for massive stars in the M31 disk, bright stars in the Galactic foreground could cause systematic errors in the measurements of recent SFHs. These foreground stars were statistically subtracted from the CMDs of the regions under consideration. A sample of foreground stars was taken from the far corners of the fields with the highest galactocentric distance (F1 and F10). These foreground sampling areas covered 235 arcmin2. The combined CMD of these foreground-dominated areas is shown in Figure 5. The main sequence of the M31 disk at B-V 0 is still visible, but weaker compared to the foreground sequence.
In order to subtract the proper number of foreground contaminants from each analyzed region, I binned the CMD of the field sample. The bin sizes were 0.1 in B-V color and 0.15 in V magnitude. I then scaled the number of stars in each bin by the size of the area of interest and subtracted that number of stars from its counterpart bin in the data from the area of interest. The number of foreground stars in each region proved to be 3 percent of the stars in the region, so that the details of the foreground sample had no significant impact on the results of the analysis.
3 Description of the Star Formation History Analysis Technique
I determined the SFHs of the selected regions using the analysis package MATCH ((Dolphin (1997)), (Dolphin (2000))). This recently developed software uses a technique pioneered by earlier, non-computationally intensive work on stellar populations in other Local Group galaxies (e.g. NGC 6822, Gallart et al. (1996)) in which the CMD of the stars was broken down into bins of color and magnitude. These CMDs are also known as binned Hess Diagrams. Before powerful computing was possible, these bins were chosen to isolate populations of differing ages and metallicities, and based on the relative number of stars in each bin, a rough measurement of the star formation and chemical enrichment histories of the field could be made. MATCH takes this concept to its full potential by using the most recent computing power to create high-resolution Hess Diagrams of rectangular bins of constant size specified by the user.
Once the CMD of the data has been transformed into a Hess diagram, the software uses the stellar evolution models of Girardi et al. (2000) to create a unique Hess diagram for each of a range of stellar ages and metallicities. These model-based diagrams are produced by populating the CMD along the theoretical isochrone of each metallicity and age, assuming a 1 star formation rate and a Salpeter initial mass function (IMF) and taking into account the completeness and photometric errors in each bin of the CMD as measured from the artificial star tests on the real data. The program then finds the linear combination of model-based Hess diagrams which best reproduces the Hess diagram of the observed stars for each of a range of reddening and distance values. Since each model-based diagram was created assuming a 1 star formation rate, the coefficients of this linear combination provide the SFH in units of . Finally, the best fits for each distance and reddening value are weighted by goodness of fit to determine values and errors for the most likely distance and extinction to the field as well as values and errors for the star formation rates and metal abundance spreads during each time period explored. Finally, in order to check the viability of the result, the package can be used to create a synthetic CMD from the stellar evolution models by populating the theoretical isochrones using the assumed IMF along with the derived best fit for the metallicities and star formation rates for each time period, taking into account the best fit distance and reddening values for the field. The artificially generated CMD can then be compared to the observed CMD in order to verify that the statistically determined SFH creates a stellar population similar to the observed population.
I tested this technique for the situation of ground based data of the M31 disk which suffers from differential reddening across and through the disk as well as severe crowding. Artificial star samples similar to the data in star number and photometric accuracy, but with known SFHs, were created. Then the SFHs of these fake star fields were measured and compared to the input SFHs. I performed this experiment on two different synthetic SFHs. The results from the first are shown in Figure 6. This synthetic star sample was created with a low, constant star formation rate until a very recent burst. The metallicity was kept constant at solar abundances, and the reddening was set to . This reddening value was chosen as a random value in the range the analysis had revealed to be typical (). Figures 6a and 6b show the results of applying our analysis technique directly to the synthetic sample. The age distribution is well-recovered, but the chemical evolution is not. This inability of the technique to find the right metallicity distribution has been seen before (see (Williams (2002))), and it is likely due to the insensitivity of the color of the upper main sequence to metallicity. Figures 6c and 6d show the results for the same artificial sample after each star was assigned a random reddening value in the range . Despite the scrambling of the colors and magnitudes from differential reddening, the analysis technique measures the right age distribution, revealing that the measurable problems with the photometry from crowding are more important to take into account than the effects of differential reddening. The same experiment was run for a SFH with two star forming bursts. This age distribution was also accurately recovered, as shown in Figures 7a - 7d.
4 Results: SFHs of Selected Regions
Once convinced that meaningful age distributions could be retrieved from the data, I obtained star samples from interesting areas of the M31 disk to look for recent patterns of star formation around the most active portions of the disk. These areas of interest were chosen because they stand out as large groupings of young stars likely associated with the action of the spiral arms within the disk. The results allow us to draw conclusions about the behavior of the spiral arms in M31 over the past 200 Myr. The distance moduli and mean extinction corrections determined for each region analyzed are given in Table 2. The distance measurements are all the same within the errors, which shows the consistency of our relative photometry. They are all about , which is greater than, but consistent with, that of the Cepheid distance of 24.43 Freedman & Madore (1990). The higher distance would be consistent with some possible blending in their sample, but not as severe as the increase suggested by Mochejska et al. (2000). The measured distances are barely in agreement with the globular cluster surface brightness fluctuation measurement of Ajhar et al. (1996), who found . It is important to note that these distance results do not rule out a greater distance because only a very limited range in the distance parameter was allowed () in order to limit the degenerate effects of distance and reddening. On the other hand, these distance results have errors smaller than the range allowed, and they are in near perfect agreement with those of Stanek & Garnavich (1998), who used the mean brightness of the red clump to derive a distance of . My distance measurements are also nearly identical to that of Holland (1998), who measured the mean distance of the globular cluster population to be by fitting their red giant branches. Finally, my distances are consistent with those seen in Williams (2002), whose similar analysis of HST photometry gave distances between 24.430.060 and 24.5050.042. The mean reddenings range from to , confirming the high amount of differential reddening across and through the disk. OB 78 has the lowest mean reddening of all the sections, suggesting that the dust may have been moved or destroyed by the hot stellar populations in this area.
The results of the SFH analysis for each region are shown using the same four-paneled figure style, shown in Figures 8, 9 and 11 and discussed in sections 4.1 - 4.3. These figures show the observed foreground-subtracted CMDs, the measured SFHs, the best fitting chemical evolution histories, and the best-fitting model CMDs for each field analyzed.
4.1 OB 102
One of the largest OB associations in the northern half of M31 is OB 102. This highly elliptical association follows an outer spiral arm that runs from OB 98 to OB 108. Because of its large size, high H luminosity and proximity to the major axis, OB 102 is an excellent place to look for star formation propagation through the disk. Outside of the identification of the association and detailed analysis of a few of its members mentioned in section 1, little is known about this association. In order to learn about its history, we created three samples of stars from regions equal in area. These areas are outlined in Figure 1. They are 15.8 arcmin2 each. We selected the stars found in these regions in both B and V, and put them through the SFH analysis described above. There were 347, 1626 and 493 stars measured in the eastern region, OB association and western region, respectively. The results for each of the samples are given in Figures 8a - 8c.
The figures show that the data are well-reproduced by this type of analysis. The large numbers of artificial star tests done independently for each region provide accurate statistics for the reproduction of completeness and photometry errors, taking into account that many faint stars may be detected in one band and not another. Unfortunately, the routine is not able to accurately reproduce the full width of the main sequence or the scattered stars to the red of the main sequence. The analysis technique cannot reproduce the effects of differential reddening which broaden the main sequence. In addition, our limited understanding of the evolution of high-mass stars causes problems in precisely reproducing the observed colors and magnitudes of evolved upper main sequence stars.
The chemical evolution appears much like the results of our experimental samples, where the input metallicity was actually constant and solar. This result reveals an important limitation of the analysis technique when applied to the M31 disk: we cannot trust the measured chemical abundance history for stars less than a few hundred Myr in age.
The age distribution of the eastern and western samples are identical; however, OB 102 shows an enhanced star formation rate, not only in the past 10 Myr, but also excess activity back to 100 Myr ago. Here is the first indication from these data that these large associations, and possibly the arms of M31 themselves, have been forming stars at an enhanced rate for the past few hundred Myr. This result is consistent with the results of Williams (2002) that the star formation rate in the arms has been enhanced for the past few hundred Myr; however, an important additional conclusion can be drawn from these wider field data: the most recent activity is indeed higher than the mean of the past few hundred Myr in the most active regions. This most recent activity was difficult to assess with the limited field of view of the HST data. Because the most massive stars are not numerous in M31, obtaining a significant sample requires a large field of view. The smaller field of HST limited the number of the most massive stars in these samples, making it difficult to draw any conclusions about the most recent activity and also making it difficult to compare adjacent regions with very different populations. Using the larger field, we see a very recent increase in activity over a larger scale, as well as the previously observed constant enhanced rate.
4.2 OB 78 (NGC 206)
OB 78 is the largest OB association in the southern half of the M31 disk. This association has long been intriguing because of the low nebular emission surrounding it (e.g. (Massey et al. (1986))). One possible explanation for the smaller amount of nebular emission in OB 78 is that the gas was blown away by massive stellar winds when the stars were first being formed, possibly creating the H I hole observed by Brinks & Bajaja (1986). This hypothesis suggests that star formation has recently ceased due to the exhaustion of the gas supply. If this explanation is correct, then there may be a noticeable difference between the stellar populations of OB 78, where nebular emission is low, and OB 102, where nebular emission is higher.
I performed the SFH analysis on the three regions in and around OB 78 marked in Figure 1. Each region has an area of 6.6 arcmin2. There were 233, 887 and 193 stars measured in the northern region, OB association and southern region, respectively. The results of the SFH analysis are shown in Figures 9a - 9c. The stellar populations of these three regions bare a striking similarity to those of their counterparts surrounding OB 102. A nearly constant low star formation rate is measured for the regions next to the OB association. One data point, at 200 Myr for the region north of OB 78, deviates from this description; however this point is more likely an outlier due to slight errors in the completeness measurements at the faint-end limit of the data. In the case of OB 78, the association itself shows a sharp increase in star formation rate back to 30 Myr ago. Before 30 Myr ago, the rate was comparable to that now observed for the adjacent regions. According to this analysis, OB 102 and OB 78 contain stellar populations with one significant difference: the significant increase in star formation formation in OB 78 began 30 Myr ago while such an increase did not occur in OB 102 until 10 Myr ago. Perhaps this earlier increase in activity in OB 78 cleared a significant amount of the diffuse gas from the region so that less emission is seen from the most recently formed stars. I roughly measured the H luminosities of OB 102 and OB 78 from the data of Winkler & Williams (1995) using circular apertures of radius 50 arcsec for each association. These rough luminosities are and respectively. I show below that OB 78 appears to have more of the youngest stars per unit area than OB 102; however, its H emission is smaller than OB 102 by more than a factor of 2. Such a result is important to understand when applying conversions of H luminosity to star formation rate for distant galaxies; regions with H luminosities varying by more than a factor of 2 may have nearly identical current star formation rates.
I tested the validity of the difference between the populations of OB 102 and OB 78 seen by the SFH analysis by looking for a difference between the luminosity functions of the two regions. The luminosity functions of the two regions were measured by taking a sample of the stars from each region between -0.4 B-V 0.2 and 16 V 23. These samples were binned by 0.2 in B-V color and 0.3 in V magnitude, and each bin was corrected for completeness determined from the artificial star tests and for extinction determined from the MATCH analysis. Finally, the total completeness-corrected number of stars at each V magnitude bin was computed. After adopting a distance modulus to M31 of 24.47 and normalizing each bin to an area of 1 arcmin2, the luminosity functions of the two regions are shown in Figure 10.
The faint ends of the two luminosity functions are different, showing why the analysis routine measured a high star formation rate 200 Myr ago for OB 78. The validity of this difference is difficult to assess because it is strongly dependent upon precise knowledge of the completeness at the detection limit of the data. At the same time, There is a significant difference in the shape of the luminosity functions brightward of . This difference supports the result from the SFH analysis, showing that the age distributions of these populations differ. OB 78 contains more stars between 10 and 30 Myr old, whose progenitors likely blew out much of the diffuse gas in the region. This scenario also explains the low extinction of OB 78, which is consistent with being entirely due to dust in our Galaxy. Apparently, the dust was blown out along with the gas. It appears as though in another 20 Myr OB 102 will have an H luminosity more like that of OB 78.
The results do not show any obvious evidence for the propagation of star formation due to spiral density wave passage suggested by Magnier et al. (1997b) and Williams & Hodge (2001b). One possible signature for a density wave passage would be a significantly larger population of stars with ages of 10-100 Myr on one side of the current density wave location than on the other. Such a signature was seen in the Cepheid age distribution of the southern half of the disk, on a very large size scale Magnier et al. (1997b). The areas near OB 78 and OB 102 show nearly identical stellar populations on either side of the associations. We do not see this signature for spiral wave passage on the scale of our chosen regions. This result does not rule out the conclusions of previous work on the southern half of the disk, where a signature for spiral wave propagation was seen on a much larger size scale. Our study does not rule out the possibility that there is a difference between the populations on either side of the association on larger scales, better probed by the ages of the star clusters and Cepheids in the region. The analysis is hampered on such large size scales by the varying completeness and increased range of extinction in the data. Indeed, the fact that OB 78 shows no signs of enhanced star formation before 30 Myr ago is consistent with the idea that the density wave responsible for this large OB association was previously creating stars in a different region of the disk.
4.3 The Northeast Spiral Arm
The northeast spiral arm of M31 (also known as N4 and N5; (Baade & Gaposchkin (1963))) is the most well-studied region of the M31 disk. The high interest is likely due to the star formation activity in this region which produces strong H emission. The region contains hundreds of discrete nebulae Walterbos & Braun (1992), including hundreds of supernova remnants (e.g. (Braun & Walterbos (1993)), (Magnier et al. (1995)), (Williams et al. (1995))) and H II regions (e.g. (Galarza et al. (1999))). It contains dozens of open clusters ((Hodge (1979)), (Williams & Hodge (2001a))) and OB associations Efremov et al. (1987), and it shows evidence for having been active for the past several hundred Myr Williams (2002). Clearly there is star formation occurring is this well-studied spiral arm. Because it is so active and has such sharp boundaries in the H images, it is a good region to look for patterns of star formation around spiral arms using the SFH analysis technique. I performed SFH measurements on three regions associated with this arm. These regions are shown in Figure 1: one to the east of the arm, one on the arm, and one to the west of the arm. The regions each cover an area of 27.8 arcmin2. There were 345, 1350 and 304 stars measured in the eastern region, arm and western region, respectively. The results from each of these regions are shown in Figures 11a - 11c.
Again, the results show that the arm has been more active than the surroundings for at least 100 Myr, and until very recently, the star formation rate was constant. This constant rate over the past 100 Myr is a nice confirmation of the conclusion of Williams (2002) from HST data in this region of the galaxy. Those deeper, but smaller, fields revealed that the star formation rate has been fairly constant and high in the spiral arms over the past few hundred Myr. These larger fields now reveal a factor of 3 rise in the star formation rate in the past several Myr. This jump was not possible to measure conclusively with the smaller fields because the sampling of the youngest stars was inadequate over such small areas. Once again, there is no evidence that the star formation has propagated from either side of the current position of the arm. Neither side of the arm shows a significantly higher number of young stars than the other, which would be an indication of the recent passage of a density wave. The surrounding regions have had low, relatively constant star formation for the past 100 Myr.
5 Conclusions and Future Work
I have measured preliminary B and V photometry for resolved stars in the LGS data set for the M31 disk. From this photometry I have determined SFHs for three of the largest active regions of the disk and the areas surrounding those regions in order to understand the difference in nebular emission from the northern and southern halves of the disk, to look for consistency with previous analyses of HST data in overlapping regions and to look for patterns of star formation in these regions of the disk. In particular, I looked for evidence of star formation propagation through the disk near the spiral arms.
None of the three regions selected showed unambiguous evidence for star formation propagation, such as an over-abundance of stars with ages 10-100 Myr on one side of the currently active regions. On the other hand, the regions all showed common characteristics. OB 78, OB 102, and the northeast spiral arm all show a recent increase in activity from the past average. This increase began earlier in OB 78 than in the other two regions, which may explain the weaker nebular emission measured in this region. The areas adjacent to each region show no effects of being so close to star formation activity. Their evolution appears to have been unaffected over the past 100 Myr that these areas have had higher star formation rates. Similar results were seen in Williams (2002). This evidence leads to the conclusion that active regions have fairly long lifetimes: perhaps up to several hundred Myr. During this lifetime, they appear to have factor of 2 enhancements in activity on shorter timescales. These enhancements will likely increase the nebular emission if the diffuse gas has not been blown away by previous star formation; however, if the high star formation rate continues for more than 20 Myr, much of the diffuse gas may be blown away from the regions and the nebular emission can decrease even though the star formation rate is the same.
The LGS data set Massey et al. (2001) can be applied to many more scientific questions, particularly once the data are fully calibrated. When SFHs of each region in the M31 disk are measured individually, it is possible to overcome the complications imposed by differential reddening: an effect intensified in M31 by its high inclination angle. Current plans include systematically determining the recent SFH as a function of position over the entire disk to about 4 arcminute resolution, as well as learning more about the older stellar populations through an analysis of the I band data, which contains at least five times the number of stars recovered in the B band. If the crowding issues prove to be manageable, SFHs for the older populations of the disk as a function of position will be measured from the large sample.
5.1 Acknowledgments
I thank the LGS team for making this project possible by supplying the data. I especially thank Phil Massey for his work in observing, preparing and providing the images for the photometric measurements. Finally, I thank Paul Hodge for mentoring the project.
References
- Ajhar et al. (1996) Ajhar, E. A., Grillmair, C. J., Lauer, T. R., Baum, W. A., Faber, S. M., Holtzman, J. A., Lynds, C. R., & O’Neil, J., E. J. 1996, AJ, 111, 1110
- Baade (1944) Baade, W. 1944, ApJ, 100, 137
- Baade & Gaposchkin (1963) Baade, W., & Gaposchkin, C. H. P. 1963, Evolution of stars and galaxies. (Cambridge, Harvard University Press, 1963.)
- Braun & Walterbos (1993) Braun, R., & Walterbos, R. A. M. 1993, A&AS, 98, 327
- Brinks & Bajaja (1986) Brinks, E., & Bajaja, E. 1986, A&A, 169, 14
- Dolphin (1997) Dolphin, A. 1997, New Astronomy, 2, 397
- Dolphin (2000) Dolphin, A. E. 2000, ApJ, 531, 804
- Efremov et al. (1987) Efremov, I. N., Ivanov, G. R., & Nikolov, N. S. 1987, Ap&SS, 135, 119
- Ferguson & Johnson (2001) Ferguson, A. M. N., & Johnson, R. A. 2001, ApJ, 559, L13
- Freedman & Madore (1990) Freedman, W. L., & Madore, B. F. 1990, ApJ, 365, 186
- Galarza et al. (1999) Galarza, V. C., Walterbos, R. . M., & Braun, R. 1999, AJ, 118, 2775
- Gallart et al. (1996) Gallart, C., Aparicio, A., Bertelli, G., & Chiosi, C. 1996, AJ, 112, 1950
- Girardi et al. (2000) Girardi, L., Bressan, A., Bertelli, G., & Chiosi, C. 2000, A&AS, 141, 371
- Haiman et al. (1994) Haiman, Z., et al. 1994, A&A, 290, 371
- Hodge & Lee (1988) Hodge, P., & Lee, M. G. 1988, ApJ, 329, 651
- Hodge (1979) Hodge, P. W. 1979, AJ, 84, 744
- Holland (1998) Holland, S. 1998, AJ, 115, 1916
- Hubble (1929) Hubble, E. P. 1929, ApJ, 69, 103
- Humphreys (1979) Humphreys, R. M. 1979, ApJ, 234, 854
- Ivanov & Kynchev (1985) Ivanov, G. R., & Kynchev, P. Z. 1985, Soviet Astronomy Letters, 11, 310
- Kodaira et al. (1999) Kodaira, K., Vansevicius, V., Tamura, M., & Miyazaki, S. 1999, ApJ, 519, 153
- Magnier et al. (1997a) Magnier, E. A., Hodge, P., Battinelli, P., Lewin, W. H. G., & van Paradijs, J. 1997a, MNRAS, 292, 490
- Magnier et al. (1992) Magnier, E. A., Lewin, W. H. G., van Paradijs, J., Hasinger, G., Jain, A., Pietsch, W., & Truemper, J. 1992, A&AS, 96, 379
- Magnier et al. (1997b) Magnier, E. A., Prins, S., Augusteijn, T., van Paradijs, J., & Lewin, W. H. G. 1997b, A&A, 326, 442
- Magnier et al. (1995) Magnier, E. A., Prins, S., van Paradijs, J., Lewin, W. H. G., Supper, R., Hasinger, G., Pietsch, W., & Truemper, J. 1995, A&AS, 114, 215
- Massey et al. (1986) Massey, P., Armandroff, T. E., & Conti, P. S. 1986, AJ, 92, 1303
- Massey et al. (2001) Massey, P., Hodge, P. W., Holmes, S., Jacoby, G., King, N. L., Olsen, K., Saha, A., & Smith, C. 2001, in American Astronomical Society Meeting, Vol. 199, 13005
- Mochejska et al. (2001) Mochejska, B. J., Kaluzny, J., Stanek, K. Z., & Sasselov, D. D. 2001, AJ, 122, 1383
- Mochejska et al. (2000) Mochejska, B. J., Macri, L. M., Sasselov, D. D., & Stanek, K. Z. 2000, AJ, 120, 810
- Sarajedini & Van Duyne (2001) Sarajedini, A., & Van Duyne, J. 2001, AJ, 122, 2444
- Stanek & Garnavich (1998) Stanek, K. Z., & Garnavich, P. M. 1998, ApJ, 503, L131
- Stetson et al. (1990) Stetson, P. B., Davis, L. E., & Crabtree, D. R. 1990, in ASP Conf. Ser. 8: CCDs in astronomy, 289
- van den Bergh (1964) van den Bergh, S. 1964, ApJS, 9, 65
- Walterbos & Braun (1992) Walterbos, R. A. M., & Braun, R. 1992, A&AS, 92, 625
- Williams (2002) Williams, B. F. 2002, MNRAS, 331, 293
- Williams & Hodge (2001a) Williams, B. F., & Hodge, P. W. 2001a, ApJ, 559, 851
- Williams & Hodge (2001b) Williams, B. F., & Hodge, P. W. 2001b, ApJ, 548, 190
- Williams et al. (1995) Williams, B. F., Schmitt, M. D., & Winkler, P. F. 1995, in American Astronomical Society Meeting, Vol. 27, 883
- Winkler & Williams (1995) Winkler, P. F., & Williams, B. F. 1995, in American Astronomical Society Meeting, Vol. 186, 4910
| Field | B Zero | B Stars | V Zero | V Stars |
|---|---|---|---|---|
| F1 | 4.080.18 | 1773 | 4.360.18 | 1651 |
| F2 | 3.950.16 | 488 | 3.800.18 | 488 |
| F3 | 4.120.14 | 1294 | 4.390.12 | 3004 |
| F8 | 4.060.22 | 366 | 4.370.20 | 379 |
| F9 | 3.940.26 | 155 | 4.320.18 | 148 |
| F10 | 3.910.26 | 119 | 4.340.18 | 68 |
| Region | m-M | |
|---|---|---|
| East of OB 102 | 24.4500.041 | 0.6110.099 |
| OB 102 | 24.4750.025 | 0.5000.082 |
| West of OB 102 | 24.4750.025 | 0.5000.082 |
| East of NE Arm | 24.4600.037 | 0.8700.110 |
| NE Arm | 24.4670.033 | 0.5670.115 |
| West of NE Arm | 24.4750.025 | 0.4500.112 |
| North of OB 78 | 24.4750.025 | 0.4500.171 |
| OB 78 | 24.4750.025 | 0.3000.082 |
| South of OB 78 | 24.4780.025 | 0.3780.131 |