Narrow band imaging in [OIII] and H to search for ICPNe in the Virgo cluster111Based on observations collected at Subaru telescope, which is operated by the National Astronomical Observatory of Japan, at the UT4 of the VLT, which is operated by the European Southern Observatory, and at the TNG, which is operated by I.N.A.F.
Abstract
We have identified intracluster planetary nebulae in a Virgo cluster core field by imaging with the Subaru Suprime-Cam through two narrow band filters centered at the redshifted wavelengths of the [OIII] Å and the H Å lines; broad-band images in V and R were acquired to check for emission in the adjacent continuum. Emission line objects in Virgo are then selected from the two-color diagram ([OIII] – H) vs. ([OIII] – (V+R)), which is calibrated using PNe in M84 (Jacoby et al. 1990). Using both [OIII] and H allows us to distinguish bona-fide planetary nebulae from high redshift emission-line galaxies at the bright end of the [OIII] luminosity function. Spectroscopic observations of a subsample of these objects were made at the TNG and at the VLT, in a region around M84 and in an intracluster field respectively. The observations confirm the efficiency of the combined [OIII]+H imaging to identify true PNe. We also obtained the first spectrum of an intracluster PN which shows the [OIII] doublet with S/N and its H emission. From the results based on the spectroscopic follow-up, we derive a lower limit to the fraction of the Virgo cluster light contributed by the intracluster stars at the surveyed position in the cluster core: it amounts to 10%.
1 Introduction
The diffuse stellar light in galaxy clusters is now a well established component of the intracluster (IC) medium (Zwicky 1951; see also review by Feldmeier 2002) and the study of its properties is a potentially powerful method for probing the formation and evolution of cluster of galaxies (Dressler 1984; Miller 1983; Merrit 1984; Moore et al. 1996; Moore, Quills & Bower 2000).
Studies based on direct measurements of the IC surface brightness
are difficult because the typical surface brightness of the IC light
is less than 1% of the sky brightness,
and it is hard to disentangle the light associated with
the halo of the cD from the light associated with the cluster
(Bernstein et al. 1995).
A new approach came with the discovery of intracluster planetary
nebulae (ICPNe) candidates in the Virgo and Fornax clusters
based on spectroscopy (Arnaboldi et al. 1996)
and imaging in the light of the Å line of [OIII]
(Theuns & Warren 1997; Ciardullo et al. 1998;
Feldmeier, Ciardullo, & Jacoby 1998; Feldmeier 2002; Arnaboldi et
al. 2002).
Although this technique is effective for detecting ICPNe, it also detects
other objects with emission lines in this narrow band. The first
spectroscopic follow-up (Kudritzki et al. 2000; Freeman et al. 2000)
carried out on a subsample of these objects showed contamination by
i) stars misclassified as emission line objects because of
photometric errors, and
ii) high redshift line-emitters, like [OII] starbursts at
, and Ly objects at .
An automatic selection procedure implemented by Arnaboldi et
al. (2002) showed that contamination from continuum objects can be
solved via acquisition of an adequate off-band image, while reducing
contamination from high-z line-emitters is a more serious matter.
Arnaboldi et al. (2002) gave an estimate of the
contamination from high-z line-emitters, of up to 25% within the
first magnitude from the bright cut-off of the PN luminosity function
(PNLF) in the IC fields, based on the spectroscopically confirmed
sample of ICPNe from Freeman et al. (2000).
Narrow band imaging survey of emission line objects carried out
on empty fields (Ciardullo et al. 2002a) provides independent
estimates of the fraction of high redshift interlopers.
Using the same identification techniques as in the Feldmeier et al. (1998)
ICPN sample, Ciardullo and collaborators determined
that emission-line emitters at high redshift contribute about
20% of the ICPN selected sample in the Virgo cluster.
Because of their large equivalent width (Å),
the high redshift interlopers are most probably Ly emitters
at redshift 3.13.
In principle, the high redshift line emitters
can be statistically subtracted from a larger sample of ICPNe candidates in
Virgo/Fornax, when one wishes to determine the luminous density
of the diffuse IC light. In this approach one needs to assume that
the Ly emitters are not highly clustered.
This assumption has been questioned by Steidel et al. (2000) and Porciani &
Giavalisco (2002): the former have claimed that the L emitters at
are the same population as the Ly-break galaxies at the same
redshift, while the latter have shown that the Ly-break population
has a high clustering signal.
Recently Ouchi et al. (2002) detected a clear clustering
signal for Ly emitters at . This suggests that
Ly emitters are definitely clustered at , since
they are already clustered at .
To overcome these difficulties, we can use the two strongest emission lines from PNe, i.e. [OIII] Å and H, carry out narrow band imaging with two filters centred on each of the two lines respectively, require detection in both narrow band images and absence of continuum emission to identify true Virgo ICPNe. The H flux from a PN is typically 3 to 5 times weaker than the corresponding flux in the [OIII] line, so we need a large telescope with wide field capabilities in order to carry out such an imaging survey for the ICPNe in Virgo. The Subaru 8.2-meter telescope and the Suprime-Cam mosaic camera (Miyazaki et al. 2002) represent the best suited instrument to perform such a survey of ICPNe in Virgo and trace the cluster 3D shape via the bright cut-off of the PN luminosity function.
As discussed by Ciardullo et al. (2002b), imaging in [OIII] and H in late-type galaxies is also efficient in discriminating PN from HII regions: for candidate objects in the first magnitude of the PNLF we can identify compact HII regions, if such objects are present, as those with [OIII] to H[NII] line ratios less than 2. By adopting this strategy, and by surveying large areas in the Virgo cluster, we may be able to find compact intracluster HII region.
Here we present a broad band (V and R bands) and narrow band imaging surveys of a Virgo IC field at , (J2000), which were carried out during the guaranteed time of the Suprime Camera commissioning phase, at the Subaru telescope in March and April 2001, and the subsequent spectroscopic follow-up in April 2002 at the TNG 4 meter telescope with DOLORES, and at UT4 of the VLT 8 meter telescope with FORS2. The ICPN candidates from this imaging survey are presented in Okamura et al. (2002). In Section 2 we describe our observations, data reduction and the color properties of the selected candidates. In Section 3 we describe the catalog extraction and discuss the selection procedure, via simulations of PNe and single line emitters in the blank areas of our surveyed field. In Section 4 we calibrate our selection criteria on the published PNe sample of M84 and M86 from Jacoby et al. (1990: JCF90), and summarize the properties of our best sample of IC objects in Virgo. In Section 5 we validate our selection criteria via the spectroscopic follow-up, and describe an unambiguous spectroscopic confirmation of an intracluster PN. In Section 6 we discuss our estimate on the IC diffuse light and conclusions are presented in Section 7.
2 Imaging, data reduction and photometric candidates
In March-April 2001 a field in the Virgo cluster at 12:25:47.0, 12:43:58, just south of M84-M86, was observed during the commissioning of the Suprime-Cam 10k8k mosaic camera, at the prime focus of the Subaru 8.2-meter telescope. The field of the array covers an area of arcmin of sky, with a pixel size of .
The field was imaged through two narrow band and two
broad band filters. The two narrow band filters have (Å, Å) and (Å, Å)
for the f/1.86 beam at the Subaru prime focus, see Appendix,
corresponding to the [OIII] and H emissions at the
redshift of the Virgo cluster. The filter widths were chosen to match
the velocity dispersion of galaxies in the Virgo cluster. For the two
broad band filters, we used standard V and R filters.
The observations log is summarized in Table 1.
The broad band data were calibrated using Landolt stars.
The adopted V band calibration for the true extinction
corrected V magnitude is ).
No spectrophotometric standard stars were observed during the commissioning
runs, nonetheless the narrow band images can be calibrated in AB
magnitudes by setting the colors of the continuum objects equal to
zero, as is done in the LALA survey (Rhoads et al. 2000).
Furthermore, our narrow band [OIII] instrumental
magnitudes can be calibrated in magnitudes, as
introduced by Jacoby (1989), by comparison with published
PN photometry.
Removal of instrumental signature, astrometric solution and
image co-addition were done with a data reduction package developed by the
the Suprime-Cam team.
Once the final images in the four filters are normalized to 1 sec exposure, the instrumental magnitudes define colors which depend on the objects’ nature. For example, the colors of the blue stars with a flat spectrum are found to be at ([OIII] - V) = 4.0, with a similar value for the (H - R) color; these colors are mostly due to the filter width ratio. In the instrumental ([OIII] - H) color, blue stars are at ([OIII] - H) = 1; while foreground galaxies and red stars are found at ([OIII] - H. In what follows we will use a combined (V+R) continuum image, following the procedure adopted by Steidel et al. (2000).
3 Catalog extraction and validation of the selection procedure
As a first step, we established the limiting magnitudes for the different
images following the simulation procedure described in Arnaboldi et al. (2002).
We define the limiting magnitude of our final co-added mosaic image
as the magnitude at which half of the input sample is retrieved from the
simulated image, see Arnaboldi et al. (2002) for further details.
The detection limit is the magnitude at which the fraction of
retrieved point-like objects becomes zero.
The limiting instrumental magnitudes are:
, ,
The detection limits are:
, , .
The images in our dataset, (V+R), [OIII] and H, are
complete (which corresponds to detections with )
down to these instrumental
magnitudes:
, ,
As we will discuss further in Section 4, the ratio for our V
and R images is lower than ideal. Even if we use the combined
(V+R) image for our continuum band, our detection and color
selection process is limited more by the ratio of the
off-band (V+R) image than by the on-band [OIII] image.
At what instrumental magnitude do we expect Virgo PNe to come in? Arnaboldi et al. (2002) carried out their ICPN survey with a narrow band [OIII] filter width very similar to ours, and their brightest ICPN candidates are detected at in [OIII]. Using the calibration of the V band, and accounting for a color, we would expect the brightest ICPNe to come in at , 1.8 magnitude brighter than our .
From the ([OIII] – H) vs. [OIII] color-magnitude diagrams of all the sources in the field, we would expect PNe to have , i.e. about 0.75 magnitude bluer than the blue continuum stars. This estimate comes from the observed distribution of the [OIII] to (H+[NII]) line ratios for [OIII]-selected planetary nebulae (Ciardullo et al. 2002b) in late-type galaxies . Because a luminous PN’s [OIII] to H ratio varies between 3 and 5, we can expect PNe, and ICPNe, to scatter to bluer colors with respect to flat blue continuum stars. We note that excitation and metallicity may allow ratios as small as 1.
Given the limiting magnitude of the [OIII]
image, we see that the long exposure H image is
not deep enough to ensure detection of the H line
for all the ICPNe that we may be able to detect in the [OIII] image.
In the first magnitude bin of the observed PNLF, from
to ,
the depth of the H image would allow us to detect
both high and low excitation PN222A high excitation
PN with would have , a low excitation PN would have . These
H magnitudes are both brighter than the completeness
limit of our H image;
when , we loose the high excitation PN.
For an easily detectable ICPN candidate with (which has ), the expected (H) for a
low excitation PN is 1.25, which is now at the limiting magnitude
of the H image.
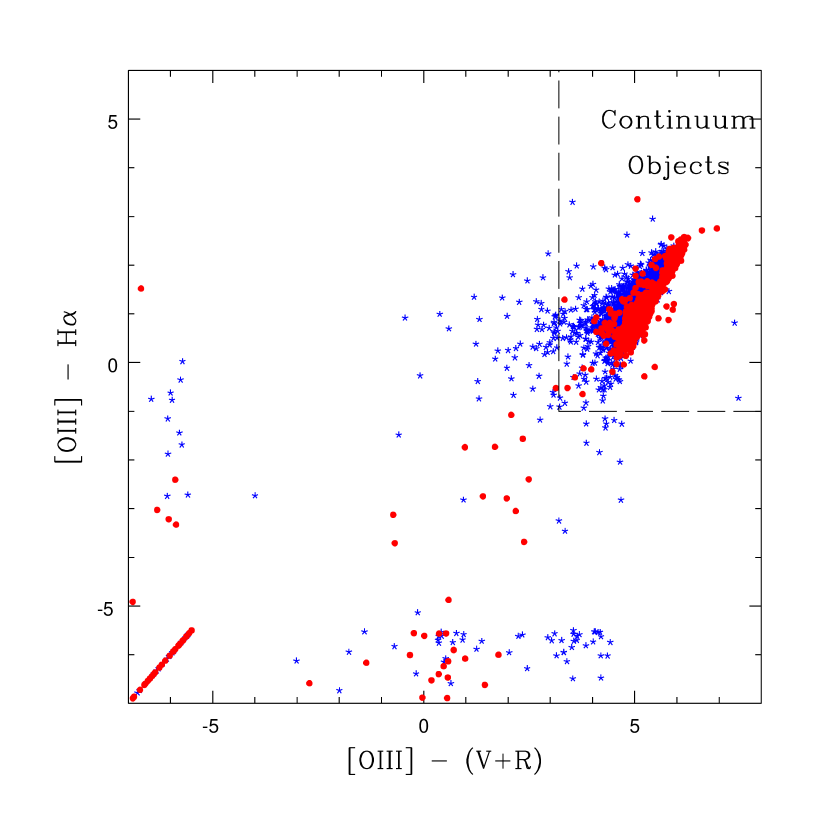
From the calibration of the ([OIII] - V) color, the distribution of
bright sources in the field (see Figure1), and the simulations of
continuum point-like sources on the (V+R) image, the combined
continuum image is
deep enough for the detection of a continuum object, with a
flat spectrum, and .
Spurious detections may arise for those objects with a continuum
increasing towards the blue, as they may mimic a detection in both narrow
band images (with lower flux in the H image), but have no
detected (V+R) flux because of the higher noise in the continuum sky
background. We can reduce this problem by selecting only the
brighter [OIII] sources in our analysis.
We shall discuss this point and the relative threshold in
Section 4.
We use SExtractor (Bertin & Arnouts 1996) to carry out the detection and photometry. Ideally, the [OIII], H and (V+R) images would be so deep that we could make reliable detections or very significant non-detections in these bands for all potential candidates. We could then detect PNe and eliminate single-lined high redshift emission-line galaxies and spurious continuum objects from our sample of candidates, using independent detections and photometry for the [OIII], H and off-band (V+R) images. In reality, because the [OIII] image is the deepest, the adopted strategy is to use the [OIII] image to perform the source detection, and then compute aperture magnitudes for the H and (V+R) images, at the location of the [OIII]-detected objects.
Selection procedure – As a first step, we defined the criterion to select unresolved (point-like) objects from the more extended objects. We used the SExtractor mag(AUTO) against flux-radius diagram for all the [OIII]-detected sources. Point-like sources are found in a locus of points parallel to the mag(AUTO) axis, with a flux-radius value given by the FWHM of the seeing disk. From this plot, and the average seeing measured on the [OIII] image, , we classified as point-like sources those [OIII] detection with a flux-radius value less than 3.6 pixels; sources with larger flux-radius are taken to be extended.
We use the two-color diagram ([OIII] - H) vs. ([OIII] - (V+R)) to select our emission-line objects. The two-color diagram for the bright sources () is shown in Figure 1. These bright objects are almost entirely stars and galaxies. The blue and red stars plus the foreground galaxies (the extended objects) populate a well defined area of the two-color plot, centered at ([OIII] - (V+R)) = 5, and ([OIII] - H) between -1.0 and 3.0.
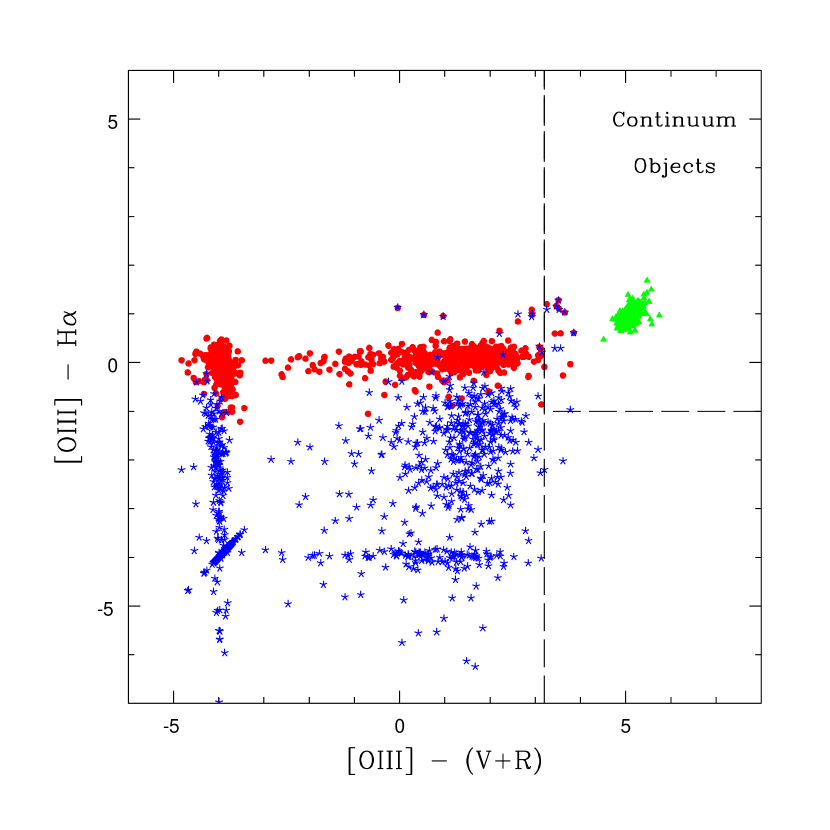
We now establish some ad hoc selection rules for PNe, adopted for this specific set of images and the detection/photometry process described above. Simulated populations of PNe, single-lined emitters and continuum sources are constructed in the two-color diagram, and are used to outline the regions inhabited by the different kinds of objects. The two bright galaxies M86 (NGC 4406, km s-1) and M84 (NGC 4374, km s-1) appear in our Subaru field. These have been independently surveyed for PNe, by JCF90, and we can evaluate our selection criteria against the photometry for the JCF90 samples. The selection criteria will then be further validated with spectroscopy of the candidate objects.
Simulated population – A population of PNe was represented by a set of point-like objects with , a ([OIII]–H) = 0 color333This corresponds to an [OIII] to +[NII] ratio equal 3. We include [NII] in the evaluation of the line fluxes because of the H filter width, which includes the flux in these lines too., and no flux in (V+R). These were added to the modeled background image for the [OIII] and the H images (see Arnaboldi et al. 2002 for additional details). Photometry was then performed on these simulated objects, using SExtractor, to study their distribution in the two-color plane. Sources were detected on the simulated [OIII] image, and aperture photometry was performed at the corresponding position on the H and (V+R) image.
Figure 2 shows the simulated distribution of a PNe population with
(i.e. 0.8 mag brighter than the limiting magnitude).
The measured (V+R) flux is due entirely to noise in the (V+R) image, so
the PNe are distributed in two regions: (i) for some of them,
the measured “flux” in (V+R) is negative, and these objects are arbitrarily
assigned a value of ; (ii) for others, the measured
(V+R) flux is positive but they lie fainter than detection limit
, i.e. their . Therefore
most of our points are situated in the region , i.e. .
Errors in the photometry, halos of bright objects, and CCD defects may cause
the measured to be brighter than , so a few points may
scatter into the region .
We then simulated a population of single-lined emitters, i.e. with and no emission in H and (V+R). A point-like population is added to the simulated [OIII] background image only, and aperture photometry is carried out at the position of the detected [OIII] sources on the H and (V+R) background. For these objects, the measured fluxes in H and in (V+R) are due entirely to noise in the H and (V+R) images. When a negative flux is measured, and are set arbitrarily to 5, so objects detected in [OIII], but with negative fluxes in both H and (V+R), lie on a diagonal line in the lower left corner of the two-color diagram. These single line emitters lie in a different area from the PNe (see Figure 2), although a few may scatter into the region of the PNe and so contaminate our sample of candidates. With a deeper image in H, matching the limiting magnitude of the [OIII] image, these objects would not be a significant contaminant, as we would require detection both in [OIII] and H.
Finally we added to the real image a simulated point-like population of continuum emitters with [OIII] = 1.8, and a flat continuum spectrum which is given by and , ( i.e. ), and retrieved their position in the two-color diagram. The simulated objects cluster together at the loci where the observed continuum objects lie, see Figure 2.
From the two-color diagram of bright sources, and the simulated populations of PNe and single line emitters, we can identify the following selection criteria for objects which are detected with SExtractor on the [OIII] image and with measured aperture photometry on the other images, at the position of the [OIII] source:
-
1.
for stars and continuum extended objects we expect to detect fluxes in [OIII], H and (V+R), which translate in following color selections, based on our simulations: and ;
-
2.
for single-lined emitters, either Ly + Continuum or [OII] + Continuum, we expect them to be detected in [OIII] and have positive fluxes in (V+R), but to be very weak or have negative flux in H, i.e. and . The color would depend on the equivalent width of the line emission, and therefore be on both side of ;
-
3.
for single-lined emitters with no continuum, i.e. Ly emitters at and [OII] emitters at , we expect them to be bright in [OIII], very weak in both H and (V+R). Objects that appear as , , and are single line emitters, but because of noise some get scattered up to ;
-
4.
for ICPNe candidates: , and 444 Here the range for the color accounts for the errors from SExtractor photometry in [OIII] and H, which cause an intrinsic flux ratio from 3 to 5 to be scattered to larger values.. Given that for our H image, , a high excitation PN with may not have a measured H flux, and therefore it is scattered in the region of the two-color diagram where single lined emitters are found.
From the simulations of a single-line-emitting point-like population, some contaminants may still be scattered by noise in the regions selected for PNe. As an additional test, we visually inspect all the selected candidates for the presence of an H source at the position of the detected [OIII] source, and only these objects will be considered as PN candidates in Virgo.
4 Comparison with the M86, M84 sample of JCF90
The bright galaxies M86 and M84, which were surveyed for PNe by JCF90, appear on our images. The PNe sample of JCF90 were compared with our catalogs of detected sources from the deep Subaru images.
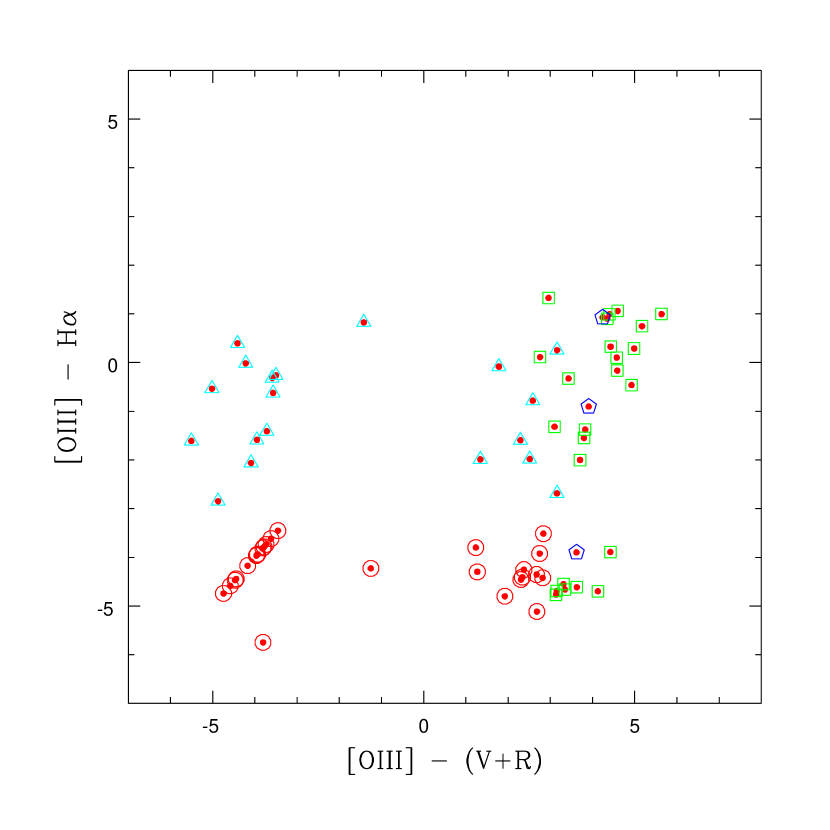
For M84, JCF90 reported 102 PNe candidates: 74 were matched with sources on the Subaru images, within a separation of . Of the remaining 28 objects, 18 were at JCF90 magnitudes fainter than (i.e. fainter than our [OIII] completeness limit - see below) and 11 were not detected on the Subaru [OIII] image. See Figure 3 for the two-color plot for the matched objects. Of the 74 objects,
-
•
19 are detected in [OIII] and have a positive H flux, with (most likely true PNe), they comply to the criterion n. 4 ;
-
•
26 are detected only in [OIII], have a very faint continuum (), and have a negative measured H flux; they appear to comply to criterion n. 3. These sources are most likely high excitation PNe, given that we are looking within the light distribution of M84, where PNe dominate over the high-z background of line emitters. A very small fraction may still be Ly emitters though, with no detected continuum and a large equivalent width.
-
•
26 objects have , i.e. significant flux in the combined (V+R) image. 12 of these fall in the area of the two-color plot where flat-spectrum continuum objects are found; 7 are single-line emitters according to criterion n. 2, with negative flux in H555 We would expect objects with detected (V+R), from the Ly population in the field at redshift from Steidel et al. (2000).; 6 objects are most likely continuum objects, because of their significant flux in (V+R), with a steep continuum towards the blue as indicated by their measured ( while continuum objects with flat spectrum have ). In this set of sources, we unexpectedly find a candidate HII region in the M84 field, at . Its measured instrumental magnitudes are , all above the completeness magnitude limits in their bands, and therefore it is unlikely that this source comes from a peak in the noise. We may search for compact HII regions in the IC field too, according to the following selection criteria: , , and these candidates may have some flux in the continuum, i.e. .
-
•
The remaining three objects are scattered in the region where the continuum objects are found, but their : these are the three faintest () objects in the matched sample, and may be their colors are most affected by photometric errors. See Figure 3 for the two-color plot for the M84 matched sources.
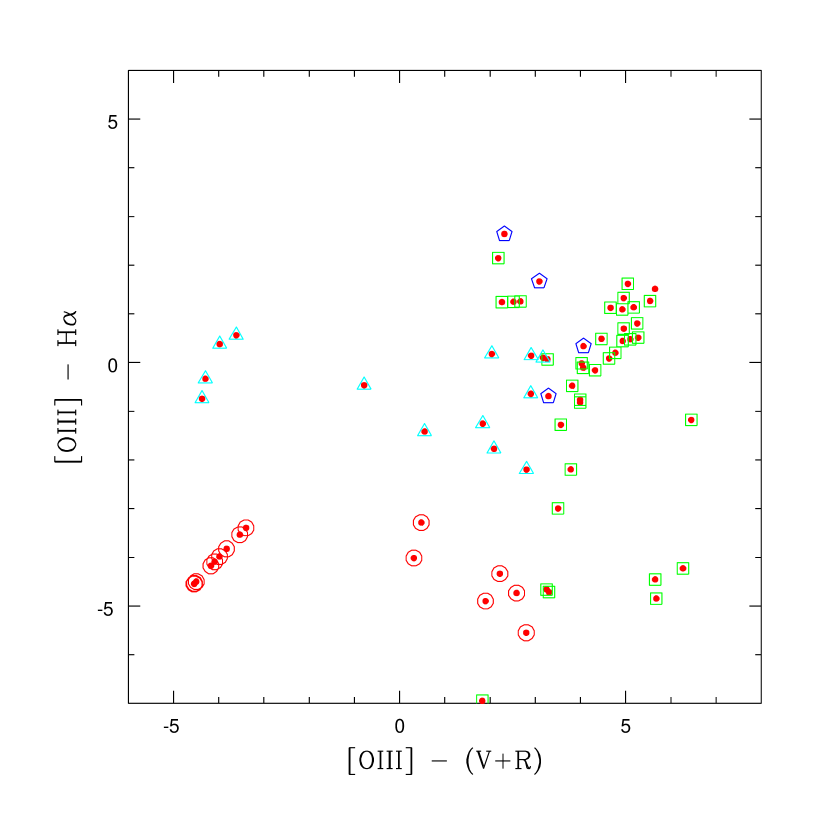
For M86, the galaxy falls partially out of the frame so some candidates from JCF90 are outside our frame (roughly 1/3 of the total sample). For some of the M86 objects, our photometry may not be as accurate as for the M84 field, because of filter edge effects and partial mosaic coverage. JCF90 reported 140 candidates in total, and 69 were matched with Subaru sources. The faintest PN in the matched sample has m(5007) = 27.94666There are only 9 PNe candidates in the JCF90 list whose m(5007) is fainter than 27.94., from JCF90 photometry. 5 objects of the matched list fall in bad areas of either the or the (V+R) image, and their colors are then spurious. Of the remaining 64 objects,
-
•
13 are detected in [OIII] and have a positive H flux, with (most likely true PNe);
-
•
15 are detected only in [OIII], with a negative measured H flux, and have (probable high excitation PNe);
-
•
32 objects have . 21 of these fall in the area of the two-color plot where flat-spectrum continuum objects are found; 2 are single-line emitters, according to criterion n. 2, with no significant positive flux in H; 4 objects are most likely continuum objects with steep blue continuum, because their measured . We also have 5 candidates for compact HII regions: these objects fall in the same region of the two-color diagram as the possible HII region in M84, with ;
-
•
2 possible compact HII regions with .
-
•
The remaining two objects are scattered in the region where the continuum objects are found, but their .
See Figure 4 for the two-color plot for the M86 matched sources.
Calibration of the Subaru [OIII] fluxes – From the selected most likely [OIII] line emitters in M84 and M86, we can calibrate the Subaru [OIII] fluxes. We derive the calibration
where is the extinction corrected instrumental magnitude, and is the standard [OIII] magnitude. The standard deviation of the difference for the matched sample is on a sample of 74 objects. The [OIII] magnitude corresponds to , which is similar to the magnitude targeted so far for spectroscopic follow-up.
We checked the consistency of our [OIII] calibration by computing the narrow band fluxes in the AB magnitude system, and tested them against the calibration of the V band image. We computed the conversion from to magnitude: for Å, Å, . Therefore
Following the same strategy as in the LALA survey (Rhoads et al. 2000), we use the V-band zero point from §2 and set for blue stars. The inferred value for is then 24.00, with a difference from the value obtained via the comparison with the JCF90 sample. Given the relative imprecision of this estimate, the agreement with the estimate via the M84/M86 PNe is acceptable.
The results from the matched Subaru-JCF90 sample indicated that about 38% of the JCF90 candidates, which were identified via blinking and visual identifications, have a positive detected continuum flux in our combined (V+R) image (25%), or are not present in the deep Subaru [OIII] image (13%). This fraction (38%) of likely spurious candidates is consistent with the confirmed fraction of true line emitters (about 60%) found in spectroscopic follow-up of similarly selected intra-cluster candidates at the 2dF (Freeman et al. 2000 ), and also in the multi-object spectroscopy of PNe in individual galaxies, e.g. NGC 1399 and NGC 1316 (Arnaboldi et al. 1994, Arnaboldi et al. 1998). However, we note that problems in positioning fibers and slit masks could also reduce the detection rate of candidate objects in the spectroscopic programs.
4.1 ICPN Candidates
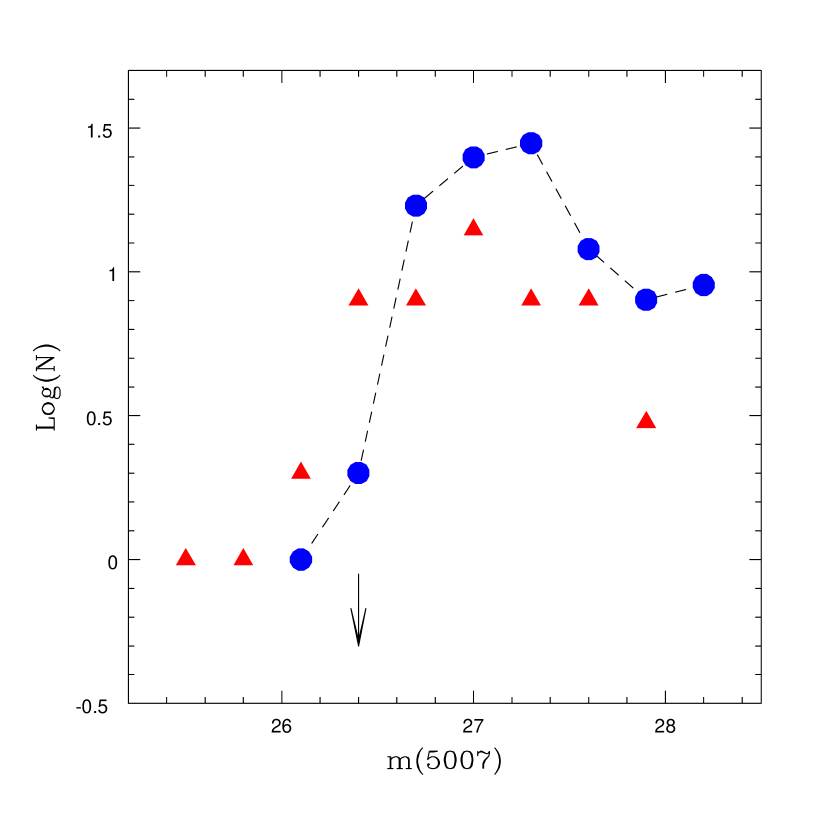
From the two-color plot of the whole Subaru field, we constructed a catalog of likely PNe from objects with [OIII] detections, measured H flux, and . In the area of M84, additional 8 likely PNe were found. We then masked regions centered on M86, M84 and NGC 4388 with areas of , to avoid the PNe candidates belonging to these galaxies. Down to our completeness magnitude limit of , we selected the most likely ICPNe candidates according to criterion n. 4, and then inspected their images visually: this gave a sample of 32 ICPN candidates.
Based on our photometry and flux calibration777Our
[OIII] photometry is slightly biased from the contribution of the
[OIII] emission at 4958.9 Å which enters in our filter bandpass
for radial velocities km s-1. This may cause a
maximal brightening of the PNLF of mag, see discussion
in Arnaboldi et al. (2002).,
in the M84 whole PN sample of 53 objects (45 matched with JCF90 + 8
Subaru PNe), there are 6 PNe (5 from JCF90 + 1 from Subaru PNe)
which have
, see Figure 5 where we plot the M84 PNLF
from ours and the JCF90 sample.
PNe which are found in Virgo galaxies and are brighter than
the cutoff magnitude were
considered over-luminous objects by JCF90, and,
they must be ICPN candidates on the near side of the
cluster, according to Ciardullo et al. (1998).
Including the over luminous objects in the Virgo galaxies,
we then have a sample of 38 ICPN candidates, associated with the diffuse
light in the Subaru field. The complete list of candidates, their
coordinates, magnitudes, and their relative position
on the [OIII] narrow band mosaic image are available in
Okamura et al. (2002).
We also inspected the IC field for possible compact HII regions, which we can identify from our two-color diagram. In the IC region, we identified 3 candidate compact HII regions, one with and 2 with .
5 Spectroscopic Observations
5.1 The M84 field
The spectroscopic observing run in the M84 field,
centred at ,
was carried out at the 4 meter Telescopio Nazionale Galileo (TNG)
on the nights of the 13-15 of April 2002, with the DOLORES
spectrograph, in multi-object spectroscopy.
The DOLORES spectrograph is equipped with a Loral thinned
CCD, with a scale of pix-1, which yields a total
field of view of arcmin. Spectroscopic observations were
carried out with the medium resolution blue grism,
with a dispersion of Å pix-1 and a wavelength
coverage Å.
A mask was produced in blind offset mode, from the selected
object catalog, based on the mosaic astrometry.
Field stars from the Subaru narrow band [OIII] image were used
for mask positioning and alignment.
Slitlets were positioned on the objects listed in Table 2.
These objects are:
i) all brighter than , which is roughly the
faintest magnitude at which [OIII] line emission from a PN at
the distance of Virgo can be detected spectroscopically with a 4 meter
telescope (Freeman et al. 2000),
ii) have , and
.
Unfortunately, weather conditions were poor during the run, with a
seeing of . The total
exposure time for this mask configuration was .
Data reduction was carried out using standard tasks in IRAF, for
standard CCD data reduction (bias subtraction and flat fielding),
and extraction, wavelength calibration, plus sky subtraction
of two-dimensional longslit spectra. Because of bad weather
condition, flux calibrations were not acquired.
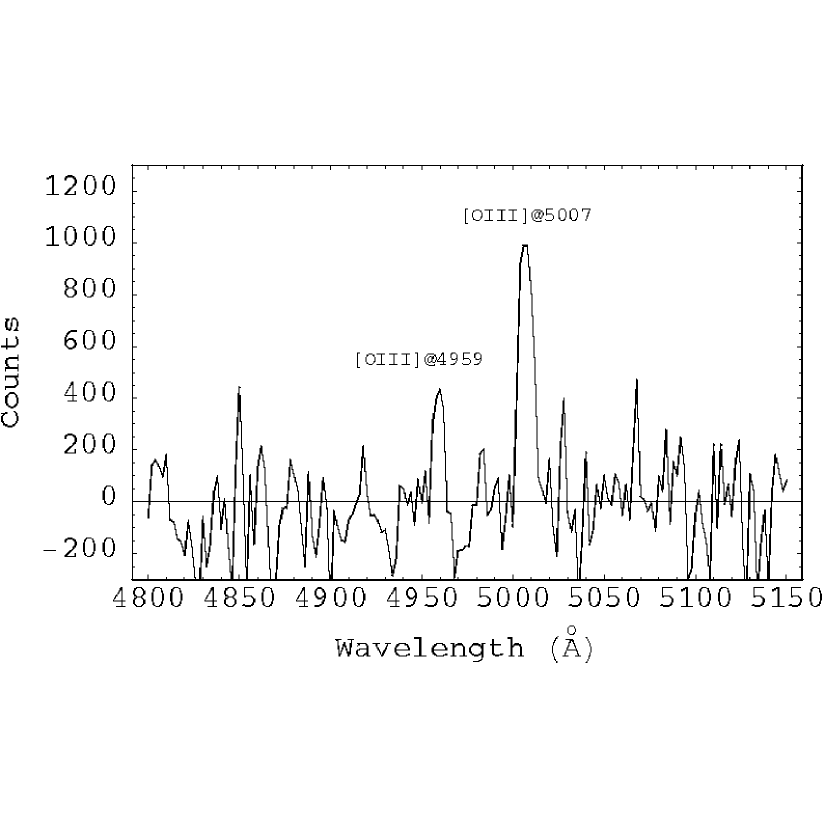
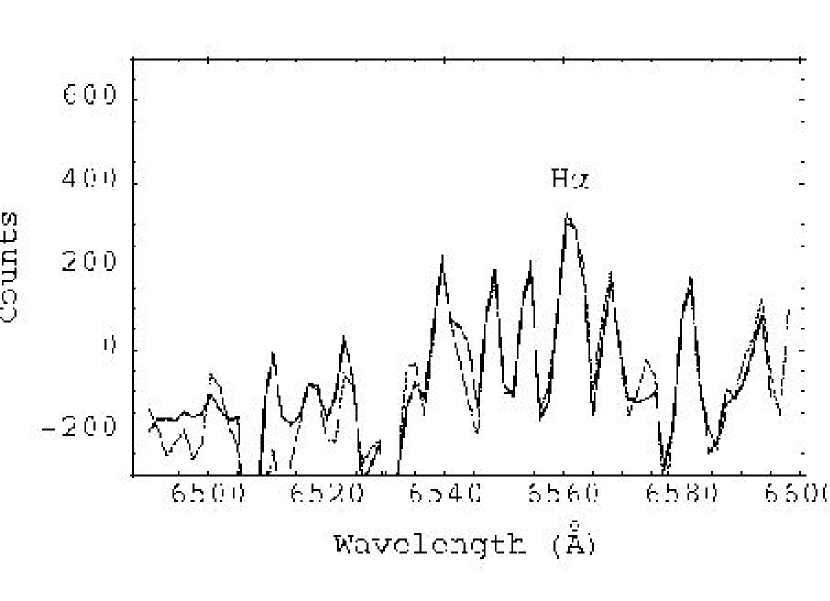
TNG spectroscopic confirmations – Of the 10 objects which were allocated a slit, objects n. 103 and n.105 were not detected: given their bright [OIII] flux we believe that non-detection may be due to astrometric problems and/or incorrect positioning of the objects in the slits. The other 8 objects are all probable PNe with narrow line emission in the wavelength range of the [OIII] filter, except for 1016 which shows an asymmetric broad line. To confirm the identification as PNe, we shifted each of the 7 likely PNe spectra so that the emission line is at the 5007Å rest wavelength, normalized each spectrum to the same total flux in the line, and then summed the spectra. The summed spectrum is shown in Figure 6, in which both the 4959Å and 5007Å [OIII] lines are clearly visible. Furthermore, the H emission is also visible in the red part of the summed spectrum of the sharp line emitters (therefore true PNe), although with a worse S/N ratio than the [OIII] emission at 4959 Å. This confirms the nature of these objects as PNe. Their mean velocity (1174 km s-1) and velocity dispersion (317 km s-1) are consistent with most or all being members of M84.
The spectroscopic observations of the PNe in the outer region of M84 confirms the validity of using both H and [OIII] imaging to detect PNe near the bright cutoff of the PNLF. The analysis of the dynamics of the outer regions of M84 will be discussed elsewhere.
5.2 Virgo IC field
The spectroscopic follow-up of ICPN candidates in the intracluster field centred at was carried out as a backup program at UT4 of the VLT at Paranal, on the nights of the 13-14 of April 2002, with FORS2, in MOS mode. The FORS2 field of view covers an area of arcmin in standard resolution.
Our selected targets were each assigned a MOS slitlet (in MOS mode, up to 19 movable slitlets can be allocated within the field). Observations were carried out with GRISM-150I and the order separation filter GG435+81, giving a wavelength coverage of Å and a dispersion of Å pix-1. The angular scale across the dispersion is arcsec pix-1. The nights were clear but not photometric. The mean seeing was better than 1.0 arcsec despite strong northerly winds. Because the observations were done in blind offset mode, the slitlet width was chosen to be arcsec. Slitlets were positioned on the three objects listed in Table 3. Three stars in the field were selected for pointing checks, and two stars were used to obtain the correct mask position and alignment, via the acquisition of their “through slit” image. The total exposure time was . Spectrophotometric standard stars were observed at the beginning and end of the nights, but the conditions made the flux calibration uncertain.
Selected objects in the IC field – According to the selection criteria discussed in Section 3, IC1 is a likely compact HII region: it is bright in [OIII] (), H (), and also in (V+R) . IC2 and IC3 are ICPN candidates; they are brighter than , and have , and . Note that from Figure 2 we may still have some contaminant Ly emitters in our best sample, because both 1) our off-band image and 2) the H image are not deep enough. The H image of the field is shown in Figure 7.
VLT spectroscopic confirmations –
We were able for the first time to acquire a spectrum of a single ICPN
with enough S/N to show both of the [OIII] lines clearly. The
spectrum of this object (IC2) is shown in Figure 8a. The
observed flux ratio of the two [OIII] lines is 3.1, and the
[OIII]/(H + [NII]) is 4.6, as expected for a high excitation
PN.
Object IC1 is indeed a compact HII region: its spectrum, in the
wavelength region Å, and the physical properties
will be discussed in detail in Gerhard et al. (2002).
IC3 turned out to be a single line emitter, probably
a Ly object at z=3.13, see Figure 8b.
A very weak continuum is visible in the VLT deep spectrum,
so this object appears similar to some of the blue
continuum contaminants discussed earlier.
6 Fraction of diffuse light in Virgo cluster core
Our goal is to estimate the fraction of light from intracluster stars in the Virgo cluster core. We first estimate the total intracluster stellar luminosity associated with our ICPNe by computing the number of planetary nebulae per unit luminosity within 1.0 mag of the bright cut off of the [OIII] PNLF, using the PNe and background light of M84 with our sample888This approach is not ideal, because the estimated values depend on the integrated B-V color of the underlying population: see Hui et al. (1993) and reference therein.
The M84 data are particularly relevant in our discussion as the galaxy is well inside our Subaru field. We can use its PN population to evaluate the specific frequency parameter (i.e. the number of PNe per unit luminosity in the first 1.0 mag of the [OIII] PN luminosity function), as selected according to our criteria.
In the region of M84 with , we detected 45 PNe in M84 ( 40 from JCF90 + 5 TNG confirmed PNe from Subaru sample) within mag of the PNLF cutoff at . Adopting for this galaxy, the total blue light from the region beyond arcsec is , which leads to
The 36 ICPN candidates999IC3 and Object n. 103, both in our ICPN sample, were not confirmed as such in the spectroscopic follow-up in our Subaru field imply a total associated luminosity of . The area surveyed by the Subaru field is 0.196 deg2 and the associated luminous density of the intracluster medium is then LB,⊙ arcmin-2 or pc-2. This corresponds to a surface brightness of mag arcsec-2. Some fraction of our 36 ICPN candidates may still turn out to be high redshift emitters. For this relatively bright sample, selected from [OIII] and H observations, the fraction of high redshift objects is probably less than the 25% found by Arnaboldi et al. (2002), based on Freeman et al. (2000) spectroscopic follow-up, for an [OIII]-selected sample. In order to derive a lower limit on the contribution of the diffuse light, we will assume that 75% of our 36 ICPN candidates are indeed ICPNe, reducing the inferred surface brightness of the diffuse light in our field to mag arcsec-2, and the total associated luminosity to .
We now need to compare this with the luminous contribution from the
Virgo galaxies. What is the most appropriate estimate to compare with
the diffuse stellar density ? We distinguish two extremes:
A) if the IC stellar population is related to the local density of
galaxies, then we should compare its luminous contribution to that of
the galaxies in the field. The three galaxies M86, M84 and NGC 4388
dominate the galaxy light in our field, and contribute a total light of
(total magnitudes from NED).
Therefore in this field the percentage of diffuse light is at least
10% of the light from the cluster galaxies.
B) If the IC stellar population is a larger-scale phenomenon, as it
would be if it arises from galaxy harassment, then we should compare
its surface brightness with the smoothed-out surface brightness of
galaxies (derived from the large-scale distribution of galaxy light in
the cluster) at the radius of our field. Binggeli et al. (1987) fit a
King model to the luminosity-weighted number counts of galaxies in the
Virgo cluster, and derive a (distance independent) central surface
brightness of Mpc-2 and a core radius
degrees for the cluster. Our field is within of
their adopted center. The smoothed-out surface brightness of galaxies
in our field is then mag arcsec-2 and the diffuse
light (with mag arcsec-2) contributes about 40%
of the total stellar light (galaxies + diffuse).
For a detailed discussion of the lower limit on the baryonic fraction
in the Virgo cluster core see Okamura et al. (2002).
7 Conclusion
We have used H and [OIII] narrow band images from the Suprime-Cam prime focus camera of the 8.2 meter Subaru telescope to distinguish bona-fide planetary nebulae from high redshift emission line galaxies at the bright end of the [OIII] luminosity function. The selection criteria were derived from the two-color diagram, ([OIII] – H) vs. ([OIII] – (V+R)): simulated populations of PNe, single-lined emitters and continuum sources are constructed in the two-color diagram, and are used to outline the regions inhabited by the different kinds of objects. These criteria were then calibrated against i) previously discovered PNe in the galaxies M84 and M86 by Jacoby et al. (1990), and ii) subsequent spectroscopic follow up.
The spectroscopic follow-up of a subsample in the M84 field was carried out at the TNG, with the DOLORES spectrograph. 8 objects were confirmed as line-emitters; the summed spectrum of the 7 sharp-line emitters shows the [OIII] and the H emission, in addition to the PN strongest [OIII] emission. The broad line emitter is most likely a Ly at redshift 3.13.
The spectroscopic follow-up of a subsample in the IC field was carried at UT4 of the VLT, with FORS2. These observations gave us the first unambiguous confirmation of the presence of an ICPN. A high S/N spectrum for candidate IC2 was obtained at the VLT which clearly shows the presence of both the [OIII] and Å lines, and the H emission.
Based on these criteria, we have identified a sample of 36 ICPNe candidates in the effective survey area of deg2, in the Virgo core. This would correspond to a surface brightness of mag arcsec-2 for the underlying diffuse intracluster stellar population. With some allowance for residual contamination of our sample by high redshift emitters, we derive lower limits to the fractional contribution of the diffuse intracluster light between 10% and 40% of the total light (galaxies plus diffuse light), depending on the assumptions about the nature of the intracluster stellar population. If it is associated with the harassment process, then the 40% limit is more appropriate. These estimates neglect substructure of the diffuse medium on scales larger than about degrees. We cannot refine these limits until more is known about the structure of the diffuse intracluster stellar medium. This is the longterm goal of our program.
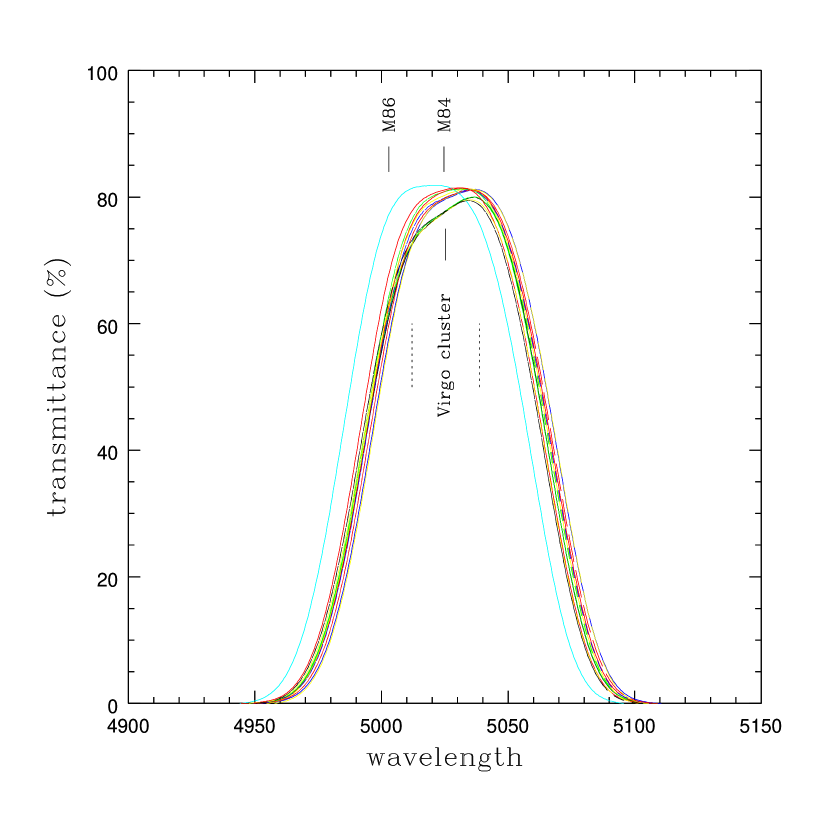
Appendix A Converging beam correction to the filter transmission curve
The converging beam from any telescopes will alter the transmission properties of an interference filter. If the f-ratio of the telescope is slower than about f/8, the effects can generally be ignored. However the Subaru/Suprime camera is in a very fast f-ratio (1.86) and the filter transmission curve can be affected by it. We provide the filter characteristics which were measured by T.Hayashino, H.Tamura, and Y.Matsuda in a converging beam with the same f-ratio as the Subaru prime focus at 13 different positions almost uniformly located over the effective surface of the filter. The beam size on the filter surface, 30mm in diameter, is also the same as that at the Subaru prime focus (Hayashino et al. 2003). Figure 9 shows the filter transmission curves at the 13 positions. One curve shifted toward short wavelengths is for the very central position.
References
- Arnaboldi (94) Arnaboldi, M. et al., 1994, ESO Messenger, 76, 40
- Arnaboldi (96) Arnaboldi, M. et al., 1996, ApJ, 472, 145
- Arnaboldi (98) Arnaboldi, M. et al., 1998, ApJ, 507, 759
- (4) Arnaboldi, M. et al., 2002, AJ, 123, 760
- Bernstein et al. (1995) Bernstein, G.M. et al., 1995, AJ, 110, 1507
- Bertin & Arnouts (1996) Bertin, E. & Arnouts, S. 1996, A&AS, 117, 3993
- Bingelli et al. (1987) Bingelli, B., Tammann, G.A., & Sandage, A. 1987, AJ, 94, 251
- Ciardullo et al. (1998) Ciardullo, R. et al., 1998, ApJ, 492, 62
- (9) Ciardullo, R. et al., 2002a, ApJ, 566, 784
- (10) Ciardullo, R. et al., 2002b, ApJ, in press (astroph/0206177)
- Dressler (1984) Dressler, A. 1984, ARA&A, 22, 185
- Dopita et al. (1992) Dopita, M.A., Jacoby, G.H., & Vassiliadis, E. 1992, ApJ, 389, 27
- Feldmeier et al. (1998) Feldmeier, J.J., Ciardullo, R. & Jacoby, G.H. 1998, ApJ, 503, 1091998,
- Feldmeier (2002) Feldmeier, J.J., 2002, IAU Symp. 209, Planetary Nebulae, (astroph/0201452)
- Freeman et al. (2000) Freeman, K.C., et al., 2000, ASP Conf. Series 197, Dynamics of Galaxies: from the early universe to the present, ed. F. Combes, G.A. Mamon, & V. Chamandaris ( San Francisco ASP), 389
- Hui et al. (1993) Hui, X., Ford, H.C., Ciardullo, R., & Jacoby, G.H. 1993, ApJ, 414, 463
- Gerhard et al. (2002) Gerhard, O.E., et al., 2002, ApJL, in press
- Hayashino, T. et al. (2003) Hayashino, T. et al. 2003, Publ. National Astron. Obs., submitted
- JCF (90) Jacoby, G.H., Ciardullo, R., & Ford, H.C. 1990, ApJ, 356, 332 (JCF90)
- J (89) Jacoby, G.H. 1989, ApJ, 339, 39
- Kudritzki et al. (2000) Kudritzki, R.P. et al., 2000, ApJ, 536, 19
- Merritt (1984) Merritt, D. 1984, ApJ, 276, 26
- Miller (1983) Miller, G.E. 1983, ApJ, 268, 495
- Miyazaki et al. (2002) Miyazaki, S. et al., 2002, PASJ, in press
- Moore et al. (1996) Moore, B. et al., 1996, Nature, 379, 613
- Moore et al. (2000) Moore, B., Quillis, V., & Bower, R. 2000, ASP Conf. Ser. 197, Dynamics of Galaxies: from the early universe to the present, ed. F. Combes, G.A. Mamon, & V. Chamandaris ( San Francisco ASP), 363
- Okamura et al. (2002) Okamura, S. et al., 2002, PASJ, in press (25 Dec. issue)
- Ouchi et al. (2002) Ouchi, M. et al., 2002, ApJ, in press (astro-ph/0202204)
- Porciani & Giavalisco, (2002) Porciani, C., & Giavalisco, M. 2002, ApJ, 565, 24
- Rhoads et al. (2000) Rhoads, J.E. et al., 2000, ApJ, 545, L85
- Steidel et al. (2000) Steidel, C.C. et al., 2002, ApJ, 532, 170
- Theuns & Warren (1997) Theuns, T, & Warren, S. 1997, MNRAS, 284, L11
- Zwicky (1951) Zwicky, F. 1951, PASP, 63, 61


| Band | Exposure (sec) | seeing | Date | |
|---|---|---|---|---|
| 900 | (3003) | 0.85-1.00 | 24 Mar., 2001 | |
| 720 | (2403) | 0.75-0.98 | 24 Mar., 2001 | |
| [OIII] | 3600 | (12003) | 0.65-0.68 | 23 Apr., 2001 |
| H | 8728 | (1200+328) | 0.62-0.70 | 24 Apr., 2001 |
| (12006) | 0.62-0.68 | 25 Apr., 2001 | ||
| IDENT | RA(J2000) | DEC(J2000) | vrad | ||
|---|---|---|---|---|---|
| 10311Object n.103 has m(5007) = -1.7 + 26.3 = 24.6, so it is a ICPN candidate | 12:24:53.835 | 12:52:25.12 | -1.6967 | ||
| 105 | 12:25:04.765 | 12:54:29.81 | 0.1287 | ||
| 106 | 12:24:52.962 | 12:49:25.40 | 0.1441 | 5018.2 | 671.061 |
| 107 | 12:25:03.916 | 12:55:25.50 | 0.2314 | 5023.6 | 991.612 |
| 109 | 12:25:08.259 | 12:54:37.99 | 0.2318 | 5025.3 | 1096.46 |
| 1010 | 12:25:07.450 | 12:51:02.98 | 0.3990 | 5034.2 | 1629.72 |
| 1011 | 12:24:55.613 | 12:53:10.00 | 0.4181 | 5031.0 | 1438.0 |
| 101322Objects n.1013 and n.1017 are in common with JCF90 | 12:24:54.59 | 12:52:39.89 | 0.4601 | 5029.1 | 1324.151 |
| 1016 | 12:25:01.915 | 12:49:48.22 | 0.5054 | 5026.8 | |
| 101722Objects n.1013 and n.1017 are in common with JCF90 | 12:25:12.776 | 12:53:34.69 | 0.5787 | 5024.8 | 1066.51 |
| IDENT | RA | DEC | ||
|---|---|---|---|---|
| IC1 | 12:25:43.11 | 12:43:06.58 | -0.62 | 5051.0 |
| IC2 | 12:25:35.86 | 12:44:52.09 | 0.34 | 5027.6 |
| IC3 | 12:25:20.61 | 12:44:45.44 | 0.41 | 5029.1 |