11email: ebelsole@cea.fr
11email: jsauvageot@cea.fr 22institutetext: School of Physics and Astronomy, University of Birmingham. Edgbaston, Birmingham B15 2TT.
22email: tjp@star.sr.bham.ac.uk 33institutetext: Observatoire de la Côte d’Azur, B.P. 4229, F-06304 Nice Cedex 4, France.
33email: bourdin@obs-nice.fr
The detection of diffuse emission in HCG 16 with XMM-Newton
We report results obtained from analysis of the XMM-Newton observation of the compact group of galaxies HCG 16. It is a peculiar system composed of 7 spirals, 6 of which are active, and its nature as a bound system has been much debated. The EPIC camera observations give new insights into the X-ray parameters describing the physical status of the group. We detect diffuse X-ray emission with a rather elliptical morphology which extends to at least a radius of 135 kpc from the group centre. The spectrum within this region is well modelled by a thermal plasma with a temperature of 0.49 0.17 keV, and a non-zero metallicity. We measure a bolometric X-ray luminosity of 9.61040 erg s-1which may be only a small fraction of the total luminosity because of the limit in spatial detection arising from the high background level. Despite its low temperature and luminosity, HCG 16 obeys the relation obtained for brighter galaxy groups even if it lies in a very extreme position. The properties of the diffuse emission confirm the bound nature of HCG 16 even if the gas trapped in the potential well may not yet be virialized. This reopens the debate about the real nature of spiral-dominated galaxy groups, and on their role in a more general cosmological context.
Key Words.:
galaxies clusters – HCG16 – X-ray:galaxies clusters – X-rays:general1 Introduction
Small groups of galaxies are the most common configurations of aggregated systems in the Universe (Tully 1987 and references therein) and they continue to be the subject of intense study. Despite much attention in the last decade, there is continued debate as to whether these systems are genuinely gravitationally bound (Hickson & Rood 1988) or if they are occasional alignments along the line of sight belonging to more extended systems (Mamon 1986), clusters (Walke & Mamon 1989), or cosmological filaments (Hernquist et al. 1995). In particular the interest in compact groups of galaxies, of which the most widely studied catalogue was compiled by Hickson (1982), revealed a series of peculiarities as compared to galaxies in clusters or to isolated galaxies of the same type (see Hickson 1997 and Mulchaey 2000 for reviews).
Galaxy groups have been observed in the X-ray since the advent of the Einstein satellite. In fact, the detection of hot gas trapped in the group potential well represents strong proof of the bound nature of these systems.
Several works based on ROSAT/PSPC and ASCA data revealed a variety of morphological and dynamical behaviour in galaxy groups (Pildis et al 1995; Saracco & Ciliegi 1995,; Ponman et al. 1996 (hereafter PBEB), Heldson & Ponman 2000b, Mulchaey & Zabludoff 1998).
More than 50% of the 32 ROSAT/PSPC-observed compact galaxy groups (pointed observations) analysed by PBEB exhibit diffuse X-ray emission with temperatures lower than 1.5 keV: the authors found that correcting for the selection effects, the fraction of HCGs with (bolometric) erg s-1 was 75%. This high fraction ruled out the hypothesis that groups are aligned configurations within cosmological filaments.
Galaxy groups show flatter surface brightness profiles and steeper “luminosity-temperature” () and “velocity dispersion-temperature” () relations compared to clusters. This behaviour becomes even more noticeable for very-low temperature (kT 1 keV) systems (Helsdon & Ponman 2000a; Mulchaey 2000, Xue & Wu 2000) where the departures from the self-similar scaling laws traced for galaxy clusters have been explained by models of pre-heating of the gas before it falls into the group (Cavaliere, Menci & Tozzi 1997; Ponman et al. 1999; Balogh, Babul & Patton 1999; Dos Santos & Doré 2002).
These low temperature systems are puzzling for other reasons. Whereas it is well established that a gravitationally bound intergalactic medium is a common property of spiral-poor groups, the results are still controversial for groups composed of more than 50% of spiral galaxies (Pildis et al 1995; Saracco & Ciliegi 1995; Mulchaey et al. 1996), which accounts for the majority of groups.
A rare opportunity to investigate these questions is presented by an extreme example of a very nearby (z = 0.013) compact group: the Hickson Compact Group 16 (hereafter HCG 16). This group is peculiar because it is composed of 7 galaxies (4 originally detected by Hickson (1982), with 3 more added in a circle of 15′ by Riberio et al. (1996) on the basis of radial velocity measurements), of which all are spiral and 6 of the 7 are active. It is one of the densest groups in the Hickson catalogue, with a mean velocity dispersion of 100 km s-1 and a median projected galaxy-galaxy separation of 88 kpc (Hickson et al. 1992)111throughout this paper we assume = 50 km s-1 Mpc-1; is the Hubble constant in units of 50 km s-1 Mpc-1.
Bachall et al. (1984) observed HCG 16 with Einstein, determining an X-ray luminosity of 21) 1041 erg s-1, but with the spatial resolution of the instrument the authors were unable to separate the emission of the galaxies from a more diffuse emission.
Using the ROSAT/PSPC, HCG 16 was later studied by Saracco & Ciliegi (1995), who suggested that the X-ray emission was mainly due to the galaxies. However PBEB and Dos Santos & Mamon (1999, hereafter DSM99), analysing the same ROSAT/PSPC data set, found diffuse X-ray emission far away (200 kpc) from the galaxies and with a temperature of the order of 0.3 keV, which makes HCG 16 the coolest compact group yet detected.
The detailed spatial analysis of DSM99 ruled out the possibility that the hot gas is virialized. They further suggested that the contribution to the gas enrichment from galactic winds could be an important test to understand the dynamics and evolutionary history of this group.
In this work, we present a detailed analysis of the XMM-Newton observation of the HCG 16, focusing on detection of the hot X-ray gas (we do not discuss the galaxy emission, see Turner et al. 2001a). At the redshift of the group, 1′ is equivalent to 22.5 kpc.
2 Observations and data reduction
2.1 Observations
The XMM/EPIC (2 EMOS and 1 EPN camera - Turner et al. 2001b, Holland et al. 1996, Strüder et al. 2001) first light observation was a 65 ks exposure of HCG 16. This consisted of two separate exposures (only 1 for EPN) for which each camera was turned on individually (there was no standard mode). Information on the roll angle is not available for these very early data, but we were able to superimpose the two MOS camera image obtained in raw data, and no evident roll angle variation is observable. The observation log is listed in Table 1.
| EMOS 1 | EMOS 2 | EPN | |
| exposure 1 (s) | 55203 | 48302 | 32399 |
| comments | 50% flare rejection | CCDs 2 & 5 noisy | many bright pixels |
| 50% flare rejection | 40% flare rejection | ||
| exposure 2 (s) | 16910 | 17137 | 0 |
| comments | — | CCD2 off; CCD5 noisy | — |
| net exposure (ks) | 45905 | 43858 | 12525 |
| useful data (ks) | 45905 | 43858 | 0 |
A first data processing has been done with a preliminary version of the SAS (Science Analysis Software) pipeline scripts EMCHAIN (EMOS) and EPCHAIN (EPN). Because of the early stage of the experiment the data files are not in standard configuration, and thus we are unable to process the data with the current (5.3 version) of the SAS software. Consequently the data are treated using software developed in Saclay for calibration purposes. The output products are consistent with the SAS for downstream compatibility. The processing takes into account the electronic noise cleaning and the difference in exposure time per CCD. This data pre-processing eliminates most of the low energy noise, but from a conservative point of view we limited all analysis to energies above 0.2 keV. A higher noise is detected in some CCDs (CCD2 and 5 for EMOS 2 and CCD 4 for EMOS 1), likely due to the relatively high temperature of some CCDs at this stage of the experiment (they were later cooled). For example, the threshold for telemetry transmission was higher for the CCD2 of MOS2, representing an additional source of noise. Furthermore, this CCD was turned off for one of the EMOS 2 exposures, decreasing the quality of the data from this spatial region.
High background time intervals (due to solar flares) were rejected, for the EMOS cameras, by a careful examination of the 10 to 12 keV light curve. The drop of the EMOS effective area at high energy allows us to be sure that the light curve variation is not due to source variability in this energy band. Events were grouped in 100 s bins and all bins with more than 18 counts were rejected. After this filtering, the useful exposure time is 45 ks.
The EPN observation was made with the very first on-board instrument configuration, which is rather different from that used currently, and which has not been yet calibrated. Furthermore, the available blank-sky background observations were obtained in the standard configuration setting. Because of these problems, we have not attempted to use the PN data for our analysis, restricting ourselves to the 45 ks of useful EMOS data.
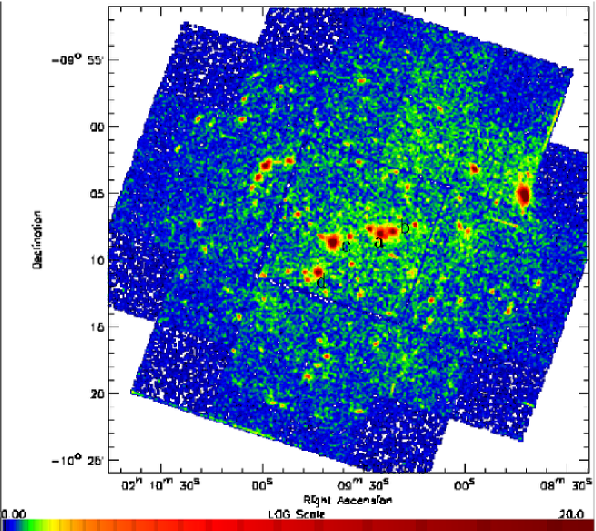
Figure 1 shows the EMOS 1 and EMOS 2 summed count rate image of the HCG 16 pointing in the energy band [0.2 -7.0] keV, smoothed with a Gaussian filter of = 12″. The image is not corrected for vignetting. The four main galaxies are marked as in Hickson (1982).
2.2 Background estimate
The estimate of the background level is a crucial point since we are interested in a very low surface-brightness, diffuse source. Because of the high background level we can assume that the contribution of any diffuse gas emission at large radii from the group centre is negligible. This allows us to make an estimate of the background in the same field (i.e. a local background). We consider that the XMM-Newton background is composed of two main components:
-
1.
an astrophysical X-ray background which is the combination of a soft (E 1.5 keV) component, mainly due to the local bubble, and a hard component due to unresolved cosmological sources (mainly AGN).
-
2.
an induced cosmic ray background which dominates at high energy ( 5 keV) and induces fluorescence lines (Al, Si, Cu, Au) from the shielding of the camera and the detector itself.
The two components deposit an indistinguishable signal on the detector, but have to be considered as completely different in the data analysis. The first component represents the X-ray photons that are collected by the telescope and focused on the camera, and so they are affected by vignetting. Conversely, the 2nd component is not affected by vignetting because the particles pass throughout the instrument as a whole. This means that to optimise the analysis of the X-ray background it is better to estimate the particle background before the application of the vignetting correction (see Belsole et al. 2001 for details).
EMOS detections outside the field of view (FoV) of the telescope are only due to particle events. One observation is not sufficient accurately to estimate the particle background, due to the small number of detected events. We thus summed the performance verification (PV) phase EMOS observations to achieve a total exposure time of s, and considered the out-of-FoV events. These events are detected by all but the central CCD, which has no out-of-FoV region. The spatial and spectral distribution of this particle emission was extended into the FoV, for each CCD, using a Monte Carlo simulation under the following assumptions:
-
•
the particle spectrum outside and inside the FoV are identical:
We use the s PV observation. The only spectrally useful region to compare directly the particle spectrum inside and outside the FoV is above 10 kev. In this spectral range, the region inside the FoV is essentially source-free due to the drop in effective area. For each CCD we verified that the spectrum above 10 keV is the same for the outside and inside FoV regions, except for a normalisation factor (of the order of 10%) due to the shielding of the telescope. It is thus an acceptable hypothesis to assume the equivalence between the continuum spectrum inside and outside the FoV in the whole energy band of EPIC.
-
•
it has a uniform spatial and spectral distribution in each CCD:
We looked for variations between CCDs in the same energy band above 10 keV. Examination of the spectrum of each CCD shows that there is some variation corresponding to the fluorescence lines of gold (11.47 keV, present only in CCD2 and 7 for EMOS 1, for example), but that the spectrum of the continuum is very similar from CCD to CCD, only showing a variation of about 5%. We thus estimate the particle spectrum and spatial distribution of the central CCD (which has no out of FoV regions) from the median between CCD 3 and 6, which are closest to it following the camera geometry. Using this approach, we are able to accurately reproduce the high energy (10 keV) spatial variations due to gold fluorescence lines because at these energies there are no source contributions. We note however, that the Al (1.48 keV) and the Si (1.74 keV) fluorescence lines are not spatially constant. Reproduction of the distribution of these lines is severely complicated by source contributions, and will require careful analysis of CLOSED222Observations obtained during the calibration phase using an aluminum filter of 1mm thickness, which stops the X-ray photons but not the particles. data, a statistically useful quantity of which has only recently been released. We take a conservative approach because of the relative weakness of our source, and exclude data from 1.4 to 2.0 keV (fluorescence Al and Si lines) in all subsequent analysis.
-
•
the spectrum of the particle background does not change significantly in time.
While the average induced cosmic ray background level has been shown to be constant within (see e.g., Arnaud et al. 2001), once periods affected by solar flares are excluded, no significant spectral variation has yet been detected.
In conclusion, the continuum spectrum of the particle background inside the FoV can be well represented using the out of FoV distribution, extended into the FOV using the Monte Carlo method under the assumptions listed above.
EMOS 1 and EMOS 2 particle event lists, with a total simulated exposure time of 106 s, were generated in the same format as real EMOS observations and were used for the subsequent image and spectral analysis. As the analysis of the particle distribution was done on the out of FoV events and the flux in this region is lower than in the FoV because of the shielding of the camera, the particle count rate and the source count rate were normalised in the 10 to 12 keV energy band.
3 Analysis and Results
3.1 Image and preliminary spectrum
As a first approach in detecting any diffuse X-ray emission, we smoothed the 0.3 to 7 keV EMOS 1 image to find the spatial region where the group diffuse signal is mainly located. To optimise the S/N of the image we performed a preliminary spectral analysis by extracting a spectrum in a circle of 6′ in radius around the optical centre of the group (i.e. where the smoothed image shows a significantly denser emission), excluding the signal from the galaxies. We subtracted from it the spectrum of the 10′ - 12′ ring in order to have an estimate of the local background. This rough analysis allows us to calculate an upper limit to the flux and to determine that the peak of the X-ray diffuse emission is around 1 keV (as previously shown in ROSAT data). Also, no emission is detected above 2 keV where the spectrum is dominated by the emission from individual galaxies (see Turner et al 2001a). Because this work is focused on the group diffuse X-ray emission, unless otherwise stated we limit the following analysis to the soft energy band [0.2-1.4] keV, the upper energy limit being determined by the contamination of the Al and Si fluorescence lines (see Sect. 2.2).
3.2 Wavelet analysis
The wavelet de-noising is a multi-scale image reconstruction tool. The noise contribution to the signal is removed by selecting its corresponding coefficients in the wavelet space. A new iterative wavelet de-noising algorithm (based on the à trou algorithm) especially suited for images with few counts is used here. Within this algorithm, thresholds are computed analytically for a Poisson noise distribution (see Bourdin et al. 2001). This algorithm has been written to be used for restoring the surface brightness of the X-ray emitting intra-cluster gas which is supposed to have no steep discontinuities. In the case of a group like HCG 16, the individual galaxy emission introduces a high level of discontinuity with a dynamic of three orders of magnitude. A crude application of our algorithm to such data would be good at restoring the emission of the extended gas but the restored image would be contaminated by artifacts around these highly emitting sources.
In order to exclude this contribution, a count threshold was first defined on the image, and the bright sources identified. Then the flux inside the source emitting regions, as well as in the CCD gaps, was interpolated so as to create a new image without steep discontinuities. The image was de-noised with the restoration algorithm and the sources were then re-added.
We have defined a counts (Poisson’s statistic, i.e. no vignetting correction is done) image of 4.1 pixel size where the contributions of the two EMOS cameras are added. The energy band 0.2-1.4 keV has been chosen so as to be sure that the detection excludes the Al and Si fluorescence lines. An image in the same energy band is also obtained for each camera, from the particle event lists. The EMOS particle images are then coadded.
The HCG16 counts image is de-noised with the previously described wavelet de-noising procedure. The threshold probability adopted for the HCG 16 image is of , meaning that there is a probability of that the detected structure comes from noise, or in other terms, the structures detected in the image are significant at 4.5 . The adopted threshold is quite severe, but due to the low S/N we prefer to adopt such a conservative approach. We detect significant extended emission only at scale 6, corresponding to 4.4 at the pixel size of the image. We do not detect any extended emission at higher frequency scales, indicating that if more clumpy structures exist, these cannot be significantly detected with these data. We are unable to distinguish between the real galaxy extension, the effect of the Point Spread Function (PSF) wings and the actual diffuse emission. However, it is unlikely that at the scale of detection the signal comes from the galaxies only (see Sect. 3.4.2).
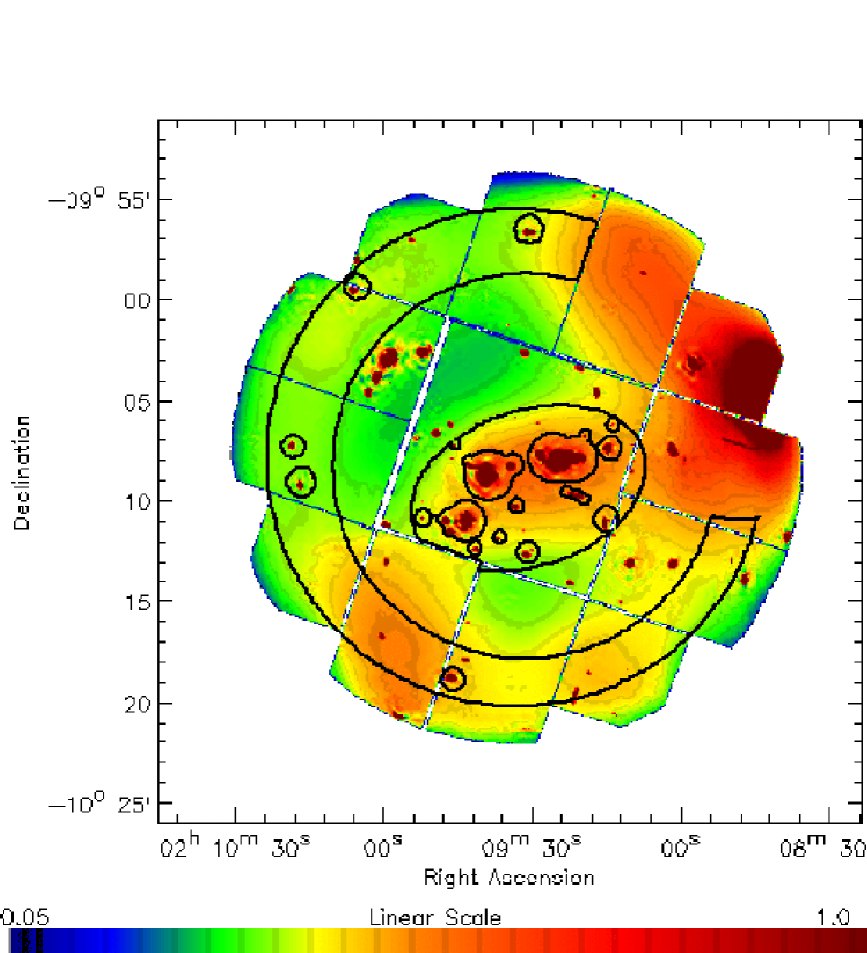
The particle background image is smoothed with a Gaussian kernel of , comparable to the scale of the large structures in the wavelet image. This operation allows us to take into account boundary effects which would be ignored if we just subtracted a constant value per CCD. The smoothed particle image was then normalised by the exposure time and subtracted from the denoised counts image. We then corrected the image for vignetting and the net result is shown in Fig. 2. To aid in the interpretation of the observed features, we superimpose on this figure the CCD gaps.
The wavelet detection of diffuse gas between galaxies exhibits an elliptical shape which extends up to a radius of 6′ ( 135 kpc) from the optical centre of the group to the NW-SE direction and to 4.5 in the other direction.
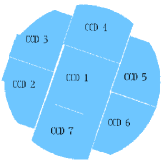
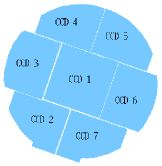
However, there are some noticeable effects in the image (we show in Fig. 3 the position of CCDs in the HCG16 sky coordinates):
-
•
The two noisy CCDs of EMOS 2 (CCD2 and CCD5) have not been excluded during the wavelet analysis in order to have a more continuous image. On the one hand, as our electronic noise cleaning is not perfect, the final result is an artificially high signal in the corresponding regions (see Fig. 3). This explains the high flux to the north-west (CCD5; note how this higher emission follows the shape of the CCD) and to the south-east (CCD2). On the other hand, for one exposure, CCD2 was turned off, and thus the total (EMOS 1+EMOS 2) image has a lower S/N ratio in the south-east zone corresponding to the EMOS 2 CCD2. The net effect is that, in this region, the structure detection will be less efficient (our wavelet algorithm does not allow for the moment to give a different weight to different spatial regions), and thus the smoothing kernel will appear larger (in this region) in the reconstructed wavelet image. Discarding the noisy CCDs would noticeably increase this effect.
-
•
The high signal to the west-north-west is further increased by a point source highly degraded by the off-axis PSF;
-
•
The extension onto the south-east (in the direction of galaxy d) is also probably due to a radio source (DSM99). This source is detected on CCD2 of EMOS 2, but because of the high CCD temperature in the early stage of the calibration, there is a great deal of electronic noise which effectively prevents further investigation of the source.
3.3 The radial profile
The gas density distribution, obtained from the surface brightness profile, is one of the parameters (together with the temperature and total flux) used to measure the gravitational potential well in the assumption of spherical symmetry.
We define a mask excluding all sources detected in the wavelet image as well as detector artifacts such as bad lines/columns and hot CCDs not taken into account by the pre-processing. Because of the uncertainties in the spatial distribution at the energies corresponding to the Al and Si fluorescence lines in the particle image (see section 2), we again limit our analysis to the 0.2-1.4 keV energy band. We are confident that this choice does not change our result because the preliminary spectral analysis (section 3.1) showed that the X-ray diffuse emission has its maximum around 1 keV.
To correct for vignetting, we used the photon weighting method described in Arnaud et al. (2001): each photon is weighted by the ratio of the effective area at its position on the detector to the central effective area at the energy of the photon. To take into account the “false” vignetting correction of the particle background component, we also corrected the particle image for vignetting, in the same energy band, and with the same algorithm. In the energy band considered here, the contribution of the particle background is, in principle, negligible. However, because of the telescope vignetting, in the outer regions more than half of the X-ray photons are lost, while the particle flux stays constant across the whole FoV. Thus the particle background contribution must be subtracted because, as shown in Fig. 4, at large radius ( 7′) this component contributes of the total sky background.
The particle image was normalised, as described in section 2, to the 10 to 12 keV energy band count rate. This was done separately for EMOS 1 and EMOS 2 and only after normalisation were the two images added together.
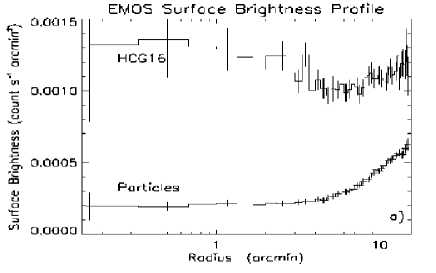
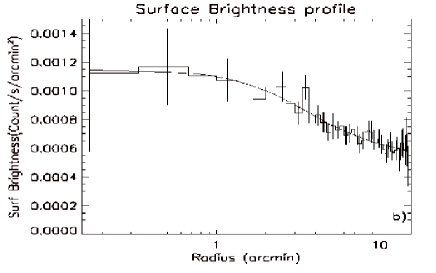
The surface brightness profile was obtained for the normalised (EMOS 1+EMOS 2) particle image and for the HCG 16 image separately (Fig. 4a), but using the same mask to exclude point sources. Afterwards, the particle radial profile was subtracted from that of HCG 16 (Fig. 4b). To summarise, if where , , and indicate the observed image, the source image, the particle image and the exposure map (including vignetting), respectively, then the whole radial profile analysis can be written as .
An estimate of the mass of the diffuse intergalactic medium is given by fitting the radial profile with a King profile ( model). However the HCG 16 gas shape (Fig. 2) indicates that the -model method assumption of spherical symmetry is not necessarily true. The centre of the fit was obtained, after several iterations, in order to maximise the central X-ray surface brightness of the King profile. The best solution was (J2000), which corresponds within 0.3″ to the optical centre (given by SIMBAD, FK5 coordinates). The best -model fit of the surface brightness profile gives a parameter of 0.37, a core radius of 2.7 and the central intensity of 6.510-4 cts s-1 arcmin-2 (Table 2). To check the consistency of this result and to have an estimate of the statistical significance of the error bars (given at 1 confidence level), we determine the background level independently, i.e. computing the count rate in the [0.2 -1.4] keV energy band and in the 10′ to 12′ ring (we consider it safer to limit the large radius analysis to 12′ since outside this radius some systematic error may come from the vignetting function, which is poorly known beyond this radius). This gives a value of cts s-1 arcmin-2 which is consistent with the value found when we fit the profile with the background parameter left free. However, due to the very low S/N, the fit is very sensitive to the background level. This may have an important effect on the fitted parameters, and also in the mass determination. The poor constraints on the fitted parameters are thus not surprising and we have to be careful with regard to their use in the determination of physical properties.
| Parameter | fit value |
|---|---|
| (arcmin) | |
| I0 (cts s-1 arcmin-2) | () 10-4 |
| bkg (cts s-1 arcmin-2) | () 10-4 |
3.4 The spectra
3.4.1 Method
While a standard technique for extracting spectra is to consider a circle around the source centre, we use a different method to determine the spatial extraction region due to the shape of the detected signal (Fig. 2), the low surface brightness (Fig. 4b) and the low S/N of the observation. Assuming that the wavelet analysis is the best representation for the detection of the diffuse emission, we define a regular elliptical region, following the shape of the emission in the wavelet image (Fig. 2). Within this elliptical mask, all bright sources have been excluded by defining a threshold (1 cts/s) in the wavelet image, which results in a typical radius of 1.1 for the exclusion of the galaxies. We will refer to this elliptical mask region as region .
Given that the intragroup gas is detected mainly in the central CCD (Fig. 2), it is possible to estimate a local background in an external region corresponding roughly to a 10′ to 12′ ring around the centre of the FoV (Fig. 2). We will refer to this local background as region .
To avoid the introduction of systematic errors, we are, in this spectral analysis, more conservative than in the imaging analysis and in both regions and we exclude: 1) the south-east corner because of contamination due to CCD2 of EMOS 2, which has a much higher noise (see section 2); 2) the region corresponding to CCD5 of EMOS 2, the other CCD displaying higher noise and which shows excess emission at low energies; 3) in both cameras, the region to the WNW because of a highly PSF degraded point source (note that this region corresponds essentially to CCD4 in EMOS 1).
The false vignetting correction of the particle component of the local background will over-subtract the true background contribution. To avoid this error, the events are not initially corrected for the vignetting effect. The method used follows these steps:
-
1.
We extracted 2 spectra from each events list (HCG 16 and particle): the first in region , the second in region . We now have spectra where the spectra are extracted from the HCG16 event list and the spectra come from the particle event list.
-
2.
The particle spectra were subtracted from the HCG 16 spectra in each region after a normalisation () in the 10 to 12 keV band:
This gives the particle subtracted spectra and .
-
3.
Vignetting correction: in order to compute the vignetting correction factor (VCF), we work under the assumption that the spatial distribution over the whole integrated region is independent of the energy (i.e. the spectrum is similar throughout the region). We thus use all photons, irrespective of their energy, to describe the spatial distribution of events. Then, for each photon energy, we compute the vignetting factor by averaging the weight (see Sect. 2 for the weight definition) at each photon position. The advantage of this method is that in using the total number of photons to calculate the weight, we can improve considerably the accuracy of the calculated vignetting factor.
Spectra and were thus multiplied by their respective vignetting correction factors (VCFs):
-
4.
The spectrum was then normalised to the surface area of region , and subtracted:
where is the normalization. This gives the full background-subtracted, vignetting-corrected net spectrum, .
3.4.2 PSF considerations
An important point of concern is the contamination of the excised sources due to the wings of the EMOS PSF. The one dimensional EMOS PSF is well described by a King function out to 5′ radius, and in the energy range of interest here, is essentially energy-independent (Ghizzardi 2001). The asymptotic slope of the PSF model is and for EMOS 1 and EMOS 2 respectively, at 0.8 keV in the on-axis position. We adopt this description of the PSF to correct the spectrum of the diffuse gas for the PSF of the excised sources (galaxies and point sources) in the ellipse and background (ring) regions.
In determining the spectrum in the elliptical region, we have excised the sources using a typical radius of for the galaxies and for the point sources. The sources in the background ring were excised in a cutoff radius of typically 40″.
For each source we calculated the encircled energy fraction (EEF) at 0.8 keV (corresponding to the peak of the diffuse emission spectrum) in the circle used to excise it, taking into account its off-axis position. The fraction of this energy falling outside the excised circle is . Once the fraction for each source was obtained, we computed a statistical mean fraction for the two regions of interest, the ellipse and the background. The mean fraction is 0.27 for EMOS 1 point sources in the ellipse, for example. This means that 0.27 of the flux of the excised point sources contaminates the diffuse X-ray gas flux of EMOS 1.
The PSF correction for the galaxies is more subtle because, in principle, we have to take into account the extension of a galaxy and convolve the emission distribution with the PSF. We thus use the EMOS PSF model to investigate the systematic errors introduced by treating a galaxy as a point source and as modelled by a model. We applied this test to HCG16c, the brightest and most extended galaxy, and thus the most extreme case. We obtained a surface brightness (SB) profile of this galaxy from the EMOS 1 image in the energy range 0.2-1.4 keV and we fitted it with the model of a point source convolved with the EMOS PSF. We fit this profile up to 2′ after which the profile becomes dominated by the diffuse emission. The fit is not good, but if we extrapolate the model up to 5′ we obtain a = 0.063 using a cutoff radius of 1.2 for this galaxy.
We then obtained a SB profile of galaxy HCG16c from the Chandra image in the same energy range as above. The Chandra PSF can be considered as perfect with respect to the EMOS PSF; we thus assume that this profile represents the intrinsic profile of the galaxy. We fitted the Chandra SB profile with a model finding as a best fit , and a reduced of 25.37/25 .
To estimate the EMOS spread function we fitted the EMOS profile (up to 2′) with a model convolved with the EMOS PSF and with the and the Rc fixed to their respective Chandra best fit values. The central X-ray surface brightness and background were free parameters. In this case we obtain = 0.07. If we leave the parameter free, we obtain for a reduced of 1.18. This value is in good agreement with the value obtained from the Chandra profile. In this case, the obtained is 0.068.
To summarise, if we consider this galaxy as a point source, we make a maximum systematic error of 10%. This induces an error on the X-ray luminosity obtained from the spectrum of the diffuse gas of 1.5%, which is consistent with the statistical errors. In view of the results outlined above it appears to be justified to treat galaxies as if they were point sources. We computed a mean value for all galaxies (per camera) obtaining = 0.073 for EMOS 1 and = 0.089 for EMOS 2. The mean cutoff radius was 68″ for both cameras. In the calculation of the EEF the off-axis position was taken into account for each galaxy; we note however that this does not introduce a strong effect.
We extracted the global spectrum (the best representation of the total flux) of all point sources in the background (; ring) region and in the ellipse () region. The global spectrum of the 4 galaxies was also obtained (). We then calculated a background spectrum which takes into account not only the PSF contamination due to its own point sources, but also that due to the point and extended sources in the elliptical region. In other words:
| (1) |
3.4.3 Spectral fit results
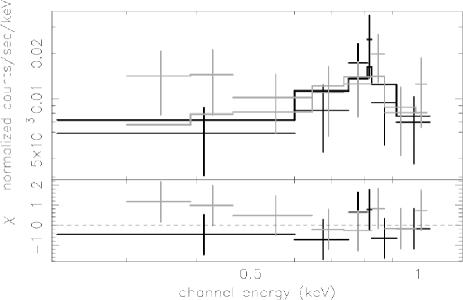
The EMOS 1 and EMOS 2 spectra were binned to 2 statistical significance after background subtraction, and fitted with an absorbed MEKAL model (XSPEC v11.0), the column density being fixed to the galactic value ( cm-2), leaving the temperature, abundance and normalisation (emission measure) as free parameters.
The EMOS 1 and EMOS 2 results are in very good agreement, except in the 0.2-0.3 keV energy band, where the EMOS 2 shows excess emission. We attribute this difference to an instrumental effect not well taken into account in the data processing (probably due to the contamination of the central CCD by the high temperature CCDs nearby, particularly affecting the low energy band) and decide consequently to ignore, when fitting, the 0.2-0.3 keV band in EMOS 2. We used the response matrix version 20.6. In Fig. 5 the EMOS 1 and EMOS 2 spectra and the folded model are shown. In the energy range 0.2-1.4 keV the EMOS 1 camera provides 1635 counts, corresponding to 313 net counts after background subtraction, while the EMOS 2 measured counts are 1269 in the energy range 0.3-1.4 keV (327 net counts). The spectral fit results are listed in Table 3, which also lists the fit results before the correction for the PSF. We can notice that the correction for the wings of the PSF, obtained by using instead of for the background spectrum (see eq.1), has the effect of slightly reducing the temperature, but above all of reducing the flux by 20%. The relative contribution of each galaxy (treated as a point source) and total point source contribution to this 20% flux reduction is shown in detail in Table 4.
| no PSF corrected | ||||
| /d.o.f. | ||||
| (1022 cm | (keV) | |||
| 0.02 (fix) | 0.53 | 0.09 | 13.84/20 | 0.0132 |
| (1041 erg s-1) | ||||
| 0.2-2.3 keV | bol. uncorr. | bol. uncorr. (*) | bol. corr. | bol. corr. (*) |
| 0.51 | 0.53 | 0.69 | 0.92 | 1.2 |
| PSF corrected | ||||
| /d.o.f. | ||||
| (1022 cm | (keV) | |||
| 0.02 (fix) | 0.49 | 0.07 | 6.35/11 | 0.0132 |
| (1041 erg s-1) | ||||
| 0.2-2.3 keV | bol. uncorr. | bol. uncorr. (*) | bol. corr. | bol. corr. (*) |
| 0.39 | 0.40 | 0.52 | 0.72 | 0.96 |
| region | EMOS 1 | EMOS 2 |
| % | % | |
| HCG16a+ HCG16b | 23.6 | 22.7 |
| HCG16c | 23.8 | 25.5 |
| HCG16d | 7 | 8.8 |
| point sources (total) | 45.5 | 43 |
4 Discussion
4.1 Comparison with previous works
The image analysis presented in Sect. 3 and the surface brightness profile confirms that HCG 16 is a bound system as previously shown from ROSAT studies. The EMOS sensitivity is 1.8 times that of the PSPC instrument on-board ROSAT at low energies, and the useful XMM-Newton observation time is more than triple that of the ROSAT/PSPC observation. This allows a better source detection (while point sources are in the noise in the PSPC observation) and exclusion of the galaxy contribution and the establishment of stronger constraints on the temperature. On the other hand, the high background level of XMM (worsened by the electronic noise at the early stage of the instrument setting) reduces the S/N and the detection radius for extended sources. Relative to ROSAT/PSPC, the EMOS PSF wings are larger, leading to a smoother apparent emission than was found by DSM99. In our analysis we have taken into account all these major sources of contamination, finding that the results are stable in the limit of this first light observation. The diffuse emission extends to at least 6′ from the group optical centre (corresponding to 135 kpc at the distance of HCG 16). Our results show a smooth gas distribution, rather in contrast to the very irregular morphology noted by DSM99. These authors emphasise the nature of region C4, corresponding to an excess emission starting from galaxy HCG 16b toward the south. A quick comparison between the ROSAT/PSPC and the EMOS image shows that the emission to the south-western extreme of our ellipse corresponds to a point source which was marginally detected by ROSAT and which is completely resolved by EMOS. If we smooth the EMOS image in a similar way as done by DSM99, we do not find a spatially continuous signal between the point source (widened by the large Gaussian kernel) and the diffuse emission. We thus estimate that at least 1/3 of the C4 emission is due to a point source unrelated to the group. While the statistics are poor, the spectrum of this source is minimised by a power law of and a column density of cm-2. The flux of the source is 1.7 ergs cm-2 s-1 and if the source was at the HCG 16 redshift its total luminosity would be 1.3 erg s-1. The remaining 2/3 of the flux are effectively inside the ellipse in Fig. 2, and there is no clear sign of separation from the neighbouring regions of the diffuse emission. An additional source lies in the region corresponding to C4 in DSM99 (closer to galaxy b). It has been excised in our analysis, but we checked the contribution of this source to the C4 emission. The best fit is a power law of index 2.3, with a flux of erg cm-2 s-1.
The elliptical shape and the spatial extension of the entire gas distribution make it unlikely that this gas can come only from ejection by the galaxies: even if active galaxies (as is the case here) eject large amounts of gas via galactic winds (Fabbiano et al. 1988), this emission does not extend out to several galactic radii.
While HCG 16 still remains one of the coolest galaxy groups with detected diffuse X-ray emission, the EPIC/MOS spectra analysis of HCG 16 gives a temperature of 0.47 keV, higher than that obtained with ROSAT (PBEB, DSM99), but in agreement within statistical errors.
The best fit metallicity is 0.07 solar, which is low with respect to galaxy clusters and some galaxy groups. However, even though several authors have reported lower abundances in groups than in clusters (e.g. Davis et al. 1999), the reality of this result is not well established, and we have to be careful with abundance determinations of such a low temperature systems. The abundance derived from hot plasma model fits for systems with temperatures below 1 keV is primarily driven by the iron L-shell complex, and the combination of the different lines is very sensitive to the temperature. This means that if temperature gradients are present, the abundance is, in general, an underestimate (Buote & Fabian 1998; Finoguenov & Ponman 1999). Works based on ROSAT/PSPC (Mulchaey & Zabludoff 1998) and ASCA (Finoguenov & Ponman 1999) data have already pointed out the multi-temperature structure of several galaxy groups. We are unable to determine a temperature profile for HCG 16 with these data, but given the presence of several starburst galaxies interacting in the central region it seems unlikely that the gas will be isothermal. On the other hand, our best fit metallicity determination is poorly constrained. Moreover the metallicity depends on the model used and it has also been shown, for other groups, that an increase of the metallicity value is obtained if a 2 temperature model is used (Buote 2000). In any case, we find a non-zero metallicity.
The low value of the bolometric X-ray luminosity is not surprising. Galaxy groups, especially at low temperature, have flat surface brightness distributions (Ponman et al. 1999; Helsdon & Ponman 2000a). In this work, the X-ray luminosity is calculated from the emission measure of the MEKAL model used to fit the spectrum. The latter is extracted within the radius where significant X-ray emission is detected, thus the luminosity calculated here may be only a small fraction of the total luminosity.
For comparison, we consider the whole region C2+C3+C4 in DSM99, taking the metallicity as 0.1 solar. Our result (0.52 1041 erg s-1) and theirs (0.69 1041 erg s-1) do not strongly disagree if we consider that 1/3 of of the X-ray emission form C4 comes from a point source, and that the spatial regions and the energy band where the spectrum is extracted are not exactly the same.
In comparison to the PBEB result, erg s-1, the bolometric X-ray luminosity found in the present study is more than a factor 5 lower (4.7/0.72). There are several reasons for this. According to DSM99, a factor of 2 of the luminosity found by PBEB is attributable to foreground/background sources, while the good EPIC sensitivity allow us to excise some sources missed in the PSPC analysis by these authors. Our limited ability to detect diffuse emission at large radii due to the high EPIC background is another reason for the difference in the surface used to extract the spectrum, although DSM99 argue that, apart from region C4 there is no emission far from the galaxies. Moreover, in our work we use a different correction for absorption relative to PBEB because of our higher temperature.
Furthermore, we have to consider that in addition to the fact that PBEB used a larger region to extract the spectrum (200 kpc), the flux from the spatial region occupied by the galaxies has been omitted in our analysis, whilst PBEB included an estimate of the diffuse group flux underlying the galaxy components. Hence the total luminosity within the elliptical region considered represents a lower limit to the total diffuse flux of the system. Assuming that the area omitted behind the galaxies has the same mean brightness as the rest of the region, we calculate the ratio between the mask area and the whole elliptical area (Fig. 2). This factor gives a rough correction of 30% to be applied to the value leading to an estimate of 9.6 1040 erg s-1 within the full elliptical region. To investigate further the comparison with ROSAT results, we analysed the PSPC data within a 5′ radius of the EPIC detection. Computing the count rate in this circle (which is comparable to our mask region) and replacing the galaxy emission with the interpolated flux (as done in PBEB), we obtain a bolometric luminosity of 7 1040 erg s-1, thus the results from EPIC and ROSAT, within similar central areas, are in an acceptable agreement.
4.2 Mass estimates and scaling laws
An estimate of the total mass of the gas can be obtained by combining the -model parameters and the spectral results. This implies that we assume, despite our reservations (section 3.4, 3.3) that the gas is isothermal and has a spherical symmetry. Under these hypotheses, the mass of the gas amounts to 8.810 at the maximum radius of detection (135 kpc). If the mass profile is extrapolated out to the virial radius ( 900 kpc)333the virial radius is obtained as: rvir = 4.1 (T/10 kev)0.5 (1+z)-1.5 (Evrard et al. 1996) the total gas mass is 3.710. We stress that we have to be careful about this result because we have made several assumptions which may not be strictly valid. Simulations indicate that the value obtained fitting the surface brightness profile is very sensitive to the range of radii used in the fit (Navarro et al. 1995; Vikhlinin, Forman & Jones 1999) and in the case of very low surface brightness the background determination is a strong source of uncertainty.
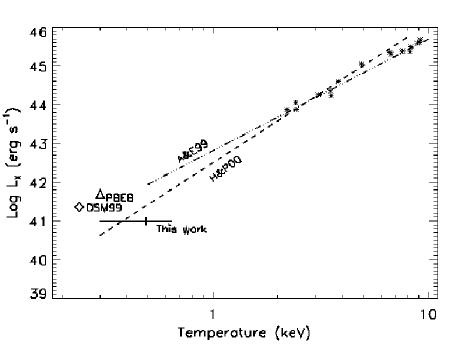
Self-similar scaling laws valid for clusters of galaxies break down at the low mass limit (PBEB; Helsdon & Ponman 2000a, Xue & Wu 2000). In the isentropic limit, semi-analytical models (Cavaliere et al. 1997, Balogh et al. 1999) predict a change in the slope of the -T relation at a temperature around 1 keV, which is in agreement with the observational results from galaxy groups (PBEB, Heldson & Ponman 2000a, 2000b; Mulchaey 2000). This departure from self-similarity of low temperature systems can be explained by preheating models, in which the gas is heated by some non-gravitational effect (such as galaxy winds during the galaxy formation) before it falls into the potential well of the group (Helsdon & Ponman 2000a, Babul et al. 2002, Tozzi et al. 2000; Dos Santos & Doré 2002). In this context, HCG 16 becomes even more interesting: its low surface brightness, low temperature and low velocity dispersion locate this group in an extreme position in all scaling laws determined for clusters and groups. Figure 6 shows the -T relation from Arnaud & Evrard (1999) for clusters, together with our result, where we take the bolometric luminosity corrected for absorption and for the omitted region corresponding to the galaxies. The dot-dot-dashed line is the best fit for clusters, whereas the dashed curve is the best fit obtained by Helsdon & Ponman (2000b) using the same sample as PBEB (22 groups observed with ROSAT/PSPC) but considering a different statistical weight when fitting the -T relation. HCG 16 is a factor 10 lower with respect to the cluster relation. However, despite its extreme nature, it is in reasonable agreement with the correlation found for galaxy groups, especially if one considers that integration to a larger radius could increase by a factor of a few. One should also bear in mind that the -T relation for groups shows significant scatter (Helsdon & Ponman 2000b), interpreted as arising from the different formation history of individual groups.
Another manifestation of the breaking of self-similarity seen in groups is the progressive flattening in X-ray surface brightness profiles in cooler systems (Ponman et al. 1999). For a system with a mean temperature as low as that of HCG 16, this trend implies a surface brightness index less than 0.4 (Helsdon & Ponman 2000a). Our fitted value, , (Table 2) is therefore well-matched to the trend seen in other X-ray bright groups.
Combining our fitted gas density profile with the measured gas temperature (which we take to be isothermal), it is possible to derive an entropy profile for the intergalactic gas. The result is a rising profile, with a value, at of 100 keV cm2. Although the profile itself should not be taken too seriously, due to uncertainties in the radial trends arising from the limited spatial extent over which we can reliably trace the emission, the entropy derived in the inner regions should be a secure estimate. This is very similar to the ‘entropy floor’ value found in the inner regions of X-ray bright groups by Ponman et al. (1999) and Lloyd-Davies et al. (2000).
4.3 The nature of HCG 16
Although the quality of this first light EPIC observation is not all we might wish, and we are therefore unable to trace the diffuse emission from HCG 16 out to even as large a radius as was reached with ROSAT, the superior spectral resolution and sensitivity of XMM, compared to the ROSAT PSPC, allow us to establish some important facts about the group:
-
•
There is substantial, genuinely diffuse X-ray emission in the centre of the group, surrounding the galaxies and extending to a radius of at least 135 kpc from the centre of the group.
-
•
The mean spectrum of this emission is well represented by a thermal plasma with a low temperature (0.49 keV) and non-zero metallicity.
-
•
The total extent and luminosity of this hot gas suggests that it cannot be attributed to galactic wind emission from the active galaxies within the group, and the morphology of the gas appears more relaxed than was apparent from the ROSAT data.
-
•
The properties of this diffuse X-ray emission are subject to large errors, but seem to fit rather well onto trends established by other X-ray bright groups. HCG 16 appears to lie at the extreme poor end of the spectrum of X-ray emitting groups.
These properties suggest that HCG 16 is a genuinely bound group, with a potential well in which gas has collected and been heated, in a manner analogous to other X-ray bright groups. In other words, the group has collapsed, even if we cannot state if it has already virialized. A system which is dense in three-dimensions is also strongly suggested by the extraordinary degree of activity seen in its galaxies, which has presumably been triggered by galaxy interactions.
However, HCG 16 is so far unique amongst groups with detectable hot intergalactic gas, in containing no bright early-type galaxies. One possible explanation, is that HCG 16 is a rare example of a group which has collapsed in a single event (rather than building through a sequence of mergers) very recently, so that the processes which lead to the conversion of late-type into early-type galaxies (mergers, interactions, stripping etc.) have not yet had time to run their course. If this picture is correct, then the implications are substantial. Typical X-ray bright groups, dominated by a central bright early-type galaxy, represent only a minority of groups. It is therefore very important to establish whether more typical spiral-dominated groups have similar gas content. If they do, then such groups may constitute the dominant component of the baryonic content of the Universe (Fukugita et al 1998). The properties of HCG 16 lend tentative support to this idea.
There is one fly in the ointment. If HCG 16 is a system currently near maximum collapse, then its velocity dispersion should be rather high (Mamon 1993). However, after correction for measurement errors, the velocity dispersion of the group is actually unusually low: 99 km s-1 if only the central four galaxies catalogued by Hickson are considered, and 76 km s-1 if the additional three Ribeiro et al. (1996) galaxies are included (Mamon, private communication). In terms of the parameter , the ratio between the specific energy on the galaxies, and that in the gas, which is normally approximately unity in clusters, and rather lower in groups (Helsdon & Ponman 2000a), HCG 16 has the remarkably low value, . This is difficult to understand, unless we happen to be viewing HCG 16 at an angle such that most of the galaxy motions lie within the plane of the sky.
In order to establish whether HCG 16 is truly a recently collapsed system with a fortuitous alignment of galaxy orbits, or whether we must seek some other explanation for its remarkable combination of properties, we require deep X-ray studies of other groups with similar optical characteristics. Such investigations should be carried out with XMM and Chandra over the next few years.
Acknowledgements.
We are grateful to the referee, Gary Mamon, for interesting conversations on the status of HCG 16 and for the very useful comments of his referee report. We are grateful to Monique Arnaud for helpful discussions throughout this work and invaluable assistance in the estimation of the PSF. We also thank G.W. Pratt for contributions to the analysis and for very useful comments on the original manuscript. Our thanks to R. Gastaud and D.M. Neumann for software support and to R. Rothenflug for help in the initial stages of the analysis. This research has made use of the SIMBAD database,operated at CDS, Strasbourg, France. The paper is based on observations obtained with XMM-Newton, an ESA science mission with instruments and contributions directly funded by ESA Member States and the USA (NASA). EPIC was developed by the EPIC Consortium led by the Principal Investigator, Dr. M. J. L. Turner. The consortium comprises the following Institutes: University of Leicester, University of Birmingham, (UK); CEA/Saclay, IAS Orsay, CESR Toulouse, (France); IAAP Tuebingen, MPE Garching,(Germany); IFC Milan, ITESRE Bologna, IAUP Palermo, Italy. EPIC is funded by: PPARC, CEA,CNES, DLR and ASI.References
- (1) Arnaud, M. & Evrard, A. 1999, MNRAS, 305,631
- (2) Arnaud, M., Neumann, D.M., Aghanim, N., et al. 2001, A&A, 365, L80
- (3) Babul, A., Balogh, M.L., Geraint, F.L., Gregory, B.P. 2002, MNRAS, 330, 329
- (4) Bahcall, N.A., Harris, D.E., Rood, H.J. 1984, ApJ, 284, L29
- (5) Belsole, E., Sauvageot, J.L., Arnaud, M., Ponman, T.J., Rothenflug, R. 2001, Proceedings of the conference:“Galaxy Clusters and the High Redshift Universe Observed in X-Rays”, XXIth Moriond Astrophysics Meeting, J. Trân Thanh Vân & D.M. Neumann eds., in http://www-dapnia.cea.fr/Conferences/ /Morion_astro_2001//abs03/belsole.html
- (6) Balogh, M.L, Babul, A., Patton, D.R. 1999, MNRAS, 307, 463
- (7) Bourdin, H., Slezak, E., Bijaoui, A., Arnaud, M. 2001, Proceedings of the conference:“Galaxy Clusters and the High Redshift Universe Observed in X-Rays”, XXIth Moriond Astrophysics Meeting, J. Trân Thanh Vân & D.M. Neumann eds., in http://www-dapnia.cea.fr/Conferences/ Morion_astro_2001/abs03/bourdin.html; astroph/0106138
- (8) Buote, D.A. 2000 MNRAS, 311, 176
- (9) Buote, D.A. & Fabian, A.C. 1998, MNRAS, 296, 977
- (10) Cavaliere, A., Menci, N., Tozzi,P. 1997, ApJ, 484, L21
- (11) Davis D.S., Mulchaey, J.S., Mushotzky R.F. 1999, ApJ, 511, 34
- (12) Dos Santos, S., Mamon, G.A. 1999, A&A, 352, 1 (DSM99)
- (13) Dos Santos, S., & Doré O. 2002, A&A, 383, 450
- (14) Evrard, A.E., Metzler, C.A., Navarro, J.F. 1996, ApJ, 496,494
- (15) Fabbiano, G. 1988, ApJ, 330, 672
- (16) Fukugita, M., Hogan, C.J., & Peebles, P.J.E. 1998, ApJ, 503, 518
- (17) Finoguenov, A. & Ponman, T.J. 1999, MNRAS, 305, 325
- (18) Ghizzardi, S. 2001, EPIC-MCT-TN-011 (XMM-SOC-CAL-TN-0022) http://xmm.vilspa.esa.es/docs/documents/ /CAL-T-0022-1-0.ps.gz
- (19) Helsdon, S.F., & Ponman, T.J. 2000, MNRAS, 315, 365 (Paper a)
- (20) Helsdon, S.F., & Ponman, T.J. 2000, MNRAS, 319, 933 (Paper b)
- (21) Hernquist, L., Katz, N., & Weinberg, D.H. 1995, ApJ, 442, 57
- (22) Hickson, P. 1982, ApJ, 255, 382
- (23) Hickson, P., & Rood, H.J. 1988, ApJ, 331, L69
- (24) Hickson, P., Mendes de Oliveira, C., Huchra, J.P., & Palumbo, G. 1992, ApJ, 399, 353
- (25) Hickson, P. 1997, ARA&A, 35, 357
- (26) Holland, A.D., Turner, M.J.L., Abbey, A.F., & Pool, P. 1996, SPIE, 2808, 414
- (27) Lloyd-Davies, E.L.D., Ponman T.J., & Cannon D.B. 2000, MNRAS, 315, 689
- (28) Mamon, G.A. 1986, ApJ, 307, 426
- (29) Mamon, G.A. 1993, in “Gravitational Dynamics and the N-Body Problem”, ed. F. Combes & E. Athanassoula, mtg. held in Aussois, France, March 1993, astro-ph/9308032
- (30) Mulchaey J.S., Davis D.S., Mushotzky R.F., & Burstein D. 1996, ApJ, 456, 80
- (31) Mulchaey, J.S., & Zabludoff, A.I. 1998, ApJ, 496, 73
- (32) Mulchaey, J.S. 2000, ARA&A, 38, 289
- (33) Navarro, J.F., Frenk, C.S., & White, S.D.M. 1995, MNRAS 275, 720
- (34) Pildis R.A., Bregman. J.N., & Evrard, A.E. 1995, ApJ, 433, 514
- (35) Ponman, T.J., Bourner, P.D.J., Ebeling, H., & Böhringer, H. 1996, MNRAS, 283, 690 (PBEB)
- (36) Ponman, T.J., Cannon, D.B., & Navarro, J.F. 1999, Nature, 397,135
- (37) Riberio, A.L.B., de Carvalho, R.R., Coziol, R., Capelato, H.V., & Zepf, S.E. 1996, ApJ, 463, L5
- (38) Saracco, P., & Ciliegi, P. 1995, A&A, 227, 301
- (39) Stark, A.A., Gammie, C. F., Wilson, R.W., et al. 1992, ApJS, 79, 77
- (40) Strüder, L., Briel, U., Dennerl, K., et al. 2001, A&A, 365, L18
- (41) Tozzi, P., Scharf, C., & Norman, C. 2000, ApJ, 542, 106
- (42) Tully, R.B. 1987, ApJ, 321,280
- (43) Turner, M.J.L., Reeves, J. N., Ponman, T.J., et al. 2001, A&A, 365, L110 (Paper a)
- (44) Turner, M.J.L. , Abbey. A., Arnaud, M., et al. 2001, A&A, 365, L27 (Paper b)
- (45) Vikhlinin, A., Forman, W. & Jones,C. 1999, ApJ, 525, 47
- (46) Walke, D.G., & Mamon, G.A. 1989, A&A, 225, 291
- (47) Xue, Y.J., & Wu, X.P. 2000, ApJ, 538, 65