00 \Year0000 \Month00 \Pagespan000000 \lhead[0]T. Miyaji et al.: XMM-Newton View of HDF-N and GWS Field \rhead[Astron. Nachr./AN XXX (200X) X]0 \headnoteAstron. Nachr./AN 32X (200X) X, XXX–XXX
XMM-Newton View of the Hubble Deep Field-North and Groth-Westphal Strip Regions
Abstract
We report the progress on our analysis of two deep XMM observations in the areas of Hubble Deep Field-North and the Groth-Westphal Strip field. We present the source detection method, Monte-Carlo simulation on source detection, and our preliminary Log – Log relations. Comparing these two fields and other fields in literature, we find up to variations in number counts near our flux limits, which is most likely to be due to cosmic variance. This serves as a pilot study for a more systematic investigation. The nature of the X-ray sources in the Groth-Westphal field is also discussed in terms of hardness ratios, morphology and spectroscopic properties.
keywords:
galaxies:active – (galaxies:)quasars:gereral – surveys – X-raysmiyaji@astro.phys.cmu.edu
1 Introduction
With the large collecting area and field of view, XMM-Newton provides complementary probe to the faint X-ray source population to the Chandra X-ray observatory. With a relatively short exposure, it collects sufficient photons to provide decent X-ray spectroscopy. Because of the limited fields of view in the Chandra Deep Fields North and South, collecting intermediate exposure XMM-Newton observations can probe the behavior of the X-ray sources at several [erg s-1 cm-2] (0.5-2 keV) or several [erg s-1 cm-2] (2-10 keV) with fair sampling of the universe.
In this proceedings article, we report our progress on the analysis of two deep surveys using XMM-Newton, one on the Hubble Deep Field-North and surroundings (HDF-N) and the other on the Groth-Westphal Strip field (GWS). These fields have originally been selected because of the abundance of multiwavelength data. We note that the HDF-N field has the deepest Chandra observation (the Chandra Deep Field-North, e.g. Alexander et al. this volume) and a part of the GWS has 200 ks of Chandra observations. Because of the depth of these observations, Chandra observations can provide better quality data than these XMM-Newton observations for most purposes. However, we use these data as training sets for investigating source detection properties with XMM-Newton and to extend the source count investigation on multiple fields to investigate the effects of the large scale structure of the universe. Also the XMM field of view of the GWS is much larger than the single-pointing Chandra observation. Thus XMM-Newton still provides the only source of X-ray data for a significant part of the Groth Strip itself, consisting of 28 contiguous Hubble Space Telescope Wide Field Planetary Camera 2 (HST WFPC2) imaging observations, out of which 16 are within the XMM-Newton FOV.
2 The XMM-Newton Observation
The X-ray data presented here are from guaranteed time (GT) programs of XMM-Newton. The observation log is shown below with the number of detected sources (within the central 11′) and approximate flux limits.
| Field | Expo. [ks] | ) | |||
|---|---|---|---|---|---|
| PN | MOS | 0.5-2 keV | 2-10 keV | 5-10 keV | |
| HDF-N | 155 | 180 | 158 | 116 | 49 |
| () | () | () | |||
| GWS | 65 | 80 | 117 | 91 | 35 |
| () | () | () | |||
3 Source Detection and Log – Log
We have performed source detection using the SAS procedure to the sum of the PN and two MOS detectors. The exposure map has been summed by weighting using PN and MOS responses in each band (assuming a power-law). We have first used eboxdetect in the local detect mode. We then created a smooothed background map using the esplinemap, which gives a spline fitted image in the source excluded map. This is follwed by another eboxdetect run in the map detect mode, where the sliding box cell searches for excesses over the smoothed background map. Finally, the task emldetect has been applied to make maximum-likelihood fitting to the candidate source positions. We have treated sources with the likelihood value of , where P is the probability that te source exists.
There is a caveat in this source detection procedure. Depending on the selection of parameters such as the number of spline nodes, esplinemap often gives spurious wavy features, which give rise to a concentration of spurious sources or a void of detected sources. Currently we manually search for espline parameters which gives best results. This will be improved in the future.
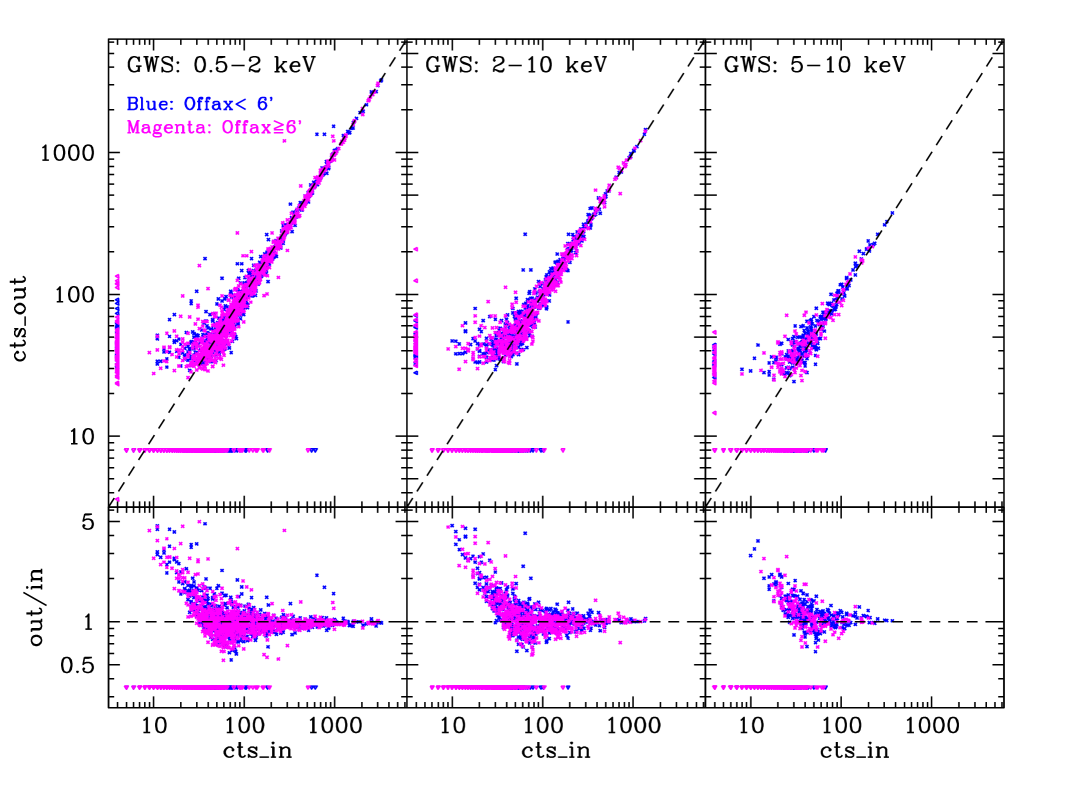
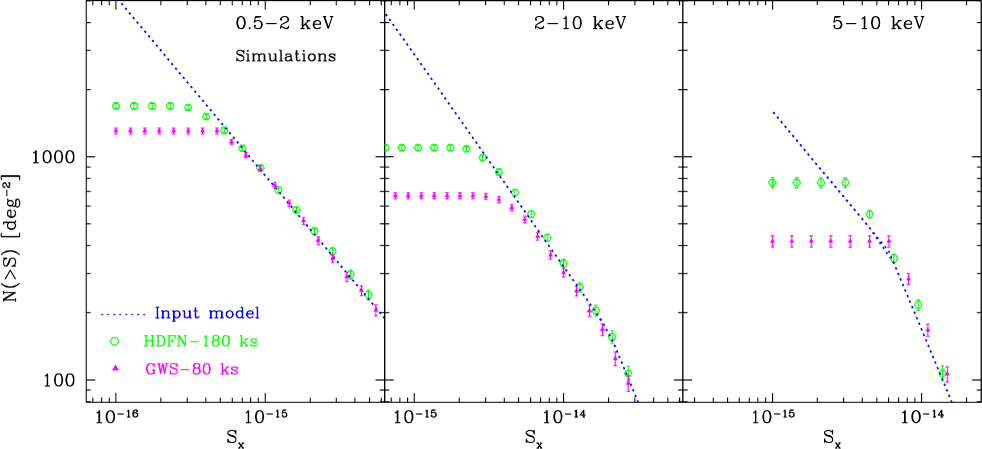
The inner 9.6 arcminute region has been used for the Log – Log analysis. In order to assess the limiting flux-area relation and incompleteness, we have made Monte-Carlo simulation using our multi-purpose image simulator qimsim (see Miyaji & Griffiths 2002a). The simulated images have been processed through the same source detection procedure. Fig.1 compares input and detected photon counts for the simulation runs corresponding to the GWS observations. At the brightest end, the input and output counts match quite well, even though the point spread functions used in the simulations and those for the emldetect correspond to different calibrations. This shows that the counts in the source detection is not very sensitive to the PSF calibration. We expect that the spread about the cts_out = cts_in line decreases as we use an improved method for the background map generation (e.g. Baldi et al. 2002). Fig.2 shows the input Log – Log relations and those calculated from detected sources assuming a limiting flux corresponding to constant count over the field. Fig.2 shows incompleteness near the flux limit. Eddington bias can be seen in the 5-10 keV band, where the input Log -Log is still steep at the limiting flux.
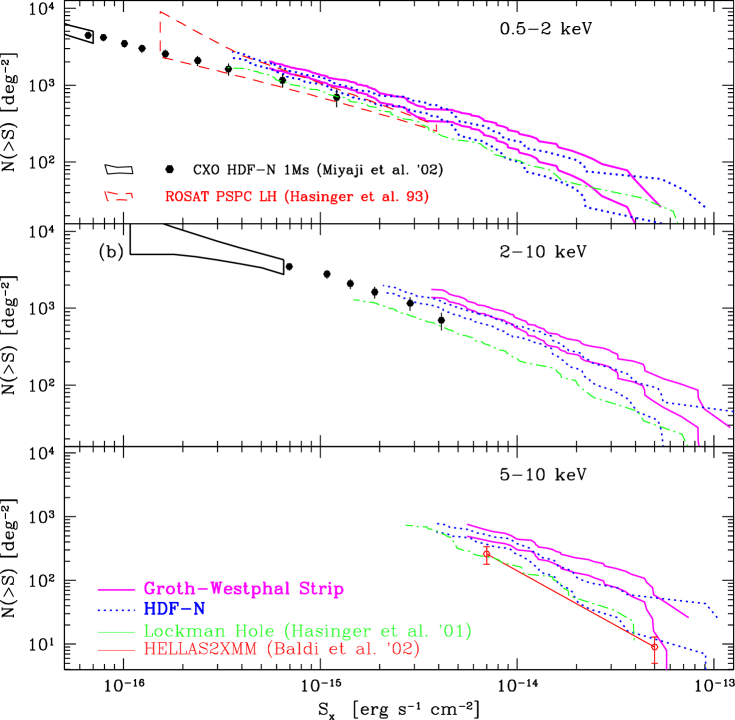
Fig.3 shows the preliminary results, after first-order correction for incompleteness and Eddington bias using the results of the simulation. Further corrections similar to that of Moretti et al. (2002), which involves mapping of detected photon counts to incident counts for each source, will be applied in a future full-length paper. We also overplot the curves from XMM-Newton observation of the Lockman Hole (Hasinger et al. 1993) and of the inner part of the Chandra Deep Field North with fluctuation analysis results (Miyaji & Griffiths 2002a). In the 5-10 keV plot, the results from HELLAS2XMM is also shown. We observe the variation of 20-30% at the limiting fluxes of our XMM-Newton observation, which is most likely to be caused by the cosmic variance.
4 X-ray Sources in the Groth-Westphal Field
In this section, we report the properties of the X-ray sources detected in the GWS field. We concentrate on the 24 sources within the HST WFPC2 fields of view, where the DEEP111http://deep.ucolick.org/ redshift survey is also concentrated. A more extensive redshift survey (DEEP2 222http://astron.berkeley.edu/davis/deep/) has started, which will cover most of the XMM-Newton field of view. This field is also a subject of the SIRTF legacy program, a planned target of the GALEX mission, and many other existing and future programs, which leaves potential for unique studies of the X-ray source population.
Out of the 24 XMM-Newton sources, 10 have spectroscopic redshifts from the DEEP survey and 5 have photometric redshifts (Brunner et al. 2000). Out of the 10 spectroscopically identified sources, two clearly have broad lines indicative of type 1 AGN, two have no broad permitted lines but show high excitation lines indicative of Seyfert 2 activity. The rest have narrow emission lines with no clear AGN indication. Using the HST Medium Deep Survey (MDS) database 333http://archive.stsci.edu/mds/, giving bulge/disk decomposition, we can immediately find the morphological properties of these sources as shown in Table 2. Fig. 4 shows X-ray color-color diagram of these 24 sources with spectroscopic and morphological properties overlaid.
| Stellar | Disk+Bulge | Pure Bulge | Galaxya) | No MDS |
| 3 | 2 | 3 | 2 | 2 |
a) An extended component has been resolved but the galaxy is too faint for a disk/bulge discrimination.
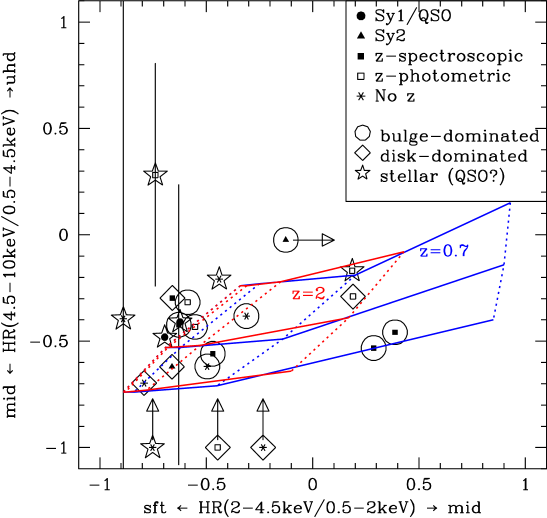
In spite of the small number, we see some trends. Sources are distributed along the grid, showing that absorbed power-law is a good description of most sources. This can be seen with direct spectra of these sources (Miyaji & Griffiths 2002b). We also note two bulge-dominated (elliptical) sources with the hardest HR1, both of which are located at , and with no apparent sign of AGN activity. In order to search for signs of AGN activity, we plan to observe galaxies at with Subaru OHS infrared spectrometer aiming at redshifted Hα and [NII] emission lines. The propsal has been accepted and the observation is expected to be in early 2003. We aim to find hidden AGN activity in the X-ray sources which only show normal galaxy characters in their optical spectra.
5 Conclusion
In this proceedings paper, we have reported the progress of our analysis on deep XMM-Newton observations of the HDF-N and GWS fields. We have described the source detection procedures, Monte-Carlo simulations, and resulting Log - Log relations in 0.5-2, 2-10, and 5-10 keV bands. Comparing the results from these two fields as well as other works, we see the variations of source density of near our flux limit, which is most likely to be due to cosmic variance. With XMM-Newton, a more systematic study is possible by collecting archival data of the fields with similar depths.
Currently our analysis on the GWS field is concentrated on the overlap with the WFPC2 strip, where the DEEP project has been concentrated. With the abundance of morphological data from the HST MDS, we can add insights into the nature of the X-ray sources. With our planned near-infrared spectroscopy using the OHS spectrograph attached to the Subaru 8.2m telescope, we expect to find indications of an AGN activity in X-ray sources which look normal galaxies in the current optical data. We also can extend our spectroscopic identification with the DEEP2 program, which will cover most of the XMM-Newton FOV of GWS.
Acknowledgements.
The authors acknowledge NASA grants NAG 5-10875 (LTSA) to TM and NAG 5-7423 to REG.References
- [1] Baldi, G. et al.: 2001. A&A 365, L45
- [2] Brunner, R.J. et al. 2000, ApJ 541, 527
- [3] Hasinger, G. et al.: 2001. A&A 365, L45
- [4] Miyaji, T., Griffiths, R.E.: 2002a, ApJ 564, L5
- [5] Miyaji, T., Griffiths, R.E.: 2002b, in Galaxy Clusters and the High Redshift Universe Observed in X-rays, eds. Neumann, D.M.& J. Trahn Than Van, (Saclay:CEA)
- [6] Moretti, A., Lazzatti, D., Campana, S. Tagliaferri, G.: 2002, ApJ 570, 502