Simulations of Galaxy Formation in a CDM Universe I:
Dynamical and Photometric Properties of a Simulated Disk Galaxy
Abstract
We present a detailed analysis of the dynamical and photometric properties of a disk galaxy simulated with unprecedented numerical resolution in the CDM cosmogony. The galaxy is assembled through a number of high-redshift mergers followed by a period of quiescent accretion after which lead to the formation of two distinct dynamical components: a spheroid of mostly old stars and a rotationally-supported disk of younger stars. The surface brightness profile is very well approximated by the superposition of an spheroid and an exponential disk. Each photometric component contributes a similar fraction of the total luminosity of the system, although less than a quarter of the stars form after the last merger episode at . In the optical bands the surface brightness profile is remarkably similar to that of Sab galaxy UGC615, but the simulated galaxy rotates significantly faster and has a declining rotation curve dominated by the spheroid near the center. The decline in circular velocity is at odds with observation and results from the high concentration of the dark matter and baryonic components, as well as from the relatively high mass-to-light ratio of the stars in the simulation. The simulated galaxy lies mag off the I-band Tully-Fisher relation of late-type spirals, but seems to be in reasonable agreement with Tully-Fisher data on S0 galaxies. In agreement with previous simulation work, the angular momentum of the luminous component is an order of magnitude lower than that of late-type spirals of similar rotation speed. This again reflects the dominance of the slowly-rotating, dense spheroidal component, to which most discrepancies with observation may be traced. On its own, the disk component has properties rather similar to those of late-type spirals: its luminosity, its exponential scalelength, and its colors are all comparable to those of galaxy disks of similar rotation speed. This suggests that a different form of feedback than adopted here is required to inhibit the efficient collapse and cooling of gas at high redshift that leads to the formation of the spheroid. Reconciling—without fine tuning—the properties of disk galaxies with the early collapse and high merging rates characteristic of hierarchical scenarios such as CDM remains a challenging, yet so far elusive, proposition.
1 Introduction
Ever since the photographic plates of extragalactic nebulae were first systematically examined in the early 20th century it became clear that—despite their unquestionable individuality—galaxies share certain regularities in their appearance that make it compelling to organize them into a few broad morphological classes. The Hubble sequence (Hubble 1926) summarizes this early taxonomical attempts and identifies several key morphological features (spheroid, disk, bars, spiral patterns) whose relative prominence conveys a wealth of information regarding the formation and evolution of individual galaxy systems. These features underlie most morphological classification schemes, and accounting for their origin, for the statistical distribution of galaxies amongst classes, as well as for their dependence on intrinsic properties (such as luminosity and rotation speed) and environmental properties (such as clustering), has become one of the holy grails of galaxy formation studies.
Within the current paradigm of structure formation there is a well specified scenario for the occurrence and evolution of such morphological features and, in particular, for the origin of the spheroidal and disk components. In the simplest version of this scenario (perhaps the only one that one might be able to rule out conclusively) most stars in the universe are envisioned to form as a result of dissipative settling of gas into centrifugally supported disk-like structures at the center of massive dark matter halos (White & Rees 1978). This idea is motivated by the observation that star forming activity in the local Universe is dominated by the gradual transformation of gas into stars in spiral disks such as that of the Milky Way (Kennicutt 1998a, Gallego et al. 1995, Lilly et al 1998, Sanders & Mirabel 1996). Centrifugally supported disks are thus the natural consequence of smooth dissipative collapse and the location where most stars are born; stellar spheroids arise as the remnants of subsequent, mainly dissipationless merger events. Galaxy morphology can thus fluctuate from disk- to spheroid-dominated, a continually evolving feature in the lifetime of a galaxy driven by the mode and timing of its mass accretion history.
A small (but significant) fraction of stars, however, are also being formed at present in starbursting and peculiar galaxies typified by ongoing mergers, and there is strong indication that the fraction of stars formed in such events was significantly higher in the past (Steidel et al. 1999). This point notwithstanding, the simple scenario outlined above linking accretion and morphology has found favor in theoretical and simulation work, starting with the pioneering work of Larson and the Toomres in the 70s (Larson 1977, Toomre & Toomre 1972, Toomre 1977), as well as in more recent work where attempts are made to account for the cosmological context of the mass accretion history of a galaxy (Katz & Gunn 1991, Navarro & Benz 1991, Katz 1992, Evrard, Summers & Davis 1994, Navarro & White 1994, Steinmetz & Müller 1995, Steinmetz & Navarro 2002). This whole body of work has shown that, qualitatively at least, the origin of multiple dynamical components in galaxies can be ascribed to the varied mass accretion history characteristic of hierarchically clustering universes.
Additional support for this scenario comes from semianalytic studies of galaxy formation which, using plausible (if perhaps non-unique) rules for assigning morphological types to remnants of merger events, are able to reproduce the abundance of galaxies as a function of spheroid-to-disk ratio as well as its general environmental dependence (Cole et al. 2000, Kauffmann, White & Guideroni 1993, Somerville & Primack 1999). The success of such accounting, however, relies on a number of free parameterizations of the poorly-understood interplay between gravitational collapse, star formation, and the energetics of stellar evolution. Indeed, it is widely accepted that there is enough freedom in such modeling so as to allow for the basic observational trends to be reproduced in most viable hierarchical cosmogonies. Thus, despite the heavy dependence of mass accretion on cosmology and the exquisite sensitivity of galaxy morphologies to mass accretion history, galaxy morphologies remain a poorly discriminating tool between competing cosmological models.
Despite their shortcomings, these studies have reached consensus on a few general results which seem essential to understanding observed galaxy properties within a hierarchically clustering formation scenario. For example, one crucial ingredient is a tight coupling between the energetics of stellar evolution and that of the interstellar/intergalactic gas. Without such regulating “feedback” mechanism, most baryons in hierarchical models would collapse, cool and turn into stars in the early stages of the collapse hierarchy (White & Rees 1978). Coupled with the active merging history typical of the assembly of galaxy-sized systems, this would lead to the majority of baryons in the universe being locked up in old, dynamically hot spheroids, at odds with observation (Schechter & Dressler 1987, Fukugita, Hogan & Peebles 1998).
Viable models of galaxy formation (and especially of disk galaxy formation) in a cold dark matter (CDM) dominated universe thus adopt an efficient heating mechanism (usually ascribed to the energetics of stellar ejecta) that prevents most baryons from being turned into stars at early times. If the heating mechanism is energetic enough to blow some of the baryons out of their dark halos altogether (Adelberger et al. 2002) it might also keep them in the form of diffuse intergalactic gas and modify their pace of accretion into galaxies so that they might not necessarily follow the assembly pattern of the dark matter component. Detaching the accretion histories of gas and dark matter might actually be necessary to preserve the angular momentum of the baryonic component during the various merger stages of the hierarchy, thus reconciling the meager large-scale torques responsible for a galaxy’s net rotation with the observed spin of spiral galaxies (Navarro & Benz 1991, Navarro & White 1994, Navarro & Steinmetz 1997, Weil, Eke & Efstathiou 1998).
The main difficulty with this idea is that the efficiency of feedback is observed to be rather low in most star-forming regions in the local universe (Martin 1999, MacLow & Ferrara 1999), apparently insufficient to reconcile observational trends with the collapse and merging history of galaxy systems in CDM universes. The possibility remains, however, that the mode of star formation, and consequently the efficiency of feedback, might be a strong function of redshift, so that simple rules inspired by observations of nearby galaxies might not apply at early times. It is nonetheless clear that the ultimate success of CDM-inspired galaxy formation models relies heavily on a realistic and accurate description of feedback.
This is the first in a series of papers where we use direct numerical simulation to study the galaxy formation process in a CDM universe under the simplest possible set of assumptions regarding star formation and feedback. Our algorithm includes only two free parameters; one expressing the relation between local dynamical and star formation timescales and another parameterizing the efficiency of feedback energy in affecting the bulk kinetic energy of gas in star forming regions. The two parameters are calibrated by matching empirical relations applicable to normal star forming galaxies in the local Universe. This approach provides not only insight into the nature of the problems afflicting hierarchical models of galaxy formation but also helps to guide attempts to resolve them through a careful quantitative assessment of their shortcomings. Such assessment might enable us to decide whether the predicament of CDM-based models can only be solved by resorting to radical modifications to the basic tenets of the cold dark matter theory, such as envisioned in theories where dark matter is warm (Sommer-Larsen & Dolgov 2001, Bode, Ostriker & Turok 2001) or self-interacting (Spergel & Steinhardt 2000), or whether the observed properties of galaxies are the result of complex astrophysics prevailing over some of the “natural” trends of gravitational instability models.
We present here a detailed analysis of the dynamical and photometric properties of a disk galaxy simulated in the CDM cosmogony. The simulation is similar in many respects to that presented by Steinmetz & Navarro (2002), except that in this case the halo has been selected so that it undergoes no major mergers after . This is conducive to the formation of a disk-like component by gradual accretion of cooled gas in the relatively undisturbed potential well of the dark halo. As we discuss below, a spheroid of old stars and a disk of young stars are clearly discernible at , supporting the view that the origin of various dynamical and photometric components in disk galaxies can be traced directly to events in the mass accretion history of the galaxy. Although the analysis in this paper deals with a single simulation, we plan to extend this work to other systems in further papers of this series, whose final goals include: (i) building up a statistically significant set of simulations exploring the morphologies of galaxies in halos formed through various merging histories, (ii) testing the dependence of the accretion-morphology link on simulation parameters, and (iii) using this information to predict the abundance of galaxies as a function of morphology in different cosmological models.
The plan of this paper is as follows. In § 2 we present details of the numerical simulation, § 3 lists the main results and compares them with observational data; § 4 discusses the implications of the modeling for our current understanding of the formation of disk galaxies in a hierarchical universe, whilst § 5 summarizes our main conclusions.
2 The Numerical Experiments
2.1 The Code
The simulation described here was performed with GRAPESPH, a particle-based, fully three-dimensional Lagrangian hydrodynamical code that combines the flexibility and adaptability of the Smoothed Particle Hydrodynamics technique with the speed of the special-purpose hardware GRAPE for computing gravitational interactions (Steinmetz 1996). The version used here includes the self-gravity of gas, stars, and dark matter, hydrodynamical pressure and shocks, Compton and radiative cooling, as well as the heating effects of a photoionizing UV background (see Navarro & Steinmetz 1997, 2000b for more details).
2.1.1 Star Formation and Feedback
Star formation is handled in GRAPESPH by means of a simple recipe for transforming gas particles into stars. The star formation algorithm is similar to that described in Steinmetz & Müller (1994, 1995, see also Katz 1992 and Navarro & White 1993), where star formation is modeled by creating “star” particles in collapsing regions that are locally Jeans-unstable at a rate given by . Here is the gas density and and are the local cooling and dynamical timescales, respectively. The proportionality parameter, , is chosen so that in dense regions, where , eligible gas is transformed into stars on a timescale much longer than .
After formation, star particles are only affected by gravitational forces, but they devolve energy and mass to their surroundings, in a crude attempt to mimic the energetic feedback from evolving stars and supernovae. To be precise, for the yrs following their formation star particles inject into their surrounding gas ergs per solar mass of stars formed. The bulk of this energy is invested into raising the internal energy (temperature) of the gas, a rather inefficient way of regulating star formation in dense, cold environments where cooling timescales are so short that the feedback energy is almost immediately radiated away.
We attempt to generalize this formulation by assuming that a certain fraction, , of the feedback energy is invested in raising the kinetic energy of the neighboring gas. These motions are still dissipated by shocks, but on a longer timescale, allowing for lower star formation efficiencies and longer effective timescales for the conversion of gas into stars as increases. As discussed by Navarro & Steinmetz (2000b, hereafter NS00b), we have attempted to determine plausible values for the two free parameters in our star formation algorithm, and , by matching the star formation properties of isolated disk galaxy models with the empirical relation between star formation rates and gas density compiled by Kennicutt (1998b).
The simulation reported here adopts and . As discussed by NS00b, these choices result in a moderately efficient feedback scheme, where the choice of prevents the rapid transformation of cold gas into stars but the low value of results in only a minor fraction of cooled gas being reheated and returned to intergalactic space in diffuse form. As such, we expect the star formation history in our simulated galaxy to trace roughly the rate at which gas cools and collapses to the center of dark matter halos.
A crude measure of the metal content of gas and stars is tracked by the code under the assumption that stellar evolutionary processes devolve of heavy elements to the interstellar medium per of stars formed. This material is added to the gas particles surrounding young “stars” for about yrs following their formation. The total metal content of a gas particle is used as a crude measure of its metallicity, which is in turn inherited by the star particles it spawns. Because of the short timescale adopted for this process, metallicities in our code are best understood as reflecting the -element enriched metal pollution due to type II supernovae rather than the Fe-rich enrichment expected from type Ia supernovae. No attempt has been made to follow the process of diffusion of metals in the gas.
It is clear from this discussion that our treatment of metal enrichment is quite rudimentary and, therefore, we shall restrict the use of stellar metallicities to the spectrophotometric modeling of the contribution of each star particle to the luminous output of a galaxy (see § 2.3). We emphasize that, at present, the numerical treatment of star formation, feedback, and metal enrichment is rather uncertain, and there exist a number of implementations proposed in the literature (see, e.g., Gerritsen 1997, Katz, Weinberg & Hernquist 1996, Thacker & Couchman 2000, Springel 2000, Sommer-Larsen, Götz & Portinari 2002, Marri & White 2002). In particular, it is possible that implementations that include substantial modifications to the kinetic energy of the gas surrounding star forming regions may lead to rather different star formation histories than reported here. Thus, the results reported here are best regarded as preliminary and should be corroborated by experiments designed to explore other plausible ways of accounting for the transformation of gas into stars and for their feedback on the interstellar medium.
2.2 The Simulation
We focus the numerical resources of the simulation on a region that evolves to form, at , a galaxy-sized dark matter halo in the low-density, flat Cold Dark Matter (CDM) scenario (Bahcall et al.. 1999). This is currently the favorite amongst hierarchical clustering models of structure formation, and is fully specified by the following choice of cosmological parameters111 We express the present value of Hubble’s constant as km s-1 Mpc-1: , , , and . The power spectrum is normalized so that at the rms amplitude of mass fluctuations in Mpc spheres is and we assume that there is no “tilt” in the initial power spectrum.
At the dark matter halo under consideration has a circular velocity, km/s, and total mass, , measured at the virial radius, kpc, where the mean inner density contrast (relative to the critical density for closure) is . This region is identified in a cosmological simulation of a large periodic box ( Mpc on a side) and resimulated at higher resolution, including the tidal field of the original simulation as described in detail by Navarro & White (1994), Navarro & Steinmetz (1997), and Power et al. (2002). The high-resolution region (an “amoeba”-shaped region contained within a cube of comoving Mpc on a side) is filled at the initial redshift, , with the same number of gas and dark matter particles. The gas and dark matter particle mass is and , respectively. We adopt a Plummer softening scalelength of kpc for all gravitational interactions between pairs of particles.
The baryonic mass of the final galaxy is roughly (hereafter we express all -dependent quantities assuming ), equivalent to roughly gas particles and represent an order of magnitude improvement over most previous work. Few simulations of comparable mass or spatial resolution have been completed to date, especially considering those that deal self-consistently with the full three-dimensional hydrodynamical and gravitational interactions of gas, stars and dark matter within a proper cosmological context (see, e.g., Thacker & Couchman 2001, Steinmetz & Navarro 2002, Sommer-Larsen, Götz and Portinari 2002, Governato et al. 2002). The resolution achieved in this simulation enables a detailed study of the dynamical and photometric properties of the simulated galaxy, including the identification of different populations of stars according to age, metallicity, or kinematics.
2.3 Analysis
Galaxy luminosities are computed by simply adding up the luminosities of each star particle, taking into account the time of creation of each particle (its “age”) and its metallicity, as described in detail by Contardo, Steinmetz & Fritze-von Alvensleben (1998). Corrections due to internal absorption and inclination are neglected, except for a wavelength-dependent dimming intended to take into account the gradual dispersal of obscuring dust clouds that surround the formation sites of young stars, and follows closely the prescriptions of Charlot & Fall (2000). For example, this amounts to an adjustment of and mag in the and bands, respectively, for stars younger than yrs. For stars older than yrs the adjustment is of and mag in the same bands, respectively.
3 Results
3.1 Evolution
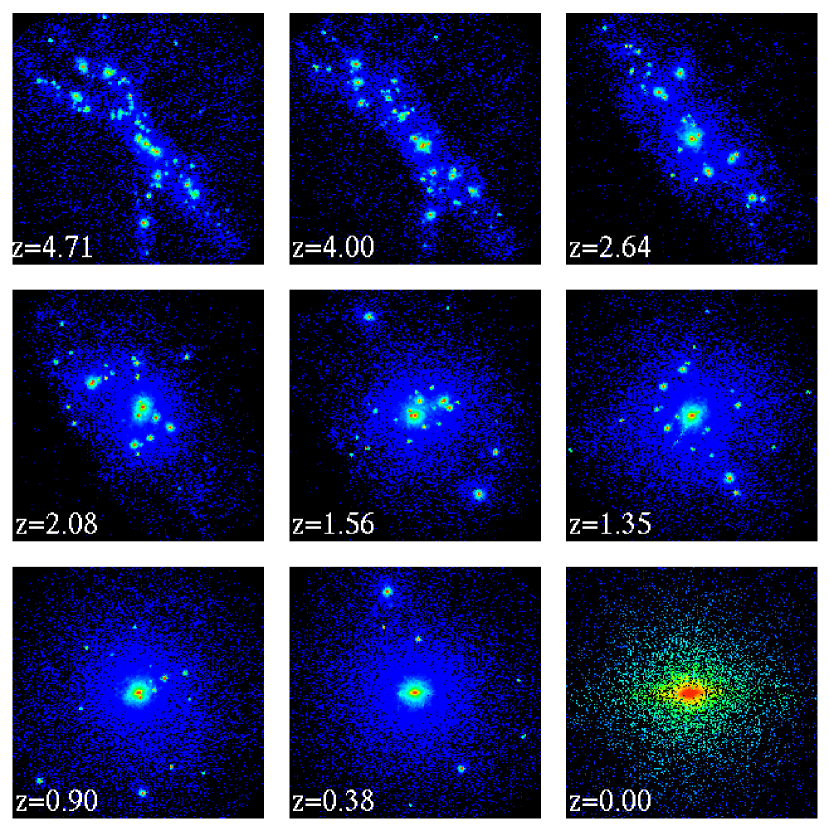
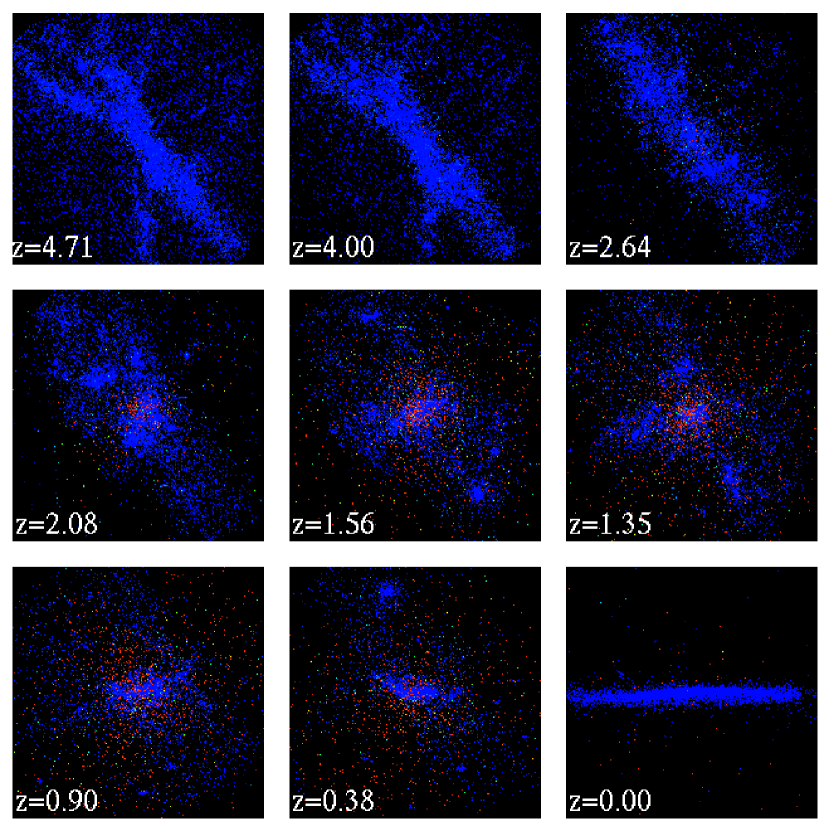
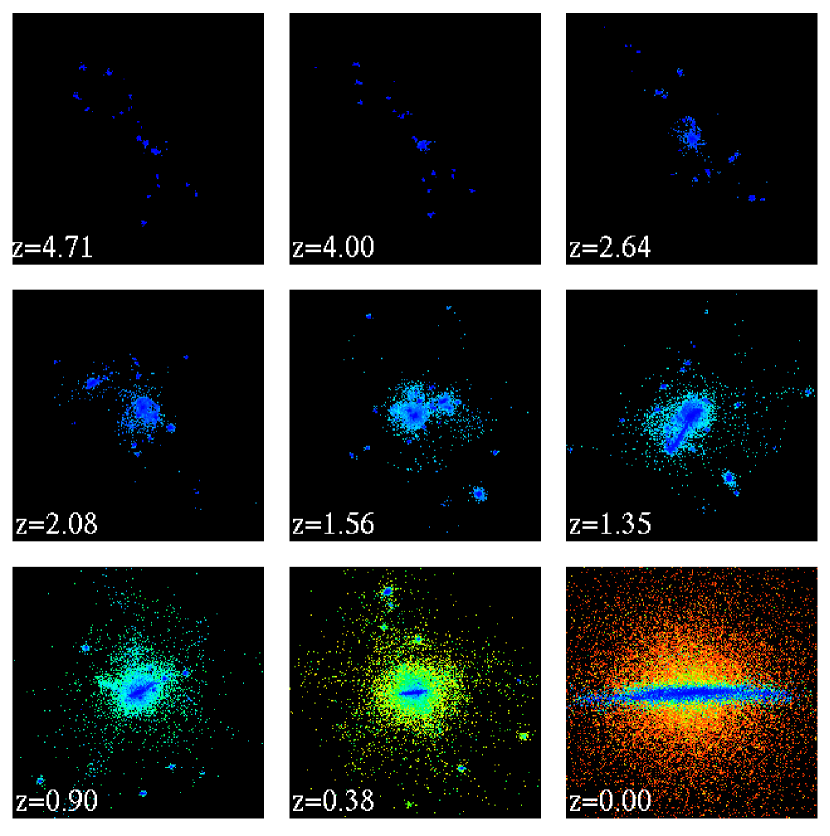
Figures 1- 3 show the distribution of dark matter, gas, and star particles in the simulation at various times during the evolution. Each panel is centered on the most massive progenitor and is kpc (physical) on a side except for the bottom right one, which zooms into the inner kpc of the final system at . Dark matter particles (Figure 1) are colored according to density (blue and red correspond to /kpc3 and /kpc3, respectively), gas (Figure 2) according to temperature (blue and red correspond to K and K, respectively), and stars (Figure 3) according to their current age (blue and red correspond to Gyrs and Gyrs, respectively).
The formation path depicted in Figure 1 is fairly typical of the assembly process of dark matter halos in the CDM cosmogony. By the high-resolution region collapses into a sheet-like structure crisscrossed by filaments traced by dark matter halos. Gas is pulled into these non-linear structures, where it cools, condenses at the center of the non-linear dark matter clumps, and starts forming stars. Gas in the filaments has short cooling times, and remains fairly cold throughout; only gas outside of the main “sheet-like” structure heats up to roughly a million degrees. The non-linear clumps are slowly merged together as matter drains down the filamentary structure into the most massive progenitor.
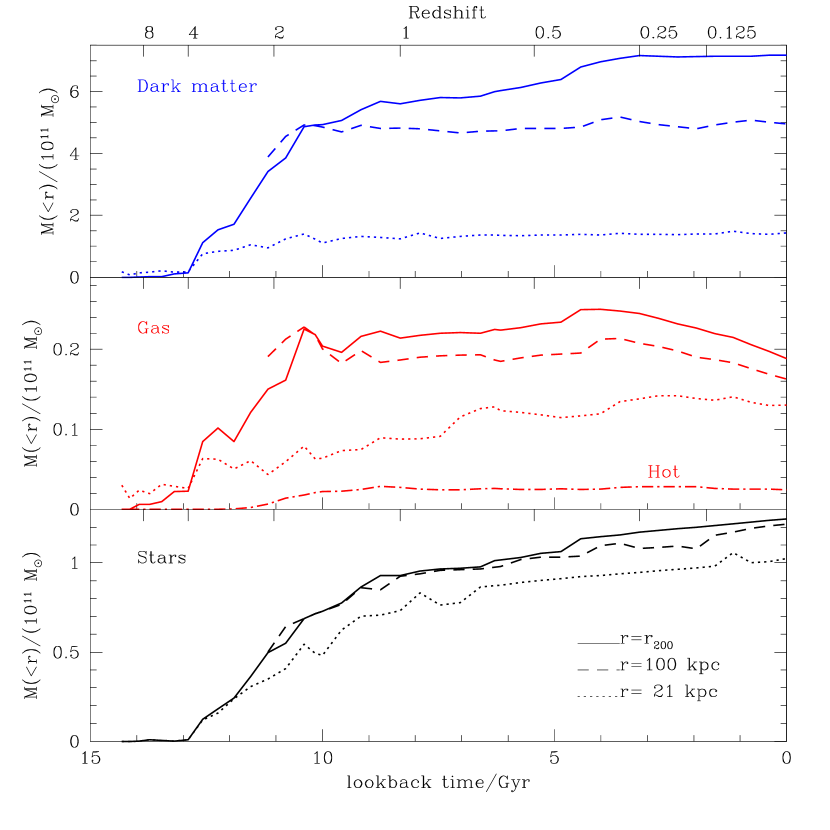
The merging activity is largely over by , when most of the mass is finally in place. This is shown quantitatively in the top panel of Figure 4, where the mass of the dark halo measured within various radii is shown as a function of time. The solid line corresponds to the dark mass within the virial radius, , and shows that the mass of the most massive progenitor has approximately doubled since . Most of the increase happens between and ; grows by only since . The latter increase is largely a result of the time-dependent definition of the virial radius. Indeed, the dark mass within the inner physical kpc (dashed lines in Figure 4) increases by less than in the last Gyr (since ), and that within physical kpc222Throughout the paper we adopt kpc as a fiducial “luminous radius” to define the luminous component of the galaxy at the center of the dark matter halo. (dotted lines) hardly increases at all since then.
This implies that over the past Gyr the environment where the luminous component of the galaxy grows is an exceptionally quiet one conducive to the formation of a disk through the gradual accretion of cooled gas. The bottom two panels of Figure 4 show that the baryonic mass within increases by about since as cooled gas gradually settles into a centrifugally supported disk at the center of the halo. This gas is turned into stars at about the same rate as it is accreted from the surrounding halo, so that the fraction of baryonic material in gaseous form in the central galaxy is always of order -. Interestingly, as shown by the dot-dashed line in Figure 4, little of the gas that makes up the disk cools off from a quasi-equilibrium corona of gas in hydrostatic equilibrium, as is commonly assumed in semianalytic models of galaxy formation (see, e.g., White & Frenk 1991). Most of the gas that forms the disk is cold throughout the accretion process and reaches the center either in precollapsed systems such as satellites or along dense filaments of mass (see Figure 2).
The accretion rate of gas onto the center of the halo during the past - Gyr is approximately constant and as a consequence the star formation rate of the galaxy remains at roughly /yr over the same period (Figure 5). Most of these stars form and remain in a centrifugally supported, thin disk-like structure so that, at , the central galaxy has two easily distinguishable components; a spheroid composed mainly of old stars formed before the merging activity tapers off at , and a thin stellar disk of young stars (seen edge-on in the bottom right panel of Figure 3).
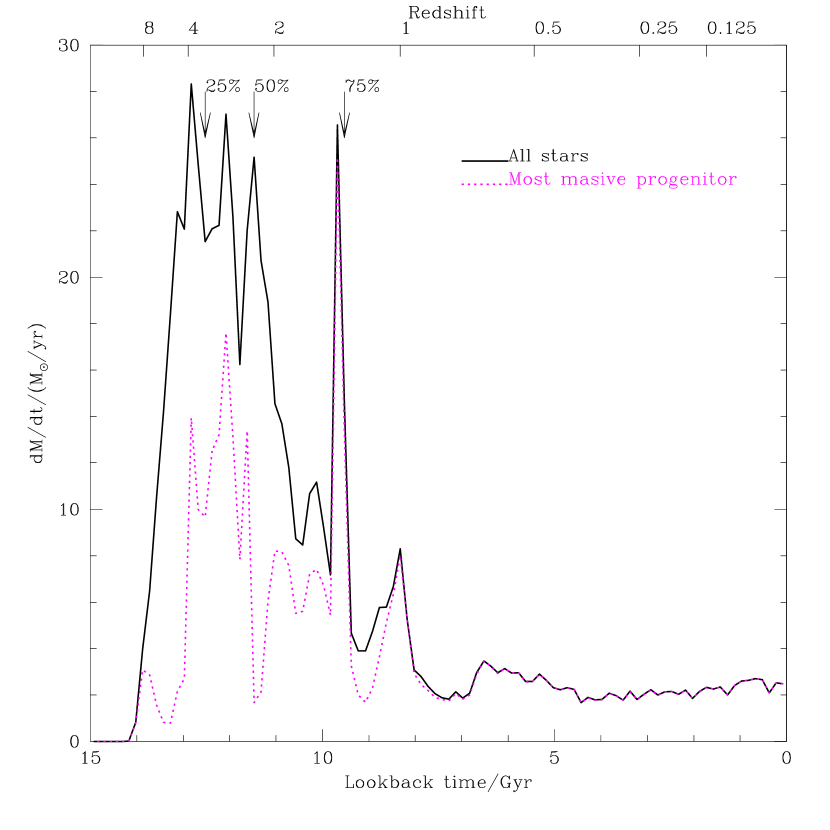
At earlier times the star formation rate is significantly higher, as shown by the age distribution of all stars identified within at (solid line in Figure 5). The dotted curve corresponds to stars formed exclusively in the central galaxy of the most massive progenitor halo; at the star formation rate was typically of order -/yr, a factor of times higher than at present. The age distribution of all stars also indicates that stars form very efficiently at early times, reflecting the large amount of gas that is able to cool within the many progenitors of the final system as well as the weak effect of our feedback implementation in preventing cooled gas from turning swiftly into stars.
Roughly of the stars in the central galaxy at have already formed by , about half of them by , and by , before the last major merger of the galaxy, at . The age distribution is punctuated by clearly discernible “peaks” of activity which may be traced to individual merger events. At the ratio of current to past-average star formation rate is , consistent with that of spirals of type later than Sa (Kennicutt 1998a). The similarity between the simulated galaxy and early type spirals extends beyond its star formation history to its photometric properties, as we discuss next.
3.2 Photometric properties
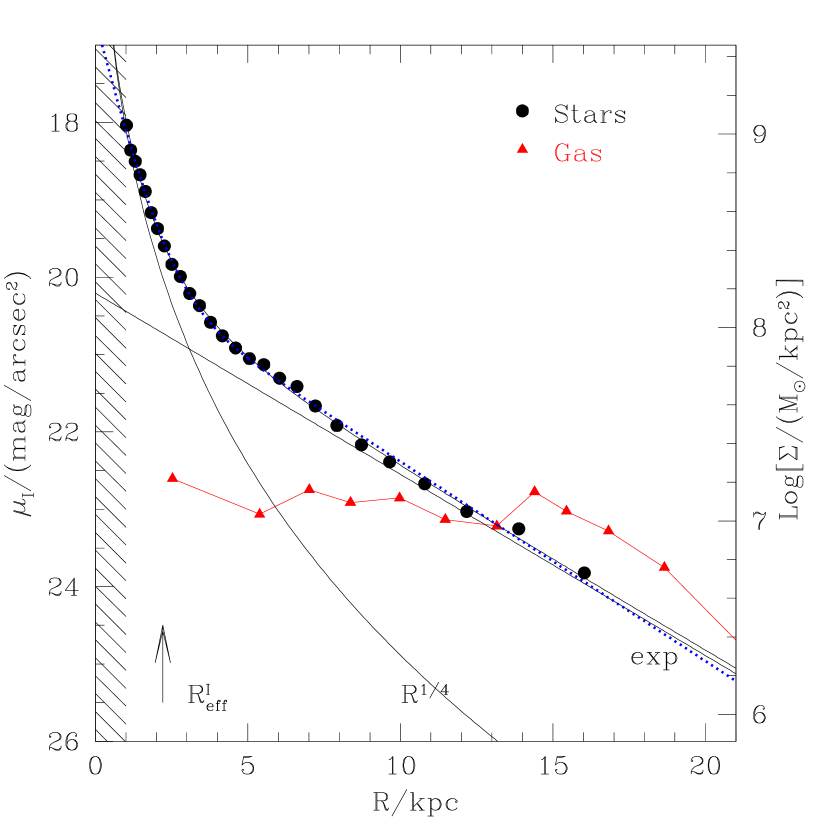
The solid circles in Figure 6 show the -band surface brightness profile of the simulated galaxy seen face-on. The shape of the profile is reminiscent of that of spiral galaxies (see, e.g., Boroson 1981, MacArthur, Courteau & Holtzman 2002); roughly exponential in the outer parts and with a sharp upturn towards the center due to the spheroid. The solid line through the filled circles is the result of a fit that combines a de Vaucouleurs law and an exponential profile. This four-parameter fit provides a very good description of the stellar luminosity profile over magnitudes, from the inner kpc out to kpc. We emphasize that the success of the exponential fit should not be taken to imply that the disk component is necessarily exponential or that the spheroidal component is necessarily ; indeed, assuming exponential profiles for both the spheroid and the disk results in a fit of comparable quality (see dotted line in Figure 6). We shall explore the correspondence between dynamical and photometric components in detail in the next paper of this series.
The parameters of the two-component fits for different bands is given in Table 1, and indicate that approximately half of the total light is assigned through this procedure to each component. The (extrapolated) central surface brightness of the disk is mag/arcsec2 in the band, not very different from the canonical Freeman value of mag/arcsec2 (see, e.g., Freeman 1970, Binney & Merrifield 1998). The ratio of spheroidal and disk scalelengths varies from in the ultraviolet to in . The values in the redder bands are in in excellent agreement with observation, although those in the UV and blue bands seem systematically low (MacArthur, Courteau & Holtzman 2002). We note that internal absorption and orientation effects (largely neglected in our analysis) play a significant role in the determination of these quantities, and may be responsible for the poorer agreement between simulation and observation in the UV.
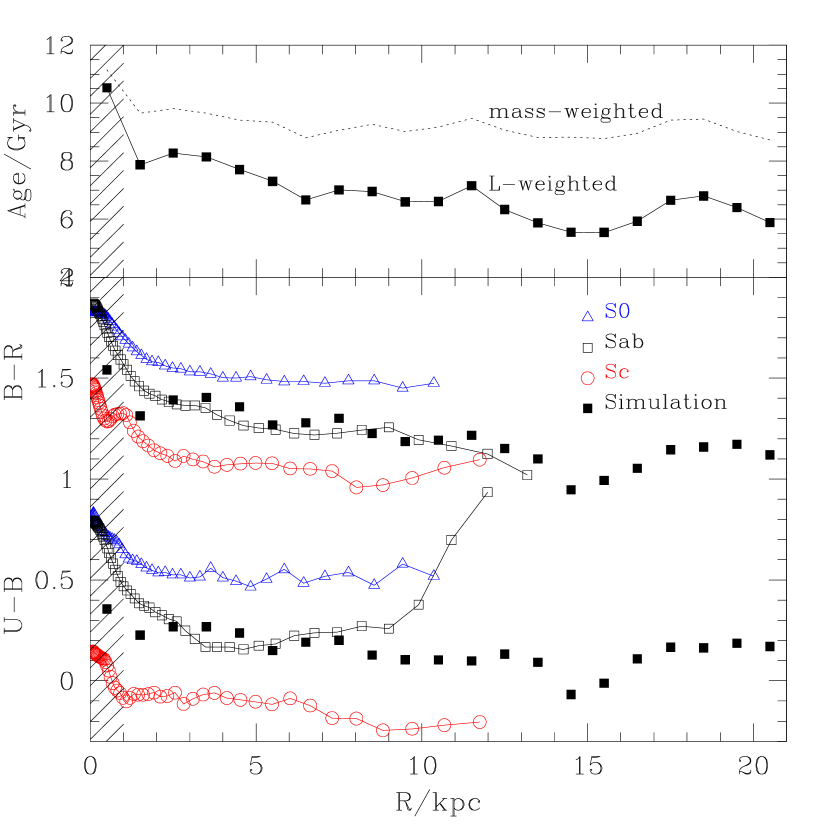
The effective radius of the fitted spheroidal component is quite small ( kpc) and increases systematically towards longer wavelengths, from kpc in the ultraviolet to about kpc in the near infrared. The exponential scalelength of the disk component shows the opposite behaviour, decreasing from kpc in the band to about kpc in . These systematic trends with wavelength are broadly consistent with observation and may be traced to radial gradients in the average stellar age (see top panel of Figure 7). The filled squares in this figure indicate the luminosity-weighted age of stars as a function of radius, and show that the oldest (reddest) stars dominate the light in the central kpc, whereas younger stars are responsible for much of the light in the outer regions.
The distribution of gas differs strongly from the stars and is distributed across the disk with roughly constant surface density, as is commonly found in spiral galaxies. Within , stars are being formed at a rate of kpcyr-1 which, together with an average gas surface density of kpc-2, place the simulated galaxy in close agreement with the empirical “Schmidt-law” relation described by Kennicutt (1998b) for nearby spirals.
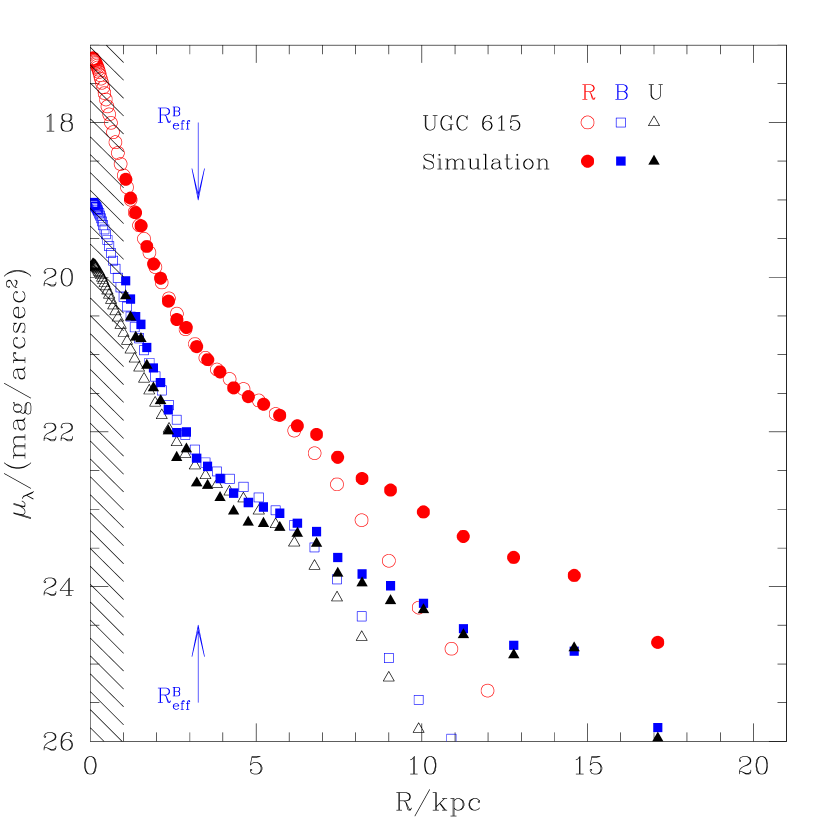
The similarity between the photometric properties of the simulated galaxy and those of early-type spirals is further illustrated in Figure 8, where we compare the surface brightness profile of the simulated galaxy to that of UGC615, a nearby Sab galaxy selected from the Nearby Field Galaxy Survey (Jansen et al. 2000). We emphasize that there are no arbitrary rescalings in this comparison. Near the center, the profiles are remarkably similar, especially in the and bands; in , UGC615’s profile is shallower near the center, again probably as a result of the sensitivity of the UV profile to internal extinction, which is treated crudely in our analysis. Beyond kpc, UGC615’s light distribution is (uncharacteristically) truncated; this is not seen in the simulated galaxy, where the exponential decline in surface brightness may be traced out to kpc.
The color profiles of the simulated galaxy are systematically too blue to be consistent with S0s and too red compared with Sc’s of similar luminosity but agree very well with UGC615. This is illustrated in Figure 7, where the color profiles of S0 galaxy UGC10097 and Sc galaxy UGC10356 are shown with open triangles and circles, respectively. All of these galaxies exhibit a significant but mild color gradient which is also nicely reproduced in the simulated galaxy. The radial trend towards bluer colors in the outer regions is largely due to the age gradient in the simulated galaxy shown in the top panel of Figure 7. The luminosity-weighted age drops from Gyr at kpc (just outside the region affected by the gravitational softening) to about Gyr at kpc. The mass-weighted age gradient is much less pronounced, as shown by the dotted line in the top panel of Figure 7.
The radial trend of stellar ages reverses beyond the edge of the star-forming gaseous disk, and most of the stars that populate the stellar halo (and are not attached to discernible satellites) are quite old. For example, only () of stars between and kpc are younger than () Gyr. Intriguingly, old stars are also common in the inner 1 kpc (see top panel of Figure 7): only () of stars there are younger than () Gyr. These trends are direct consequences of the hierarchical assembly of the galaxy, and result from (i) the high-density of the earliest collapsing progenitors, which makes their central cores resistant to disruption and allows them to sink to the center of the final remnant; and from (ii) the large separations of the orbits from which they merge, which allows tidally-stripped stars to populate orbits that can take them hundreds of kpc from the center (see Figure 3).
We conclude that, overall, the hierarchical scenario of galaxy formation depicted above is able to reproduce successfully the structural and photometric properties of early-type spirals such as UGC615. We consider next whether the agreement extends as well to the detailed kinematical properties of such galaxies.
3.3 Dynamical Properties
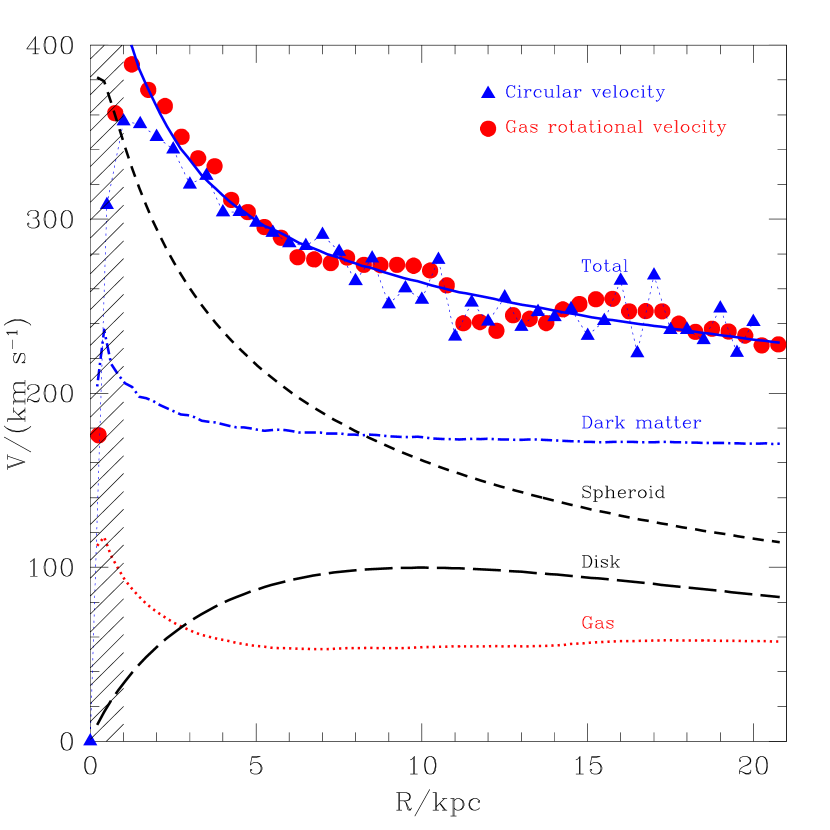
The baryonic component of the galaxy dominates the dynamical properties of the simulated galaxy near the center, mainly as a result of the high concentration of the luminous component. Half of the total light from the simulated galaxy comes from within the inner kpc and kpc in the and in the bands, respectively, and is heavily dominated by the spheroid near the center. The luminous component dominates within kpc and its spatial distribution imposes a sharp decline in the circular speed; at kpc the circular speed reaches km s-1 but it drops to km s-1 at kpc, as shown in Figure 9. Beyond kpc the circular velocity curve continues to decline, but at a lower rate, decreasing by only to km s-1 at kpc. The contribution of the dark matter to the circular velocity curve is approximately constant across the galaxy, as shown by the dot-dashed curve in Figure 9.
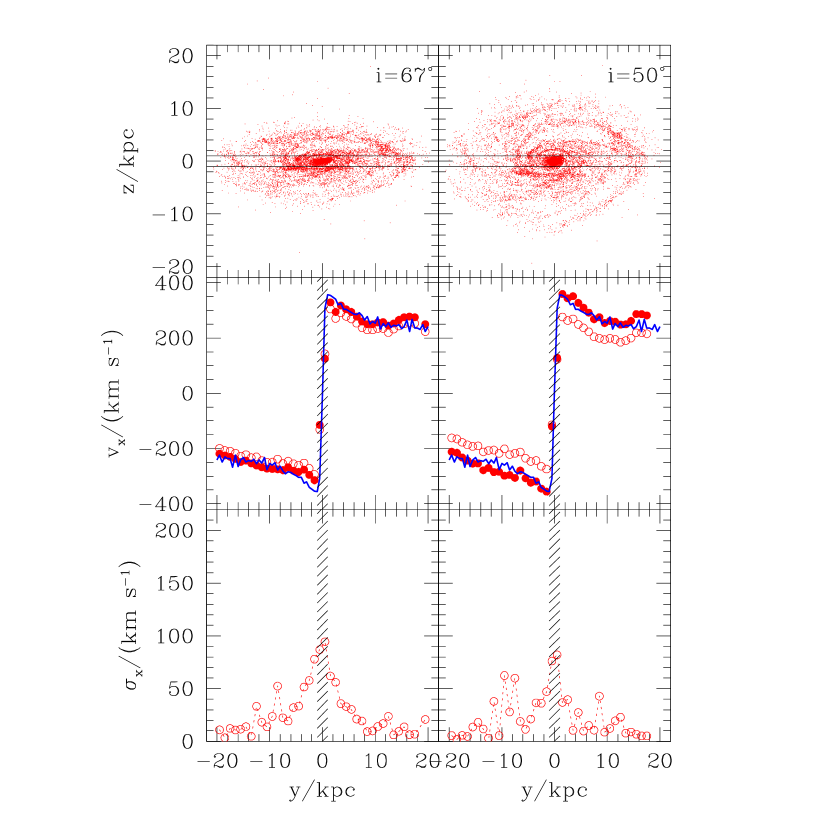
The solid circles in Figure 9 show that the declining circular velocity curve is closely traced by the gaseous disk. Indeed, most gas particles are on nearly circular orbits in a thin disk, as shown in Figure 10, where we plot the gas mean velocity (open circles in middle panel) as well as its dispersion (bottom panels) measured on a kpc-wide slit aligned with the major axis of the galaxy. The left and right panels assume inclinations of either or degrees, respectively. Sixty-seven degrees corresponds approximately to the highest inclination for which rotation curves may be derived for thin disks from single-slit observations without incurring large corrections due to superposition of different physical radii along the line of sight. The mean measured velocity along the line of sight is shown by the open circles; the filled circles show the circular speed, obtained by correcting the observed velocities by the sine of the inclination angle (derived from the axis ratio of the gas distribution) and by asymmetric drift, derived from the velocity dispersion profile using the procedure outlined by Neistein et al. (1999). The good agreement between the filled circles and the solid line in Figure 10 (which represents the true circular velocity profile, as in Figure 9a) confirms that the gas is distributed on a thin, cold, centrifugally-supported disk with a very well-behaved velocity field.
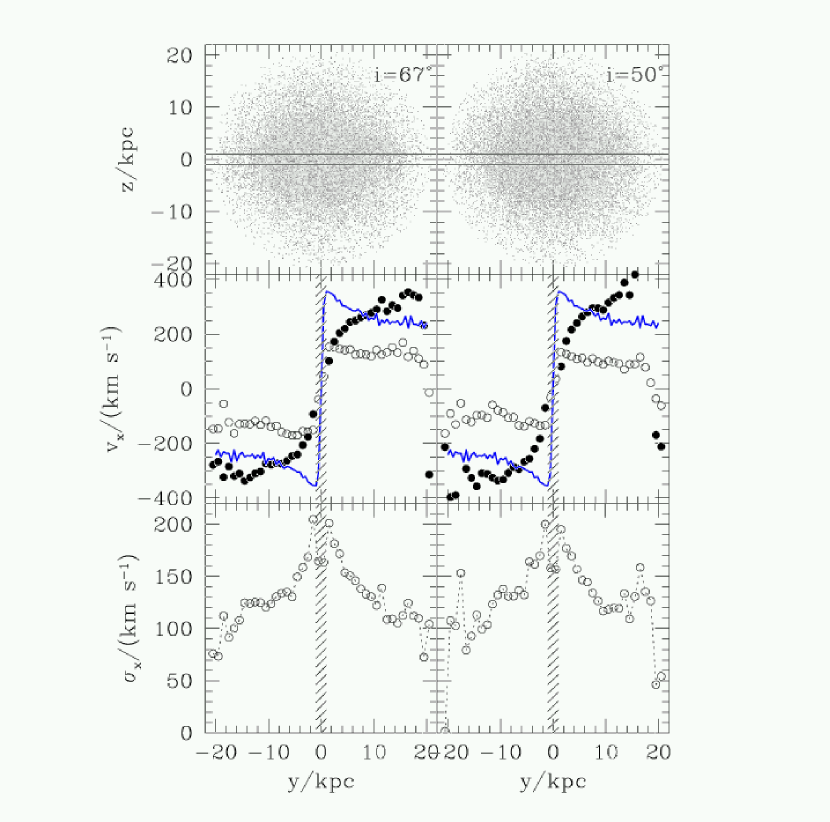
Young stars (which inherit the dynamical properties of their parent gas particles)are also on nearly circular orbits in a thin disk, as seen in the bottom right panel of Figure 3. Such stars contribute a fairly small fraction of the total stellar mass of the galaxy, which is dominated by the dynamically hot spheroidal component. This is shown in Figure 11, where the mean streaming velocity of the stars is seen to be comparable to the velocity dispersion at all radii; increases from at the center to slightly less than at kpc from the center. Such values of are comparable to those in S0 galaxies (Neistein et al. 1999, Mathieu, Merrifield & Kuijken 2002) and make it quite challenging to recover true circular speeds from single-slit spectra of stellar light. Indeed, even after correcting for asymmetric drift and inclination the recovered circular velocity curve (shown by the solid circles in Figure 11) is in poor agreement with the true circular speed (solid line). This confirms, as discussed by Neistein et al. (1999), that reliable information on circular speeds can only be obtained in regions where rotation dominates so that exceeds at least . This implies that the photometric importance of the disk component (which contributes half of the total light in this case, see Table 1) should be corroborated by dynamical information seems essential to confirm the prevalence of centrifugally supported structures in early-type spirals.
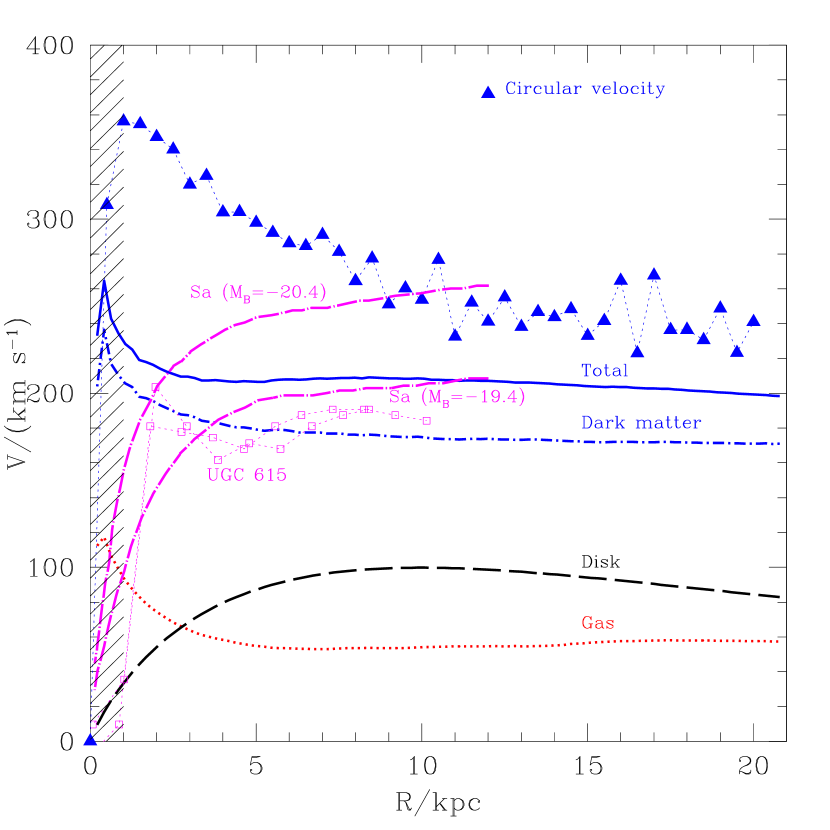
The simulated galaxy resembles an early-type spiral in its structural properties, but its declining circular velocity curve puts it at odds with most spirals of similar luminosity. For example, as shown in Figure 9b, Sa galaxies in this luminosity range have fairly flat (rather than declining) rotation curves over the radial range probed by our simulations (Rubin et al. 1985). In addition, despite the close photometric similarity between the simulated galaxy and UGC615, the former rotates significantly faster. The rotation curve of UGC615 (kindly made available by Sheila Kannappan) is shown with open squares in Figure 9b. The rotation speed peaks at about km s-1, and shows no obvious decline. Barring some (unlikely) observational artifact that may smear out rotation speeds in the inner regions, we must conclude that the kinematic disagreement between the simulated galaxy and UGC615 signals a very different underlying mass distribution in these two systems.
This is due, at least partially, to the relatively high stellar mass-to-light ratios that result from our spectrophotometric modeling. According to the data in Tables 2 and 3, the stellar mass-to-light ratio of the simulated galaxy in the band is . This may be compared with the dynamical (i.e., maximum) mass-to-light ratio consistent with UGC615’s luminosity and its rotation speed at the effective radius, where the constant of proportionality, , depends on the shape of the luminosity profile; for an spheroid.
For UGC615 we find , about lower than in the simulation. It is thus not surprising that the simulated galaxy rotates faster than UGC615: both have similar luminosities and half-light radii but in the former the stars alone within weigh more than the maximum mass allowed by dynamical measurements in UGC615. The inclusion of the dark matter component, of course, serves only to worsen this discrepancy, and lifts the velocities in the simulation well above the values observed for UGC615.
One might be tempted to vary the IMF in order to lower in the simulation and bring it into better agreement with the constraints on UGC615. The values quoted above (and those listed in Tables 1 and 3) assume a Scalo IMF with upper and lower mass cutoffs of and , respectively. For comparison, assuming a Salpeter or Miller-Scalo IMF would actually make the galaxy dimmer in by and , respectively. It is not clear to us at this point how to reconcile the low mass-to-light ratios implied by the dynamical data of UGC615 with the relatively red colors shown in Figure 8 and with the relatively normal ratio of current to past-average star formation rates (§ 3.1). The disagreement suggests that dynamical constraints such as should become an important ingredient of spectrophotometric modeling in order to match observations. We intend to return to this issue in future papers of this series.
Furthermore, tinkering with the IMF can only make the galaxy brighter or dimmer as a whole, without resolving the discrepancy in the shape of the rotation curve. The latter problem is related to the high concentration of dark matter and baryons in the simulated galaxy (Navarro & Steinmetz 2000a). As shown in Figure 9, the contribution of the dark matter to the circular velocity curve is essentially constant and, therefore, the addition of an spheroidal component of comparable mass leads inevitably to a declining rotation curve. Clearly, the dark matter profile in UGC615 and other early-type spirals with flat rotation curves must be significantly different from that of the simulated galaxy. We note that the dark mass distribution responds sensitively to the concentration of luminous material (Barnes & White 1984, Blumenthal et al. 1986), so it is possible that a less massive (or less concentrated) luminous component would result in a less concentrated dark matter component in better agreement with observation.
Reconciling simulation and observation thus appears to require lower stellar mass-to-light ratios than achieved in the simulation but, perhaps more importantly, also a substantial reduction in the concentration (or mass) of the luminous galaxy, and of the spheroidal component in particular. The latter problem is likely related to mergers of gas-rich progenitors, which are very common at early times in the history of the simulated galaxy. As discussed by Mihos & Hernquist (1996), gas is funneled very efficiently to the center of the remnant during mergers, where it may reach extremely high density before being transformed into stars. Significant modification of our star formation algorithm appears necessary in order to prevent large numbers of stars from forming at high redshift in dense configurations driven by the gas-rich mergers prevalent at that epoch. We elaborate on this issue further in § 4.
3.4 Scaling Laws
3.4.1 Angular momentum
Accounting for the angular momentum of disk galaxies is one of the serious challenges faced by hierarchical models of galaxy formation. The basic problem is that the specific angular momentum of disk galaxies of given rotation speed is roughly comparable to that of dark matter halos of similar circular velocity. Since dark matter and baryons experience similar tidal torquing before turnaround, their specific angular momentum before collapse is similar, suggesting that there has been little net transfer of angular momentum between baryons and dark matter during the assembly of the luminous disk.
On the other hand, numerical simulations where the gas is allowed to radiate and cool show that baryons tend to collapse early and to cool efficiently within halos formed during the first stages of the hierarchy (Navarro & Benz 1991, Navarro, Frenk & White 1995, Navarro & Steinmetz 1997, NS00b). This leads to significant spatial segregation between components and to substantial transfer of angular momentum during subsequent mergers from the more centrally concentrated component (baryons) to the surrounding dark matter. As a result, the baryonic components of simulated galaxies are found to be deficient in angular momentum by up to an order of magnitude compared with late-type spirals.
A similar problem afflicts the simulation reported here, as shown in Figure 12. In this figure, the small filled circles correspond to late-type spirals, taken mainly from the Tully-Fisher samples of Mathewson, Ford & Buchhorn (1992) and Courteau (1997), as compiled by Navarro (1998). The solid line is not a fit to the data but rather the velocity-squared scaling () expected for dark matter halos with constant dimensionless rotation parameter (see NS00b for details). The agreement in the scaling underlines the close relationship expected between the angular momentum of baryons and dark matter. The results of NS00b’s numerical simulations are shown with open circles in Figure 12, and illustrate the angular momentum deficiency of the baryonic component in simulations alluded to above.
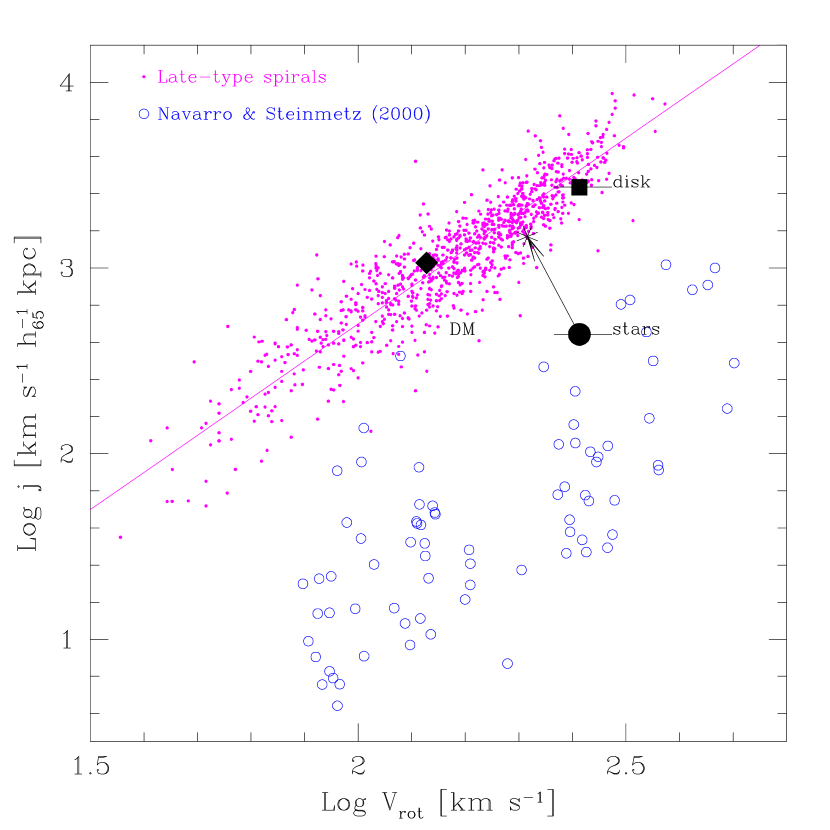
The same is true for the stellar component of the simulated galaxy discussed here, as shown by the filled solid circle labeled “stars”. The horizontal “error bar” in this symbol indicates the uncertainty in the rotation speed of the disk resulting from the declining shape of the rotation curve, which prevents us from assigning an unambiguous characteristic rotation speed to the simulated galaxy. We follow standard practice (see, e.g., Courteau 1997) and choose km s-1, the velocity at kpc, to characterize the simulated galaxy. The “error bar” spans the range of velocities in the disk between and kpc.
The simulated galaxy has significantly lower angular momentum than late type spirals of comparable rotation speed, due in part to the transfer of angular momentum from baryons to dark matter during mergers. Indeed, within the virial radius the dark matter component has twice as much angular momentum as the baryons, as indicated by the filled diamond labeled “DM” in Figure 12. The disagreement is deepened by the high concentration of the luminous component, which drives the rotation speed of the disk , km s-1, up by a factor of over the virial velocity of the dark matter halo, km s-1.
One important qualification to the angular momentum problem is that specific angular momenta are quite difficult to measure observationally, and that the observational data shown in Figure 12 assume that the luminous material is distributed in an exponential disk with a flat rotation curve, for which . Computing the angular momentum in the same manner leads to a much higher estimate of the angular momentum of the simulated galaxy; for kpc and km s-1 we find km s-1 kpc (for , see solid square labeled “disk” in Figure 12). In other words, the size of the disk component, estimated from the disk/spheroid photometric decomposition discussed in § 3.2, is similar to that of late type spirals of comparable rotation speed. Were the angular momentum of the simulated galaxy not weighed down by the massive, slowly-rotating spheroidal component, it would match well that of observed spirals. This provides further evidence that the difficulty in reconciling the properties of the simulated galaxy with that of observed spirals lies in the presence of the dense, slowly-rotating spheroid that dominates the luminous stellar component.
Finally, we note that the angular momentum of all star particles formed after the last episode of major merging (i.e., younger than Gyrs at ) is Gyr km s-1 kpc, about a factor of lower than obtained from the estimator. This again highlights the importance of analyzing observations and simulations using similar techniques, as well as the crucial role that simulations with numerical resolution high enough to allow for the proper identification of disk and spheroidal components will play in resolving the angular momentum problem of disk galaxies.
3.4.2 Tully-Fisher relation
A powerful diagnostic of the success of simulated galaxies in reproducing observation comes from comparing their luminosity and characteristic velocity with the scaling relations linking these properties in galaxies of various types. The -band Tully-Fisher relation of late type spirals is shown in Figure 13, together with the “best fit” power-law advocated by Giovanelli et al. (1997, data shown are compiled from that study as well as from those of Mathewson, Ford & Buchhorn (1992) and Han & Mould 1992). The simulated galaxy (solid circle) is seen to lie significantly below the mean relation, about magnitude fainter than most late-type spirals of similar rotation speed.
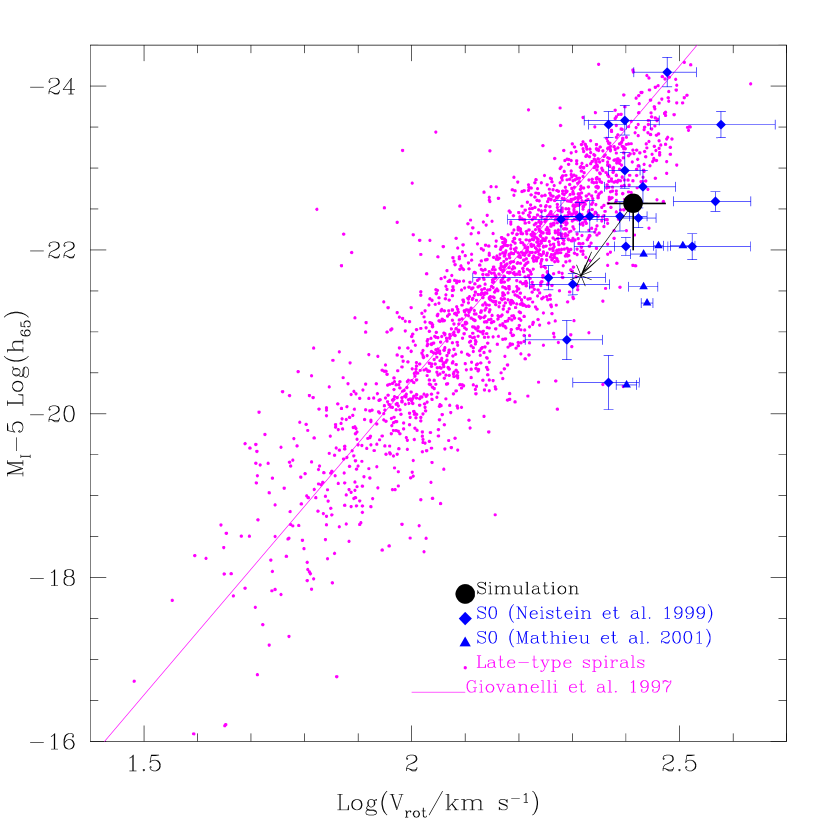
As discussed in § 3.4.1, a more telling description of the discrepancy is to consider the offset as due to the increase in circular velocity resulting from the presence of the highly-concentrated spheroidal component. For example, if the spheroid was removed then the circular velocity at would change from km s-1 to km s-1 (obtained by adding the stellar disk, gas, and dark matter contributions, see Figure 9b). This shift would be enough to explain much of the velocity offset between the simulated galaxy and late-type disks seen in Figure 13. It also suggests that the presence of a highly-concentrated spheroidal component in early type galaxies raise the rotation speed of the luminous material, with the consequent systematic offset in the Tully-Fisher relation. Such interpretation is consistent with Tully-Fisher data of spheroid-dominated S0 galaxies, which show a similar offset relative to late-type disks (see filled triangles and diamonds in Figure 13), and shares the trend towards higher /lower reported by Kannappan, Fabricant & Franx (2002) in early type spirals.
4 Discussion
The analysis described above provides direct confirmation that the origin of the major photometric and dynamical components of spiral galaxies may be traced to the mode and timing of their mass accretion history. Stars formed before the merging activity of the galaxy is over assemble into a slowly-rotating, centrally concentrated spheroid that extends out to several hundred kpc. Gas accreting later settles into a thin, centrifugally supported disk of size dictated by the available angular momentum and by the circular speed of the system. Structurally, the stellar distribution in the simulated galaxy resembles that of observed spirals, as demonstrated by the similarity in color and surface brightness to Sab galaxy UGC615.
Overall, this should be regarded as a success for the CDM scenario, albeit a modest one, given that our simulation highlights as well a number of concerns regarding the general viability of hierarchical galaxy formation models. Two major (and related) ones refer to: (i) the prevalence of the dense spheroidal component in the dynamics of the galaxy, and (ii) the dominance of old stars in the stellar population of the system. Both concerns are rooted in the rather lively merging history of the galaxy as well as in the high efficiency of gas cooling within the earliest collapsing progenitors. These are common features in the formation process of a galaxy assembled hierarchically, and lead to a dominant spheroidal component even in a system (such as the one considered here) chosen on the basis of its quiet accretion history at late times. This underlines the concern that the frequency of spheroids and the age distribution of stars may actually be inconsistent with the typical collapse and merging history of galaxy-sized CDM halos.
On a more optimistic note, our simulation does also provide convincing evidence that these shortcomings might be resolved by adopting a feedback recipe that is more efficient at preventing the transformation of gas into stars in early collapsing progenitors. Indeed, as discussed in § 3.4, the disk component on its own (disregarding the spheroid) has properties which agree rather well with those of late-type spirals. Stripped of the spheroid, the simulated galaxy would have a circular velocity speed of km s-1; a specific angular momentum of km s-1 kpc; and a total -band magnitude of (see Table 1).
The angular momentum (size) and velocity of the disk would be in good agreement with observation, as shown by the arrow in Figure 12 which points to the location of the galaxy after removal of the spheroid. The location of the galaxy in the Tully-Fisher relation is less affected by this exercise (the galaxy moves parallel to the observed relation, as shown by the arrow in Figure 13), perhaps signaling the need for genuinely lower stellar mass-to-light ratios (see Eke, Navarro & Steinmetz 2001 and § 3.3). Finally, eliminating the spheroid would remove the sharp central increase and subsequent decline in the rotation curve, improving agreement with observation (see Figure 9b).
Although this exercise is rather crude (it assumes, for example, that the dark matter distribution would not be affected by the removal of the spheroid, which is clearly not fully accurate) it still serves to illustrate that the properties of the disk component, most of which is assembled after , compares favorably with those of late-type spirals. We conclude that full agreement with observation seems to demand a mechanism that prevents the swift transformation of gas into stars in early collapsing clumps and even perhaps allows for the selective loss of this low angular momentum material, as argued by NS00b. Preliminary, but encouraging, results in this direction have recently been reported by Sommer-Larsen, Götz and Portinari (2002) with feedback schemes where the efficiency of the energetic input increases with redshift. Progress in modeling galaxy formation in a CDM cosmogony thus appears to hinge on finding and implementing a realistic and physically compelling description of star formation and feedback.
5 Summary
We present a detailed analysis of the dynamical and photometric properties of a disk galaxy simulated in the CDM scenario. The simulation is fully 3-dimensional and includes the gravitational and hydrodynamical effects of dark matter, gas and stars. Star formation is modeled through a simple recipe that transforms cold, dense gas into stars at a rate controlled by the local gas density. Energetic feedback from stellar evolution is included, and calibrated to match observed star formation rates in isolated disk galaxy models.
Our main results may be summarized as follows:
-
•
The galaxy is assembled through a number of high-redshift mergers followed by a rather quiescent period after . Our implementation of feedback is rather inefficient at preventing stars from forming profusely in early collapsing progenitors; of the present-day stars have already formed by and of them by .
-
•
At , the of stars in the galaxy are distributed between two easily discernible components: a spheroid composed mainly of older stars and a rotationally-supported disk of young stars. The surface brightness profile can be fit adequately by the superposition of an spheroid and an exponential disk; approximately half of the total light comes from each component, although less than about a quarter of the stars form after the last major merger. This reflects the higher luminosity output of the younger stars that make up the disk component.
-
•
The stellar component has a mild age and color gradient, becoming bluer and younger farther from the center: the luminosity-weighted age drops from Gyr at kpc to Gyr at kpc and its color drops from to in the same radial range.
-
•
Photometrically, the simulated galaxy closely resembles the nearby Sab galaxy UGC615 but their dynamical properties differ significantly. The simulated galaxy rotates faster and has a declining rotation curve dominated by the spheroid near the center. The decline in the circular velocity is at odds with observation and results from the high concentration of the dark matter and stellar components, as well as from the relatively high mass-to-light ratio of the stars.
-
•
The simulated galaxy lies mag off the I-band Tully-Fisher relation of late-type disks, but is in reasonable agreement with Tully-Fisher data on S0 galaxies, suggesting that the systematic offset in the Tully-Fisher relation of early-type spirals is due to the increase in circular speed caused by the presence of the spheroidal component.
-
•
The luminous component has a specific angular momentum well below that of late-type spirals of similar rotation speed, in agreement with previous simulation work. This reflects mainly the importance of the slowly-rotating spheroidal component; the exponential scalelength of the disk ( kpc) is actually comparable to that of late-type spirals of similar rotation speed ( km s-1).
Most discrepancies with observation may be traced to the dominance of the massive, dense, and slowly-rotating spheroidal component. On its own, the disk component has properties rather similar to those of late-type spirals: its exponential scalelength, colors, and luminosity are all in reasonable agreement with galaxy disks of similar rotation speed. Taken together, these results lend support to the view that multi-component disk galaxies are formed naturally in hierarchically clustering scenarios, where spheroids are the result of mergers and disks of quiescent accretion.
Some worries remain, however, that fine tuning may be needed to reconcile model predictions with observation. In particular, the early collapse and high merging rates characteristic of scenarios such as CDM might be difficult to reconcile with the abundance of “pure disk” galaxies observed in the local Universe, unless feedback is able to hinder star formation in high-redshift progenitors much more efficiently than in the modeling we present here. Accounting for the morphologies and abundance of galaxies in the CDM paradigm will likely require a better understanding of the way gas cooling and accretion and star formation couple together, especially at high redshift. Unraveling the puzzle of galaxy formation in a hierarchically clustering universe remains a tantalizingly close, yet elusive, proposition.
References
- Adelberger, Steidel, Shapley & Pettini (2002) Adelberger K.L., Steidel C.C., A.E. Shapley A.E., & Pettini M. 2002, astro-ph/0210314
- Bahcall, Ostriker, Perlmutter, & Steinhardt (1999) Bahcall, N. A., Ostriker, J. P., Perlmutter, S., & Steinhardt, P. J. 1999, Science, 284, 1481
- Barnes & White (1984) Barnes, J. & White, S. D. M. 1984, MNRAS, 211, 753
- Binney & Merrifield (1998) Binney, J. & Merrifield, M. 1998, Galactic astronomy / James Binney and Michael Merrifield. Princeton, NJ : Princeton University Press, 1998. (Princeton series in astrophysics)
- Blumenthal, Faber, Flores, & Primack (1986) Blumenthal, G. R., Faber, S. M., Flores, R., & Primack, J. R. 1986, ApJ, 301, 27
- Bode, Ostriker, & Turok (2001) Bode, P., Ostriker, J. P., & Turok, N. 2001, ApJ, 556, 93
- Boroson (1981) Boroson, T. 1981, ApJS, 46, 177
- Charlot & Fall (2000) Charlot, S. ;. & Fall, S. M. 2000, ApJ, 539, 718
- Cole, Lacey, Baugh, & Frenk (2000) Cole, S., Lacey, C. G., Baugh, C. M., & Frenk, C. S. 2000, MNRAS, 319, 168
- Contardo, Steinmetz, & Fritze-von Alvensleben (1998) Contardo, G., Steinmetz, M., & Fritze-von Alvensleben, U. 1998, ApJ, 507, 497
- Courteau (1997) Courteau, S. 1997, AJ, 114, 2402
- Eke, Navarro, & Steinmetz (2001) Eke, V. R., Navarro, J. F., & Steinmetz, M. 2001, ApJ, 554, 114
- Evrard, Summers, & Davis (1994) Evrard, A. E., Summers, F. J., & Davis, M. 1994, ApJ, 422, 11
- Freeman (1970) Freeman, K. C. 1970, ApJ, 160, 811
- Fukugita, Hogan, & Peebles (1998) Fukugita, M., Hogan, C. J., & Peebles, P. J. E. 1998, ApJ, 503, 518
- Gallego, Zamorano, Aragon-Salamanca, & Rego (1995) Gallego, J., Zamorano, J., Aragon-Salamanca, A., & Rego, M. 1995, ApJ, 455, L1
- Gerritsen (1997) Gerritsen, J. P. E. 1997, Ph.D. Thesis, University of Gröningen.
- Giovanelli et al. (1997) Giovanelli, R., Haynes, M. P., Herter, T., Vogt, N. P., Wegner, G., Salzer, J. J., da Costa, L. N., & Freudling, W. 1997, AJ, 113, 22
- Governato et al. (2002) Governato, F., Mayer, L., Wadsley, J., Gardner, J.P., Willman, B., Hayashi, E., Quinn, Stadel, J., & Lake, G. 2002, astro-ph/0207044
- Han & Mould (1992) Han, M. & Mould, J. R. 1992, ApJ, 396, 453
- Hubble (1926) Hubble, E. P. 1926, ApJ, 64, 321
- Jansen, Franx, Fabricant, & Caldwell (2000) Jansen, R. A., Franx, M., Fabricant, D., & Caldwell, N. 2000, ApJS, 126, 271
- Kannappan, Fabricant, & Franx (2002) Kannappan, S. J., Fabricant, D. G., & Franx, M. 2002, AJ, 123, 2358
- Katz (1992) Katz, N. 1992, ApJ, 391, 502
- Katz & Gunn (1991) Katz, N. & Gunn, J. E. 1991, ApJ, 377, 365
- Katz, Weinberg, & Hernquist (1996) Katz, N., Weinberg, D. H., & Hernquist, L. 1996, ApJS, 105, 19
- Kauffmann, White, & Guiderdoni (1993) Kauffmann, G., White, S. D. M., & Guiderdoni, B. 1993, MNRAS, 264, 201
- Kennicutt (1998) Kennicutt, R. C. 1998a, ARA&A, 36, 189
- Kennicutt (1998) Kennicutt, R. C. 1998b, ApJ, 498, 541
- Larson (1977) Larson, R. B. 1977, American Scientist, 65, 188
- Lilly et al. (1998) Lilly, S. et al. 1998, ApJ, 500, 75
- MacArthur, Courteau, & Holtzman (2002) MacArthur, L.A., Courteau, S., & Holtzman, J.A. 2002, astro-ph/0208404
- Mac Low & Ferrara (1999) Mac Low, M. & Ferrara, A. 1999, ApJ, 513, 142
- Marri & White (2002) Marri, S., & White, S.D.M. 2002, astro-ph/0207448
- Martin (1999) Martin, C. L. 1999, ApJ, 513, 156
- Mathewson, Ford, & Buchhorn (1992) Mathewson, D. S., Ford, V. L., & Buchhorn, M. 1992, ApJS, 81, 413
- Mathieu, Merrifield, & Kuijken (2002) Mathieu, A., Merrifield, M. R., & Kuijken, K. 2002, MNRAS, 330, 251
- Mihos & Hernquist (1996) Mihos, J. C. & Hernquist, L. 1996, ApJ, 464, 641
- Navarro (1998) Navarro, J. F. 1998, astro-ph/9807084
- Navarro & Benz (1991) Navarro, J. F. & Benz, W. 1991, ApJ, 380, 320
- Navarro, Frenk, & White (1995) Navarro, J. F., Frenk, C. S., & White, S. D. M. 1995, MNRAS, 275, 56
- Navarro & Steinmetz (1997) Navarro, J. F. & Steinmetz, M. 1997, ApJ, 478, 13
- Navarro & Steinmetz (2000) Navarro, J. F. & Steinmetz, M. 2000a, ApJ, 528, 607
- Navarro & Steinmetz (2000) Navarro, J. F. & Steinmetz, M. 2000b, ApJ, 538, 477 (NS00b)
- Navarro & White (1993) Navarro, J. F. & White, S. D. M. 1993, MNRAS, 265, 271
- Navarro & White (1994) Navarro, J. F. & White, S. D. M. 1994, MNRAS, 267, 401
- Neistein, Maoz, Rix, & Tonry (1999) Neistein, E., Maoz, D., Rix, H., & Tonry, J. L. 1999, AJ, 117, 2666
- Power et al. (2002) Power, C., Navarro, J.F., Jenkins, A., Frenk, C.S., White, S.D.M., Springel, V., Stadel, J. and Quinn, T. 2002, astro-ph/0201544
- Rubin, Burstein, Ford, & Thonnard (1985) Rubin, V. C., Burstein, D., Ford, W. K., & Thonnard, N. 1985, ApJ, 289, 81
- Sanders & Mirabel (1996) Sanders, D. B. & Mirabel, I. F. 1996, ARA&A, 34, 749
- Schechter & Dressler (1987) Schechter, P. L. & Dressler, A. 1987, AJ, 94, 563
- Somerville & Primack (1999) Somerville, R. S. & Primack, J. R. 1999, MNRAS, 310, 1087
- Sommer-Larsen & Dolgov (2001) Sommer-Larsen, J. & Dolgov, A. 2001, ApJ, 551, 608
- Sommer-Larsen, Götz & Portinari (2002) Sommer-Larsen, J., Götz, M., & Portinari, L. 2002, astro-ph/0204366
- Spergel & Steinhardt (2000) Spergel, D. N. & Steinhardt, P. J. 2000, Physical Review Letters, 84, 3760
- Springel (2000) Springel, V. 2000, MNRAS, 312, 859
- Steidel et al. (1999) Steidel, C. C., Adelberger, K. L., Giavalisco, M., Dickinson, M., & Pettini, M. 1999, ApJ, 519, 1
- Steinmetz (1996) Steinmetz, M. 1996, MNRAS, 278, 1005
- Steinmetz & Mueller (1994) Steinmetz, M. & Mueller, E. 1994, A&A, 281, L97
- Steinmetz & Muller (1995) Steinmetz, M. & Muller, E. 1995, MNRAS, 276, 549
- Steinmetz & Navarro (2002) Steinmetz, M., & Navarro, J. F. 2002, NewA, 7, 155
- Thacker & Couchman (2000) Thacker, R. J. & Couchman, H. M. P. 2000, ApJ, 545, 728
- Thacker & Couchman (2001) Thacker, R. J. & Couchman, H. M. P. 2001, ApJ, 555, L17
- Toomre (1974) Toomre, A. 1974, IAU Symp. 58: The Formation and Dynamics of Galaxies, 58, 347
- Toomre & Toomre (1972) Toomre, A. & Toomre, J. 1972, ApJ, 178, 623
- Weil, Eke, & Efstathiou (1998) Weil, M. L., Eke, V. R., & Efstathiou, G. 1998, MNRAS, 300, 773
- White & Frenk (1991) White, S. D. M. & Frenk, C. S. 1991, ApJ, 379, 52
- White & Rees (1978) White, S. D. M. & Rees, M. J. 1978, MNRAS, 183, 341
| Band | [] | [] | |||||
|---|---|---|---|---|---|---|---|
| [] | [] | [kpc] | [kpc2] | [] | [kpc] | [kpc2] | |
Note. — Luminosities and radii assume face-on projection, and a Scalo Initial Mass Function.
| Radius | ||||||||
|---|---|---|---|---|---|---|---|---|
| [kpc] | [] | [km s-1] | [km s-1 kpc] | |||||
Note. — All quantities are measured within the radii given in column [1] and assume . The virial radius is kpc. The mass per particle is for the dark matter. In total, there are dark matter particles within kpc. Before any star formation takes place the gas particle mass is . There are star particles within kpc, not all of the same mass; the average star particle mass is .
| Band | Luminosity | Magnitude | ||
|---|---|---|---|---|
| [] | [face-on] | [edge-on] | ||
Note. — Luminosities are measured within kpc. Magnitudes and radii assume and a Scalo Initial Mass Function with upper and lower mass cutoffs of and , respectively. Radii are projected half-light radii and are given in kpc.