Low-Redshift Damped Lyman Alpha Galaxies Toward the Quasars B2 0827+243, PKS 0952+179, PKS 1127145, and PKS 1629+12011affiliation: Based on observations obtained with the 3.5m WIYN Telescope on Kitt Peak, operated for the NSF by the Association of Universities for Research in Astronomy (AURA), Inc. (WIYN is a joint facility of University of Wisconsin, Indiana University, Yale University, and NOAO), the Infrared Telescope Facility, which is operated by the University of Hawaii under a cooperative agreement with the National Aeronautics and Space Administration, the Hiltner 2.4m Telescope on Kitt Peak, operated by MDM Observatory (this is a joint facility of University of Michigan, Dartmouth College, Ohio State University, and Columbia University), and the 3.6m European Southern Observatory New Technology Telescope on La Silla, Chile.
Abstract
We present optical and near-infrared ground-based imaging results on four low-redshift damped Ly (DLA) galaxies. The corresponding DLA systems were discovered in our Hubble Space Telescope spectroscopic surveys for DLA lines in known strong Mg II absorption-line systems toward the quasars B2 0827+243 (), PKS 0952+179 (), PKS 1127145 (), and PKS 1629+120 (). Two of the four DLA galaxies have confirmed slit redshifts, one has a photometric redshift consistent with the absorption-line redshift, and the fourth identification is based on the galaxy’s proximity to the quasar sight line. The DLA galaxies span a mixture of morphological types from patchy, irregular, and low surface brightness to spiral galaxies. The luminosities range from to . We also discovered several extremely red objects (EROs) in two of these fields and discuss the possibility that they are associated with the DLA galaxies. These observations add to the small but growing list of DLA galaxies at low redshift. At the present time, 14 DLA galaxies in the redshift range have been studied. The distributions of DLA galaxy properties for these 14 cases are discussed and some important trends emerge. Low-luminosity dwarf galaxies with small impact parameters dominate this small sample. Also, four of the five highest column density systems, which dominate in the determination of the cosmological neutral gas mass density, arise in low surface brightness dwarf galaxies. Zwaan et al. have shown that only 15% of the neutral gas at the present epoch is contained in low surface brightness galaxies. Thus, if the low-redshift DLA galaxy trends hold up with larger samples, it would indicate that a different population of objects is responsible for the bulk of the neutral hydrogen gas in the universe at .
Subject headings:
quasars: absorption lines — quasars: individual (B2 0827+243, PKS 0952+179, PKS 1127145, PKS 1629+120)1. Introduction
Surveys for damped Ly (DLA) absorption lines in the spectra of quasi-stellar objects (QSOs), or quasars, have been used to study the distribution of neutral hydrogen in the universe (e.g. Wolfe et al. 1986; Lanzetta et al. 1991; Rao & Turnshek 2000, henceforth RT2000). These studies indicate that the DLA systems, historically defined to have atoms cm-2, trace the bulk of the neutral gas mass in the universe up to at least redshift . At , inclusion of lower systems in the sub-DLA regime may be necessary to encompass the bulk of the H I mass (Péroux et al. 2001). In either case, study of the DLA systems reveals the H I gas production and consumption history over a large fraction of the age of the universe. Thus, DLA galaxies, which are identified by virtue of their H I gas cross sections, are the only population of cosmological objects that simultaneously reveal information relevant to both star formation and H I gas production and consumption, making them crucial for understanding the evolutionary history of neutral gas. Galaxies selected in optical/IR surveys are generally only used to track the star formation history of the universe (see, e.g., Madau, Pozzetti, & Dickinson 1998). How these two distinctly selected populations (i.e., H I cross section-selected versus optical/IR-selected) are related is as yet unclear.
Ground-based imaging of high-redshift DLA galaxies has had limited success, either because the quasar point spread function (PSF) prevents the detection of objects very close to the quasar sight line, or because the DLA galaxy is simply too faint, or both. In addition, the faintness of any candidates close to the quasar sight line makes it difficult to obtain confirming redshifts. Imaging of high-redshift DLA galaxies with the Hubble Space Telescope (HST) has been more successful at identifying faint candidates close to the quasar sight lines, but only a few of these have confirmed redshifts. See Warren et al. (2001 and references therein) for details. The main conclusion of these studies has been that most high-redshift DLA galaxies are underluminous in comparison to the Lyman break galaxy population.
Morphologies, colors, and stellar populations of low-redshift DLA galaxies can be more easily studied, but progress has been slow mainly because of their rarity. HST observations along many quasar sight lines in traditional spectroscopic survey mode are needed to find a single DLA at (see, e.g., Jannuzi et al. 1998). However, since it is known from optical studies that all high-redshift DLA systems have accompanying Mg II absorption, we have to a large extent circumvented this problem in our HST surveys by targeting quasars known to have Mg II absorption lines in their spectra (Rao, Turnshek, & Briggs 1995; RT2000). We reasoned that if this held at high redshift, it would also be the case at low redshift since galaxies only increase their metallicities with age. In fact, during the course of this work we uncovered a new empirical criterion for finding DLA systems. Approximately half of the systems with Mg II rest equivalent width Å, as well as Fe II Å, have DLA absorption (RT2000), and the number of DLA systems that do not meet this criterion appears to be insignificant. As a result, these targeted surveys have now nearly tripled the number of DLA systems known at to , which is in comparison to the at that have been discovered and confirmed in optical quasar spectra. Of course, once the strong Mg II-Fe II criterion is used to identify low-redshift DLA candidate systems at , HST UV spectroscopy is still required to obtain a reasonably precise measurement of , which is then used to confirm or refute the candidate as lying in the DLA regime.
The few published imaging studies of low-redshift () DLA galaxies have revealed a mix of morphological types. Burbidge et al. (1996) obtained HST images along the sight line towards the BL Lac object AO 0235+165, which contains a DLA system selected on the basis of 21 cm absorption; they found a significant number of galaxies near the sight line, including an active galactic nucleus (AGN) that has broad absorption line (BAL) features and a fainter, late-type galaxy. Both of these objects are at the DLA redshift, but the late-type galaxy has a smaller impact parameter. Le Brun et al. (1997) presented HST images of six low-redshift DLA galaxies that included spirals, low surface brightness (LSB) galaxies, and compact objects, with luminosities ranging from to . Three of these six were selected on the basis of 21 cm absorption. In another case, no evidence for a galaxy at the DLA redshift toward the quasar 3C 336 was found, despite very deep ground-based and HST imaging (Steidel et al. 1997; Bouché et al. 2001). Also, previously, we presented results on two DLA galaxies toward the quasar OI 363 at redshifts and (Rao & Turnshek 1998; Turnshek et al. 2001). The galaxy is an LSB galaxy with apparent spiral structure nearly centered on the quasar sight line, while the galaxy is an early-type dwarf spiral at an impact parameter of 20 kpc. Here, we present more ground-based imaging results on three low-redshift DLA systems, which we discovered in our HST Cycle 6 survey toward the quasars B2 0827+243, PKS 0952+179, and PKS 1127145, as well as one new DLA system which we discovered in our HST Cycle 9 survey toward the quasar PKS 1629+120. We continue to find that the DLA galaxies are drawn from a mix of morphological types, but, with the increased total sample size, observed trends are becoming more compelling. In the last section of this paper, we summarize results from imaging studies of a cosmological sample () of 14 DLA galaxies with known at the time of publication.
The paper is organized as follows. Details of our observations are given in §2. The identification of the DLA galaxies, their photometric properties, and some details of the fields containing the four new low-redshift DLA galaxies are described in §3. A discussion and the conclusions are presented in §4. All distance related quantities are calculated using a cosmology with , , and km s-1 Mpc-1. When luminosities are expressed in terms of , we assume (Marinoni et al. 1999), (Lin et al. 1996), and (Loveday 2000), where the magnitudes have been converted to our adopted cosmology.
2. Observations
The four quasar fields were observed during the period between 1998 December and 2001 June. Optical images were obtained with the MDM Observatory 2.4m Hiltner Telescope on Kitt Peak, using the Templeton CCD (0.285 pixel-1), and with the 3.5m WIYN telescope on Kitt Peak. Observations with the WIYN telescope were made in both classical scheduling mode, using the Mini-Mosaic SITe CCD pair (0.141 pixel-1), and queue mode, by the WIYN queue observing team using a Tektronix CCD (0.195 pixel-1). The near-infrared images were obtained at the 3.0m NASA IRTF on Mauna Kea, using NSFCAM in combination with a InSb detector array (0.30 pixel-1), and the 3.6m ESO NTT on La Silla, using SOFI, which uses a HgCdTe detector array (0.292 pixel-1). The images were processed using the recommended procedures, and standard-star observations were used to calibrate the photometry. The observations are summarized in Table 1. We note that some of the observations listed in Table 1 were taken under less than ideal conditions, but were still useful for confirmation of some of the derived results. Some of the images were smoothed to enhance LSB features, and these are shown in §3. The smoothing was performed using a Gaussian with pixel. On average, this degraded the seeing by 20%. The smoothed images were used to delineate the LSB features and set the aperture for doing the photometry, but photometric measurements were made on the unsmoothed images. Faint features in the smoothed images were deemed real if they were detected in at least two filters at greater than a level of significance. Limiting surface brightnesses and seeing measurements for the final combined (unsmoothed) images used in the analysis presented here are given in Table 2.
| QSO Field | Filter | Telescope | Observation | Exp. Time |
|---|---|---|---|---|
| Dates | (m) | |||
| B2 0827+243 | U | MDM | 1999 Nov 13,14 | 100 |
| B | WIYN | 1999 Jan 18 | 54 | |
| R | WIYN | 1999 Jan 18 | 15 | |
| I | MDM | 1999 Nov 14 | 28 | |
| K | IRTF | 1999 Apr 27 | 62 | |
| PKS 0952+179 | U | MDM | 1999 Feb 1720 | 180 |
| B | MDM | 1999 Feb 18,20 | 60 | |
| R | MDM | 1999 Feb 19,20 | 75 | |
| R | WIYN | 1999 Mar 20 | 27 | |
| J | NTT | 1999 Jan 02 | 60 | |
| Ks | NTT | 1999 Jan 02 | 60 | |
| K | IRTF | 1998 Dec 12 | 20 | |
| K | IRTF | 2000 Mar 06 | 63 | |
| PKS 1127145 | U | MDM | 1999 Feb 18,19 | 120 |
| B | MDM | 1999 Feb 19,20 | 60 | |
| R | MDM | 1999 Feb 1820 | 80 | |
| I | MDM | 1999 Nov 13 | 14 | |
| I | MDM | 2001 Feb 26 | 30 | |
| J | NTT | 1999 Jan 02 | 80 | |
| K | IRTF | 1998 Dec 13 | 60 | |
| K | IRTF | 1999 Apr 28 | 63 | |
| PKS 1629+120 | U | WIYN | 2001 Jun 25,27 | 60 |
| B | MDM | 2000 Sep 29 | 45 | |
| R | MDM | 2000 Sep 29,30 | 45 | |
| J | IRTF | 2000 Sep 30 | 50 | |
| K | IRTF | 2000 Sep 29 | 60 |
3. DLA Galaxy Identification and Photometry
As detailed below, two of the DLA galaxies have confirmed slit redshifts, one has a photometric redshift consistent with the DLA absorption redshift, and one is identified based on its proximity to the quasar sight line. It should be kept in mind that the degree of confidence for any “identification” of a DLA galaxy is variable, with the confidence being highest when the candidate DLA galaxy has a low impact parameter to the QSO sight line and there is a confirming slit spectrum showing that it is at the DLA system redshift. However, even when the confidence is relatively high, it is possible that a fainter galaxy or a galaxy with a smaller impact parameter, might be the actual DLA absorber. We proceed with the assumption that a neutral gas cloud (or clouds along the line of sight) associated with the galaxy we identify as the DLA galaxy is the site of the DLA absorption.
When possible, bright stars in the field were used to model the quasar PSF, which was then subtracted before any photometric measurements were made. This was sometimes not possible in the IRTF images since there were no bright stars in the small field of view (77″) and no PSF star was observed separately.
3.1. B2 0827+243
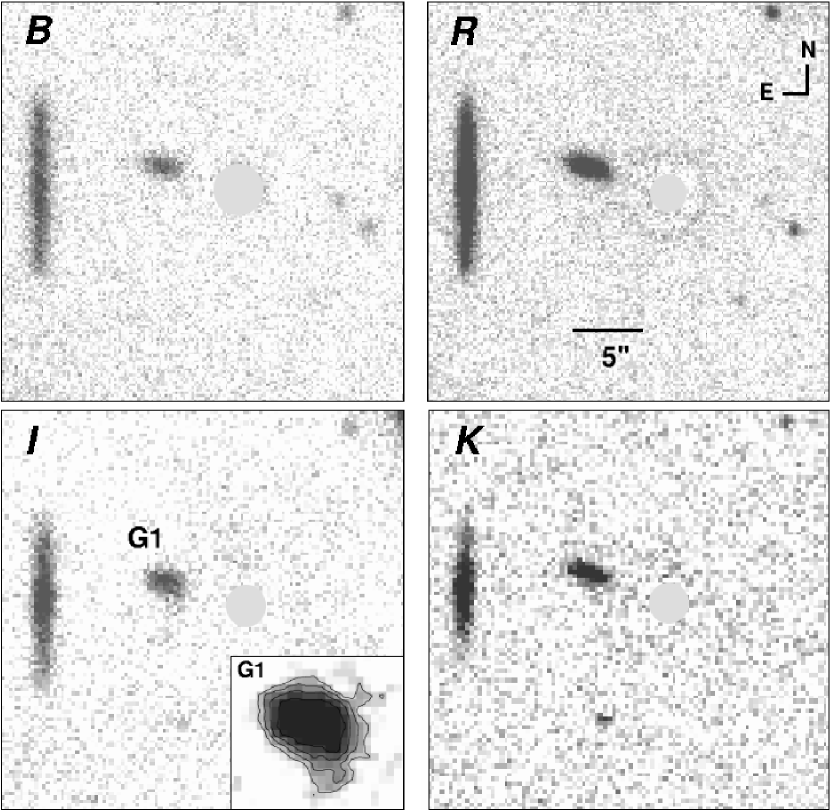
This quasar sight line contains a DLA system at with column density atoms cm-2 (RT2000). Figure 1 shows 30″ 30″ , , , and images of this field. The quasar PSFs have been subtracted and the residuals masked out. The galaxy 6″ to the east of the sight line, labeled G1, is identified as the DLA galaxy. Steidel et al. (2002) report a spectroscopic redshift of for G1. They also present an HST-WFPC2 F702W image of this field and note the possible presence of a satellite galaxy ″ west-northwest of the center of G1. We a posteriori found a hint of a southwestern extension to G1 in our smoothed -band image (see inset in Fig. 1). Of course, our -band image was obtained in 1.1″ seeing, compared to the ″ seeing of the HST image. Thus, the satellite noted by Steidel et al. (2002) is unresolved and is not distinct from G1 in our ground-based image. Instead, it is possible that the southwestern extension we detect is an LSB feature of the interacting system and was not detected in the HST image. In either case, the imaging data are consistent with G1 being a disturbed spiral galaxy. Steidel et al. (2002) also present Keck spectra showing the kinematic properties of G1 and of the Mg II absorption-line system. They note that the satellite galaxy might be responsible for the apparent reversal in the direction of the radial velocity profile of G1 seen at the west end. This interaction might also be dispersing the gas out to large galactocentric radii, leading to the high H I column density of the absorbing gas and to the km s-1 wide, four-component, Mg II absorption line. The unsaturated Mg I line shows similar structure, with the central two components that are km s-1 apart being the strongest. The 21 cm absorption line has been measured at moderate spectral resolution and covers km s-1, although it is uncertain how many absorbing components might be contributing to the profile (Kanekar & Chengalur 2001a). Based on a comparison of redshift and velocity spread, it is likely that the H I absorption arises in gas associated with the two main Mg I absorbing clouds. Indeed, there is compelling evidence that strong Mg II absorbers that show 21 cm absorption are also associated with strong Mg I absorption (Lane 2000). Moreover, systems with larger Mg I rest equivalent width (or velocity spread when observed at high resolution) also have larger 21 cm line velocity spreads (Lane 2000).
Although the impact parameter of G1 is large ( kpc), its high inclination angle should increase the likelihood that DLA column densities could be observed at large galactocentric distances. But it is also possible that an object hidden under the quasar PSF might be the actual absorber. To explore this possibility, we subtracted the quasar PSF in the WFPC2 image using the procedure described in Hamilton, Casertano, & Turnshek (2002), but found no convincing evidence for a galaxy hidden under the quasar PSF.
| Field | |||||||||||||
|---|---|---|---|---|---|---|---|---|---|---|---|---|---|
| (mags/arcsec2) | (arcsec) | ||||||||||||
| B2 0827+243 | 24.0 | 25.1 | 24.1 | 22.9 | 19.6 | 1.3 | 1.0 | 0.8 | 1.1 | 0.7 | |||
| PKS 0952+179 | 24.2 | 24.8 | 24.9 | 22.2 | 20.8 | 1.2 | 1.1 | 0.7 | 0.7 | 0.9 | |||
| PKS 1127145 | 24.0 | 25.0 | 24.5 | 22.8 | 20.4 | 0.9 | 1.2 | 0.9 | 0.7 | 0.8 | |||
| PKS 1629+120 | 23.6 | 24.6 | 24.2 | 21.1 | 20.4 | 1.3 | 1.3 | 1.2 | 1.0 | 1.0 | |||
3.1.1 Photometry of G1
Photometric measurements of G1 along with uncertainties are given in Table 3. Results from stellar population spectral evolutionary synthesis model fits redshifted to are shown in Figure 2. Details of the models and fitting procedures are described in the Appendix. The best-fit single-burst model, a 0.05 Gyr old burst with , results in a reduced of 5.5. A family of two-burst models having approximately equal combinations by mass of (1) a dusty , young (0.01 Gyr) burst and (2) a nearly dust free [], 0.20.6 Gyr old burst have the smallest reduced values, but these are also statistically poor fits with reduced values between 4.8 and 5.2. The fit with the smallest reduced is shown in Figure 2. Apparent magnitudes from Table 3 along with -corrections derived from this best-fit model give absolute magnitudes for G1 of , , , and at .

| Field | Object | bbRelative to QSO. | bbRelative to QSO. | ||||||
|---|---|---|---|---|---|---|---|---|---|
| ″ | ″ | ||||||||
| B2 0827+243 | G1 | +5.8 | +1.9 | 22.61 (0.16) | 22.76 (0.04) | 20.82 (0.05) | 20.34 (0.05) | 17.07 (0.05) | |
| PKS 0952+179 | 1 | +2.9 | 0.0 | 22.3 (0.2) | 21.2 (0.3) | ||||
| 2 | 1.4 | 1.8 | 23.1 (0.4) | 20.8 (0.1) | |||||
| 3 | +3.7 | 4.3 | 25.9 (0.3) | 25.2 (0.2) | 22.5 (0.3) | 20.7 (0.2) | |||
| 4 | 3.5 | +5.1 | 25.0 (0.2) | 24.5 (0.2) | 22.1 (0.2) | 20.1 (0.2) | |||
| 5 | +6.7 | 4.4 | 24.8 (0.2) | 24.0 (0.1) | 23.2 (0.4) | 20.4 (0.2) | |||
| 6 | 6.8 | +0.5 | 27.1 (0.7) | 27.1 (0.8) | 22.3 (0.3) | 20.6 (0.2) | |||
| 7 | 7.5 | 2.0 | 25.9 (0.3) | 22.0 (0.3) | 19.4 (0.1) | ||||
| 8 | 7.0 | 3.9 | 27.9 (1.6) | 25.1 (0.2) | 23.0 (0.4) | 21.8 (0.4) | |||
| 9 | 1.9 | +8.4 | 24.9 (0.2) | 24.5 (0.1) | 22.4 (0.3) | 21.0 (0.2) | |||
| 10 | 7.8 | 8.7 | 25.0 (0.2) | 24.5 (0.2) | 22.5 (0.3) | 21.2 (0.3) | |||
| PKS 1127145 | 1 | 3.8 | +0.3 | 23.00 (0.19) | 24.09 (0.15) | 22.58 (0.08) | 21.87 (0.13) | 20.64 (0.15) | |
| 2 | 2.5 | 5.8 | 23.9 | 24.8 | 24.5 | 22.02 (0.13) | 20.3 | ||
| 3 | +5.4 | 1.6 | 23.55 (0.21) | 23.68 (0.09) | 22.40 (0.07) | 20.94 (0.07) | 20.23 (0.20) | ||
| 4 | 3.2 | +7.2 | 23.93 (0.25) | 24.94 (0.17) | 24.11 (0.19) | 22.93 (0.22) | 20.96 (0.30) | ||
| PKS 1629+120 | G1 | +0.8 | 2.9 | 22.61 (0.09) | 23.15 (0.11) | 21.37 (0.04) | 19.20 (0.07) | 17.65 (0.06) |
3.2. PKS 0952+179
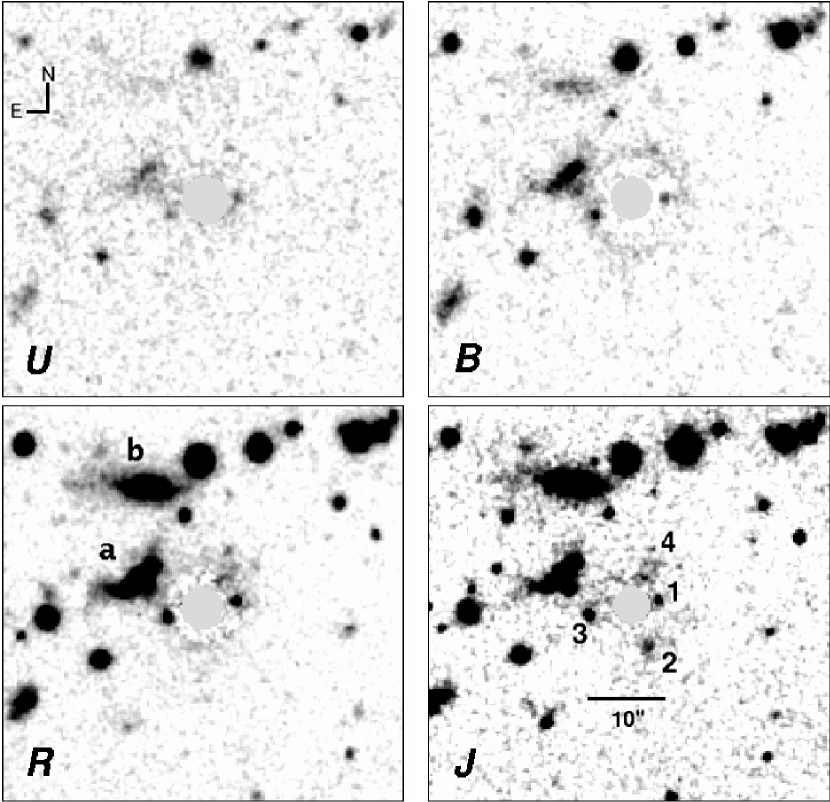
The DLA system towards this quasar is at redshift , with column density atoms cm-2 (RT2000). Figure 3 shows 20″ 20″ images of this field through the , , , and filters. The quasar PSF has been subtracted in the , , and images and the residuals have been masked out. The quasar has simply been masked out in the -band image because there were no suitable bright stars in the IRTF-NSFCAM field of view that could be used to perform a good PSF subtraction of the quasar light. All four images have been smoothed to enhance LSB features. Objects identified in the image that are detected in at least one of the , , and images have been numbered sequentially in order of increasing radial distance from the quasar. The objects labeled 1 and 2 are detected in both and and, because of their proximity to the quasar sight line, are our best candidates for the DLA galaxy. Their morphology suggests that they might be two nearly edge-on galaxies. While the image, with a seeing of 0.7″ and limiting surface brightness of 24 mag/arcsec2, is exceptionally good by ground-based imaging standards, higher resolution imaging, for example with NICMOS on HST, is required to be better able to resolve these features and, perhaps, comment on the nature of the quasar host galaxy as well (see Kukula et al. 2001). Table 3 gives the positions of the labeled objects relative to the quasar along with apparent magnitudes and uncertainties.

3.2.1 An ERO at ?
The brightest of these in , object 7, is an extremely red object (ERO) with (see Table 3). EROs are generally thought to either be elliptical galaxies at whose red colors are due to large -corrections or star forming galaxies whose red colors are due to heavily obscured stellar or AGN emission (e.g. Cimatti et al. 1999; Dey et al. 1999; Daddi et al. 2000; Smith et al. 2001). The lowest redshift ERO known is the galaxy, PDF J011423 (Afonso et al. 2001), whose red colors and spectral energy distribution (SED) are consistent with its being a dusty starburst with 56 magnitudes of optical extinction. Other EROs classified as starbursts have similar dust extinctions (Afonso et al. 2001). PDF J011423 is bright in () and has extremely red colors with and . In comparison, object 7 is relatively faint with , and is also extremely red, with and . The redshift of object 7 is not known, but if it is at the DLA redshift, it would have to be a star forming region that is heavily obscured by dust. At , corresponds to , where a -band -correction of mag has been applied (Cowie et al. 1994). This implies an absolute luminosity of , comparable to the luminosity of a single star-forming region within a galaxy. We find that, based on G. Bruzual & S. Charlot (2003, in preparation) GISSEL99 galaxy spectral evolutionary synthesis models, its colors can be attributed to a region of star formation with age Gyr at , if the extinction is . Thus, the luminosity, colors, and implied extinction are consistent with object 7 being at . If confirmed, it would be the lowest redshift ERO known.
However, the observational constraints are not tight enough to rule out the possibility that object 7 is a higher redshift elliptical galaxy. Its colors fall on the “starburst” side, but near the edge, of the versus plane used to classify EROs (Pozzetti & Mannucci 2000). Uncertainties in our photometry, as well as in the definition of the plane, do not preclude object 7 from crossing the plane and being classified as a passively-evolving elliptical galaxy at (Cimatti et al. 1999). In this case, object 7 might be part of a cluster of galaxies that also includes the quasar PKS 0952+179 (); it would be at this redshift. We detect a significant number of EROs in the extended 5′5′ field surrounding this quasar (D. B. Nestor et al. 2003, in preparation), and this might be supporting evidence for the overdensity of EROs found by Cimatti et al. (2000) around radio-loud quasars. Thus, the proximity of object 7 to the DLA galaxy might just be a coincidence.
3.2.2 The DLA Galaxy
While the nature of none of the objects labeled in Figure 3 is known for certain, it is of interest to examine the possibility that they are star-forming regions associated with the DLA galaxy. The colors of all the labeled features are consistent with them being at , but with varying degrees of obscuration. The implications might be that the DLA galaxy is either a patchy LSB galaxy or a disturbed system in which object 7 is a recently triggered star-forming region. The galaxy would extend anywhere from kpc (objects 17) to kpc (objects 57). The total luminosity of the PKS 0952+179 DLA galaxy cannot be measured, since some of it is likely to be hidden by the quasar PSF. The total luminosity of all the objects labeled in Figure 3 is . If this is considered a lower limit to the luminosity of the DLA galaxy, then or . If only objects 1 and 2 were part of the DLA galaxy, it would extend kpc, with , , and . If objects 1 and 2 were two edge-on galaxies, as their -band morphologies might suggest, then possibly half of the galaxy that is object 1 is obscured by the quasar PSF. In this case, each of the edge-on galaxies would be a dwarf with a luminosity on the order of .
However, in the absence of higher resolution imaging, we tentatively identify the DLA galaxy as objects 1 and 2, since these have the smallest impact parameters, and since there is no observable emission between these and objects 310. Given the assumption that half of object 1 is obscured by the quasar PSF, objects 1 and 2 have a total luminosity of . Since these objects extend into the quasar PSF, their impact parameter cannot be determined to better than the radius of the circle that encloses all residuals left over from subtracting the quasar PSF in the unsmoothed -band image. This is because subtracting the PSF resulted in noisy residuals near the PSF core, and no useful information could be extracted within this radius. The radius was measured to be 1.2″ which, at , implies kpc.
We note that luminous galaxies in the extended field surrounding this quasar have spectroscopic redshifts different from the DLA absorption redshift (Bergeron & Boissé 1991) and that the system is the only known absorption-line system in the spectrum of this quasar. High resolution observations of the Mg II absorption line do not exist, and so the kinematic structure of the Mg II-absorbing gas has not been studied in detail. However, the 21 cm absorption line is narrow with a FWHM of only 7.7 km s-1 (Kanekar & Chengalur 2001a), indicative of simple kinematic structure.
3.3. PKS 1127145
This DLA system is at with column density atoms cm-2 (RT2000). Figure 4 shows images of this field in , , , and . The quasar PSF has been subtracted in each of the four images and the residuals have been masked out. Furthermore, the images have been smoothed to enhance LSB features. The two large spiral galaxies, labeled “a” and “b”, are at the DLA redshift (Bergeron & Boissé 1991). Galaxy a is clearly warped and has a dwarf companion ″ to the southwest. Galaxy b has a faint extension towards the east that is visible in and . The object 3″ west of the quasar, labeled “1,” is an emission-line object with a confirmed redshift of (Lane et al. 1998). No emission lines were detected in the spectrum of object 3, and so its redshift is not known. However, the band image in Figure 4 suggests that there may be LSB features to the east of the quasar that extend out to the position of object 3. Thus, we identify the DLA galaxy as the patchy/irregular LSB structure visible primarily in that extends (44 kpc) in the N-S as well as E-W directions and encompasses objects 1, 2, 3, and 4. 111We note that objects in this field were discussed in Lane (2000) where galaxies a and b were labeled G1 and G2, and objects 1 and 3 were labeled G3 and G4, respectively.
Since the DLA galaxy as defined above overlaps with the quasar PSF, its impact parameter cannot be determined to better than the radius of the circle that encloses all residuals left over from subtracting the quasar PSF in the unsmoothed -band image. This radius, which we assume is an upper limit to the DLA galaxy’s impact parameter, was measured to be 1.5″, which, at , implies kpc. No useful information could be extracted within this radius. The DLA galaxy is quite possibly the remains of a dwarf galaxy (see §3.3.1) that is being tidally disrupted by the more massive spirals, and in which these four objects represent regions of recent star formation.
3.3.1 Photometry
Photometric measurements of objects 1, 2, 3, and 4 are given in Table 3 along with their uncertainties. Object 2 is below the detection limit in and has . Lower limits to the , , , and magnitudes of object 2 were measured with the same aperture size used to measure its magnitude in .
Objects 1, 3, and 4 have blue colors. Stellar population synthesis model fits to the photometry of these star-forming regions are shown in Figure 5. Details of the models are given in the Appendix. For object 1, a family of single bursts fits the data well. These have burst ages ranging from 0.1 to 0.3 Gyr and . The top panel of Figure 5 shows the best-fit model, which is a 0.2 Gyr old burst with no extinction. This fit resulted in a reduced of 1.37.

Single burst models are not a good fit to the photometry of object 3. The best fit has a high reduced of 3.80. For two-burst models the best fit, with a reduced of 1.77, is obtained when the populations are (1) an % by mass burst that is young (0.001 Gyr) and dusty, with , and (2) an % by mass burst that is 1.0 Gyr old with no dust. This two-burst model is shown in the middle panel of Figure 5.
Object 4 is well fitted by a family of single bursts having ages in the range of 0.010.05 Gyrs and . Of these, the best-fit model is a 0.01 Gyr burst with and results in a reduced of 1.01. This single-burst model is shown in the bottom panel of Figure 5.
The absolute magnitudes of the three objects were determined using the apparent magnitudes given in Table 3, along with -corrections derived from their best-fit SED. In the band, these are , , and for objects 1, 3, and 4, respectively, giving a total -band luminosity for the galaxy of or . Here, we have added the luminosities of the three features and reported the result as the luminosity of the DLA galaxy. In the band, we find absolute magnitudes , , and , with a total -band luminosity of or .
3.3.2 More EROs
Closer inspection of Figure 4 reveals many objects in this field that are relatively bright in but are below the detection limits or are very faint in . Several of these are in the vicinity of galaxy b and could well be dusty regions in which star formation is being triggered by the interaction between galaxies a and b. Their location is compelling evidence for their association with the galaxies, although the possibility that they are associated with the radio-loud, , quasar cannot be ruled out.
3.3.3 Kinematics
High resolution observations of the Mg II absorption line have not been published, but the high rest equivalent width of the 2796 Å line, Å, implies a velocity width of km s-1. The 21 cm absorption line profile of this DLA system is also complex (Lane 2000), and has been shown to vary on time scales of a few days (Kanekar & Chengalur 2001b). The 21 cm absorption line extends over 85 km s-1 and is resolved into five components. The deepest component, with optical depth , is at the low-velocity end of the profile. Prochaska & Wolfe (1997, 1998) have used simulations to show that this type of leading-edge profile is produced along a line of sight that passes through a rotating disk. On the other hand, Haehnelt, Steinmetz, & Rauch (1998), who consider gas infall due to merging, and McDonald & Miralda-Escudé (1999) who consider moving clouds in a spherical halo, have also reproduced leading-edge line profiles. In the case of the PKS 1127145 DLA system, both the image and kinematics are more consistent with the latter interpretations. However, this DLA system appears to be even more complex in its structure and kinematics, since it is not an isolated system and probably owes its morphology to the nature of its environment.
3.4. PKS 1629+120
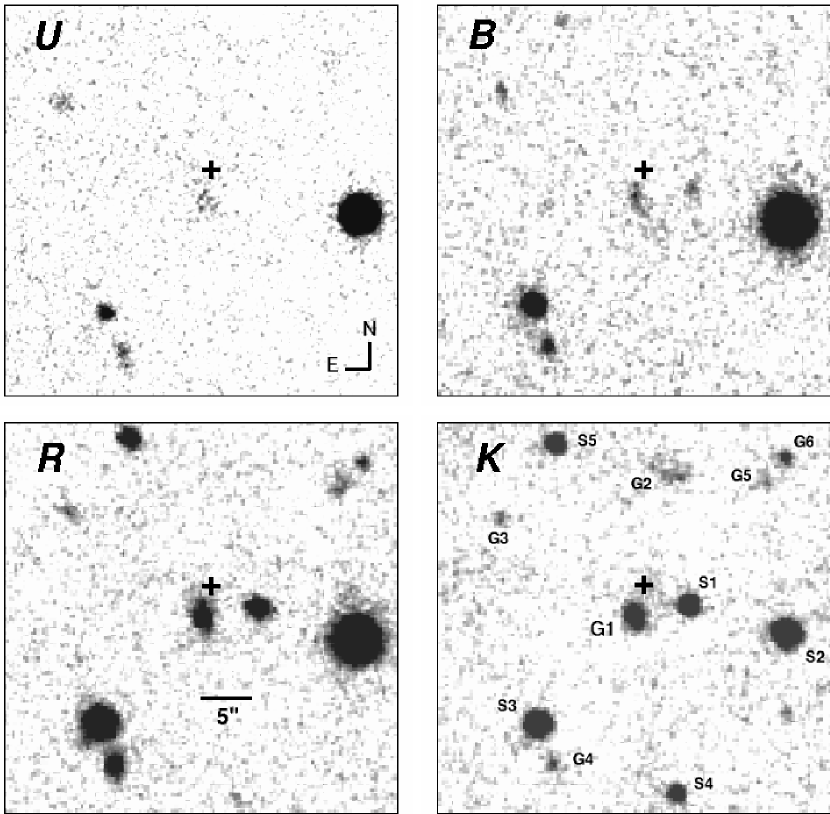
The sight line toward the quasar PKS 1629+120 (, ) contains a DLA system at with column density atoms cm-2. We discovered this system in an HST Cycle 9 survey for DLA lines in strong Mg II-Fe II absorption-line systems.


3.4.1 The UV Spectrum
Figure 6 shows the HST-STIS G230L NUV-MAMA spectrum, while Figure 7 shows a Voigt profile with column density atoms cm-2 overlaid on the DLA line. The error in the column density estimate is dominated by the uncertainty in continuum placement and was determined using a procedure similar to that described in RT2000. This line of sight has two Mg II systems, one at with Mg II Å and Fe II Å (Aldcroft et al. 1994), and one at with Mg II Å and Fe II Å (Barthel, Tytler, & Thomson 1990). The system is sub-DLA with atoms cm-2. We also detect a Ly line at 2895 Å with rest equivalent width Å that is associated with a C IV system at (Aldcroft et al. 1994). The strongest line in the blend at 2952 Å has Å; it has no known associated metal line absorption.
3.4.2 Imaging Results
Figure 8 shows 40″ 40″ , , , and images of this field. All four quasar PSFs have been subtracted, resulting in residuals that are comparable to the background in each image. The position of the quasar is marked with a plus sign. Unresolved objects are labeled with an “S” and are presumed to be stars, while resolved objects are galaxies labeled with a “G”. They are numbered in order of increasing distance from the quasar. G1 appears patchy in , possibly indicating regions of recent star formation. An edge-on, disklike structure can be seen in . It appears bulgelike in and shows signs of both bulge and disk structure in . These morphological features are consistent with G1 being a mid-type spiral galaxy. As we show below, the photometry of G1 is consistent with it being the DLA galaxy at . In this case, its impact parameter, i.e., the projected distance from the center of G1 to the center of the PSF of the quasar is kpc.
3.4.3 Photometry of G1
Photometric measurements and uncertainties of G1 are given in Table 3. These magnitudes were used to determine a photometric redshift for G1 by using the galaxy spectral templates of G. Bruzual & S. Charlot (2003, in preparation) in a principal component analysis (A. Conti 2002, private communication). The best-fit template was determined at redshifts in steps of 0.001. The resulting reduced , which was determined at each step, has a minimum equal to 0.7 at , and redshifts in the range are good fits, with reduced . The reduced at is , making approximately 30 times less probable than . Therefore, we can rule out the possibility that G1 is the sub-DLA galaxy at (see §3.4.4), and assume that G1 is the DLA galaxy at . However, we note that a slit redshift is required to unambiguously determine the redshift of G1.
We also fit stellar population synthesis models to the photometry, as described in the Appendix. The best-fit model, which results in a reduced , is shown in Figure 9. It is a single 0.05 Gyr old burst and has . The apparent magnitudes from Table 3, in combination with -corrections derived from this model give absolute magnitudes of , , , , and at .

3.4.4 The Sub-DLA Galaxy
G1 is the only galaxy detected near the quasar sight line, and we have shown that its photometry is consistent with it being the DLA galaxy. Having assumed that G1 is at , we must now consider the whereabouts of the sub-DLA galaxy. One possibility is that it, too, has a small impact parameter but is below the detection limit of all our images. A second possibility is that it lies directly along the line of sight to the quasar and was subtracted along with the quasar PSF. Third, it might be one of the galaxies detected at large impact parameter. We consider each of these in turn.
If the first possibility is true, then the galaxy must have a surface brightness of mag arcsec-2 and mag arcsec-2 at the level (see Table 2). Assuming that it is a face-on galaxy with an extent of 20 kpc, we find that and , where a -correction for an Sb-type galaxy has been applied (Poggianti 1997), or . Similarly, in the band we find and , or .
The quasar PSF was subtracted reasonably cleanly, since the PSF was well sampled by several stars brighter than the quasar in each frame. If there is a galaxy coincident on the sky with the quasar, then it would have to mimic a point source and be centered exactly on the quasar PSF. Although this is a possibility, it is highly unlikely.
Except for G1, all detected galaxies lie between 11″ and 19″ from the quasar and have impact parameters between 72 and 124 kpc at , i.e., much larger than what is typical for Mg II absorbers (Steidel 1993). The implied impact parameters at are also very large, ranging between 62 and 107 kpc. Therefore, from impact parameter considerations, these are not likely to be either of the two absorbing galaxies.
Finally, we note that if G1 was at , then the DLA galaxy, which would have gone undetected, would have to have and . Moreover G1 would have and , and it would be an unusually luminous low-redshift sub-DLA galaxy. Thus, it is more reasonable to conclude that G1 is at and that the sub-DLA galaxy is not detected in our images.
4. Discussion
The four new low-redshift DLA galaxies presented here have an interesting mix of morphologies. The two higher redshift galaxies, G1 B2 0827+243 () and G1 PKS 1629+120 () are spirals. Higher resolution HST observations of the former reveal that an interaction between the luminous spiral and a satellite dwarf galaxy might be responsible for the presence of DLA gas at larger galactocentric distances. We have, a posteriori, detected an extension to G1 in our ground-based images that might indicate the presence of a satellite. In the absence of high resolution images of the PKS 1629+120 field, we cannot offer a more detailed description of that DLA galaxy’s morphology.
Images of the two lower redshift DLA systems are more complex. Lacking higher resolution images, there are two possible identifications for the PKS 0952+179 DLA galaxy. Either it is the object(s) that overlaps with the QSO PSF in the -band image, or it is a larger, irregular dwarf galaxy with patchy structure. In the former case, it is unlikely that the luminosity of this DLA galaxy exceeds a few hundredths of . Faint, patchy morphology is also present in the DLA galaxy in the PKS 1127145 field. However, in this case numerous star-forming regions are clearly visible. These regions are blue and displaced enough from the quasar sight line that a confirming slit redshift has been obtained for one of them. Because of the appearance of this patchy irregular structure, it is likely that the nearby spiral galaxies, the closer one of which was once thought to be the DLA galaxy, are responsible for tidally disrupting the actual DLA galaxy that lies along the line of sight to the quasar. Thus, the DLA galaxy takes the form of an extended irregular structure with star-forming regions. However, the possibility that these star-forming regions are individual interacting or merging galaxies cannot be ruled out. Again, higher resolution images would be needed to clarify the situation. Whichever is the case, the total light from the DLA galaxy does not exceed .
These observations add to the small but growing list of DLA galaxies at low redshifts. Table 4 lists the status and properties (luminosity relative to , , neutral hydrogen column density, , and impact parameter, ) of galaxy identifications for 14 DLA systems with and atoms cm-2 (but not including local galaxies). The distributions of DLA galaxy properties for these 14 cases are shown in Figure 10. -band luminosities are plotted when available. -band luminosities are plotted for galaxies that are not detected in , but this substitution should not grossly affect any trends in the data. For the case of the DLA galaxy in the 3C 336 field, only an upper limit to its luminosity can be determined, since the galaxy is not detected. For the same reason, the impact parameter is unknown. This case is clearly representative of another dwarf DLA galaxy if stars are present in the H I gas at all. Although the data set contains only 14 systems, some important trends emerge.
| QSO | /1020 | Luminositybb (Marinoni et al. 1999), (Lin et al. 1996), and (Loveday 2000), for and km s-1 Mpc-1. | Morphology | Reference | ||
|---|---|---|---|---|---|---|
| atoms cm-2 | kpc | |||||
| This work | ||||||
| B2 0827243 | 0.525 | 2.0 | , , | 34 | Disturbed spiral | 1 |
| PKS 0952179 | 0.239 | 21 | ccSum of luminosities of objects 1 and 2 (see §3.2.2 and Figure 3). | Dwarf LSB | 1 | |
| PKS 1127145 | 0.313 | 51 | , , ddSum of luminosities of objects 1, 3, and 4 (see §3.3.1 Figure 4). | Patchy/irr/LSB | 1 | |
| PKS 1629+120 | 0.532 | 5.0 | , , | 17 | Spiral | 1 |
| Other work | ||||||
| AO 0235+164 | 0.524 | 45 | 6.0 | Late-type spiraleeThe object defined as A1 in Yanny, York, & Gallagher 1989 and Burbidge et al. 1996 has the smallest impact parameter and, therefore, we have assumed that it is the DLA galaxy. A -correction of 1 magnitude, which is appropriate for a late-type spiral galaxy at (Poggianti 1997) has been applied to derive the absolute luminosity of A1 from the apparent magnitude measured by Burbidge et al. 1996. The HI column density is from Turnshek et al. 2003. | 2,3 | |
| EX 0302223 | 1.010 | 2.3 | 9.2 | Semi-compact | 4 | |
| PKS 0454039 | 0.859 | 4.7 | 6.4 | Compact | 4 | |
| Q0738313 (OI 363) | 0.091 | 15 | LSB | 5 | ||
| 0.221 | 7.9 | 20 | Dwarf spiral | 5 | ||
| Q0809+483 (3C 196) | 0.437 | 6.3 | 9.6 | Giant Sbc | 4 | |
| Q1209107 | 0.633 | 2.0 | 11.2 | Spiral | 4 | |
| PKS 1229021 | 0.395 | 5.6 | 7.6 | LSB | 4,6 | |
| Q1328+307 (3C 286) | 0.692 | 15 | 6.5 | LSB | 4,6 | |
| Q1622239 (3C 336) | 0.656 | 2.3 | LSB? compact? | 7 | ||
References. — (1) This paper. (2) Burbidge et al. 1996. (3) Yanny et al. 1989. (4) Le Brun et al. 1997. (5) Turnshek et al. 2001. (6) Steidel et al. 1994. (7) Steidel et al. 1997.

The vs. plot shows that low-luminosity dwarf galaxies with small impact parameters dominate this small sample. Since DLA galaxies are H I cross section–selected, this means that sub- dwarf galaxies dominate the H I cross section at . This is also indicated by the luminosity histogram, versus , which implies that it is times more likely for a quasar sight line to intercept an galaxy than an galaxy. For galaxies at the present epoch, Zwaan, Briggs, & Verheijen (2002, see their Fig. 1) show that the probability of intercepting DLA gas, i.e., the cross-sectional area of DLA gas per unit volume, as a function of galaxy magnitude is flat for a steeply rising optical luminosity function with and decreases at faint magnitudes for or . Expressed as a function of luminosity, this probability would rise as toward the faint end for the case in which and, based on the data points in their Figure 1, would increase as toward the faint end for . For the latter case, the trends at and are similar. Turnshek, Rao, & Nestor (2002) arrived at much the same conclusion (see their Fig. 4). They compared the optical diameter-limited (7′) complete sample of galaxies from Rao & Briggs (1993) to a sample similar to the one in Table 4. They found that the relative absolute magnitude distributions of the two samples are comparable within the large uncertainties associated with the low-redshift sample.222This statement is based on a relative comparison at the two epochs, independent of any evolution in (which measures evolution in galaxy number density times galaxy cross section) for DLA systems (RT2000). We note that Table 4 has our final measurements for the four DLA galaxies discussed in this paper, as opposed to the preliminary measurements used in Turnshek et al. (2002). Also, the galaxy toward AO 0235+164 was not included in their analysis.
The trend that higher column densities tend to be observed at low impact parameters ( vs. ) is not unexpected. However, what is unexpected is that the highest column densities are observed in galaxies with the lowest luminosities ( vs. ). This latter trend might be explained if a selection bias exists such that bright galaxies with high column densities at small impact parameters are missing from our sample. This might be caused by dimming of the background quasar due to reddening from the foreground DLA gas, excluding such bright quasars from our magnitude-limited sample. While a study by Ellison et al. (2001) on the occurrence of DLA systems at in a radio-selected quasar sample did not show a significant excess in the DLA number density as compared to DLA systems found in optically selected quasar samples, this might not hold true at lower redshift.
Two specific oddities of the sample are worth mentioning here: (1) Four of the five DLA galaxies with atoms cm-2 are LSB galaxies. This may have significant implications for the whereabouts of the bulk of the H I gas, since the determination of from DLA systems is dominated by ones with the highest column densities. These four DLA systems contain 55% of the total column density in Table 4. Zwaan et al. (2003) have shown that only 15% of the neutral gas at the present epoch is contained in LSB galaxies. Thus, if the low-redshift DLA galaxy trends hold up with larger samples, it would indicate that a different population of objects is responsible for the bulk of the neutral hydrogen gas in the universe at . (2) The three galaxies that have the largest impact parameters (17, 20, and 34 kpc) are spirals. G1 in the B2 0827+243 field is an spiral and has the largest impact parameter, and, as discussed earlier, it shows signs of an interaction that might be responsible for distributing the gas to larger galactocentric distances. It was only possible to see evidence for this in the high-resolution HST image that exists for the field. Similar high-resolution HST images do not exist for the other two large-impact parameter fields, i.e., the dwarf spiral galaxy in the OI 363 field and the spiral galaxy in the PKS 1629+120 field. Study of these two fields at higher resolution would be highly desirable in order to understand the reality and nature of this DLA gas at unusually large galactocentric distance.
Appendix A Stellar Population Template Fits
In order to investigate the stellar populations present in the DLA galaxies, we fitted stellar population synthesis models to the photometry when sufficient multi-band data were available. However, multiple stellar populations typically contribute to an observed SED. Therefore, we used a fitting method that allows for contributions from multiple stellar populations attenuated by a variable amount of wavelength-dependent extinction due to dust. At the same time, galaxy colors are known to be degenerate in age-metallicity-redshift space, so further assumptions and an interpretation of what our fits mean are generally required.
First, when performing fits, we set the redshift of the galaxy to the DLA redshift. In all three cases there was reasonable justification for this. The adopted redshift was either confirmed spectroscopically or verified to be a likely photometric redshift. Second, the metallicities of all the template spectra were fixed to be solar. On the one hand, this is useful, since solar metallicity is an often-used benchmark. However, it is well known that the measured metallicities of DLA gas at moderate-to-high redshift are closer to 1/10 solar. If lower metallicities (e.g., solar) hold for the DLA galaxies studied here, the nature of the age-metallicity degeneracy means that we would generally underestimate the age of the stellar population(s) in the DLA galaxy. If the stellar metallicity were solar, the effect would be quite small, but at metallicities as low as solar, the effect is substantial. Thus, even with the advantage of fixing redshift, the age-metallicity degeneracy gives rise to some interpretive limitations. Another limitation is the degree to which any adopted set of template spectra (see below) are applicable to fit the observed SEDs. In any case, when the qualitative results of the SED fitting are taken in combination with morphological information, we are generally able to draw a consistent conclusion that provides useful information on the evolutionary history of a DLA galaxy as presented in §3.
For the template spectra we use the galaxy isochrone synthesis spectral evolution library (GISSEL99) of G. Bruzual & S. Charlot (2003, in preparation). We chose templates with a Scalo initial mass function (IMF) corresponding to instantaneous bursts observed at eleven different ages: , , 0.05, 0.1, 0.2, 0.3, 0.6, 1.0, 1.5, 4, and 12 Gyr. From these original 11, we generated an additional 110 templates by applying a Calzetti reddening law (Calzetti et al. 2000) with 10 different dust extinction values, corresponding to of 0.05, 0.1, 0.2, 0.3, 0.4, 0.5, 0.6, 0.7, 0.8, and 0.9. The convolution of each of these 121 redshifted templates with the UBRJK filter set (UBRIK for B2 0827+243) was converted to flux units, resulting in a flux 5-vector for each template. Models were then built to minimize the fit to the observed photometric SEDs for each of the combinations of 5-vectors, where was the number of component templates used in the fit. We investigated cases in which the value of was 1, 2, or 3. The model that gave the most reasonable value for reduced was then reported as the most likely (combination of) stellar population(s) in a galaxy. For example, both single- and two-burst models are reported as best fits to the photometry of G1 in the B2 0827+243 field, while a single-burst model was clearly appropriate for fitting the photometry of G1 in the PKS 1629+120 field (i.e., a two-burst model had a noticeably larger reduced ). Although we explored three-burst models, the resulting improvements in reduced values did not justify their use.
The standard interpretation of reduced fitting results holds for the best fits presented in §3. That is, if the adopted template spectra are representative of our observed SEDs and if our derived observational errors are valid, model fits that have a reduced between 0.8 and 2 (which correspond to reduced probabilities between 0.5 and 0.2) are taken to be acceptable fits. On the other hand, a reduced value much larger than this should formally be rejected. There are two possible reasons for this. Either (1) the errors have been underestimated, which might be the case if some unknown systematic error in some of the photometry exists, or (2) the set of template spectra used to fit the observed SEDs is inappropriate. We suspect that in cases in which we have a larger reduced , say 5, the quoted fits still provide qualitative information on the nature of the DLA galaxy’s stellar population. It might be that the could be reduced further by assuming some specific form for time-variable star formation, and/or by using different metallicities, and/or by tracking down an unknown systematic error in the photometry. Another possibility is finding a reduced value much less than one (resulting in a probability greater than 0.5). This may be indicative of overfitting the data or error estimates that are too large.
The specifics of the various fits to DLA galaxy SEDs are discussed in §3. Models that included a negative population were rejected as unphysical. Quoted fractions are by burst mass, although one should keep in mind that any such method is sensitive only to the light output of the galaxy, and as younger populations will have smaller mass-to-light ratios, large old populations may not be resolved by this technique when a large young burst is present. As noted above, instantaneous bursts may be unreliable approximations for star formation histories of real galaxies in many cases. By building the best-fit model from multiple templates, however, we in effect mimic a nonparametric star formation history. Nonetheless, we repeated the process with sets of exponentially decreasing star formation rates. The results from the two methods were consistent. For example, a galaxy that showed an equal combination of old and young stellar populations from our first method would show a long e-folding time in the second method, while a galaxy with a predominately young population would show a very short e-folding time.
References
- (1)
- (2) Afonso, J., Mobasher, B., Chan, B., & Cram, L. 2001, ApJ, 559, L101
- (3)
- (4) Aldcroft, T. L., Bechtold, J., & Elvis, M. 1994, ApJS, 93, 1
- (5)
- (6) Barthel, P. D., Tytler, D. R., & Thomson, B. 1990, A&AS, 82, 339
- (7)
- (8) Bergeron, J., & Boissé, P. 1991, A&A, 243, 344
- (9)
- (10) Binggeli, B., Popescu, C. C. & Tammann, G. A. 1993, A&AS, 98, 275
- (11)
- (12) Bouché, N., Lowenthal, J. D., Charlton, J. C., Bershady, M. A., Churchill, C. W., & Steidel, C. C. 2001, ApJ, 550, 585
- (13)
- (14) Bowen, D. V., Tripp, T. M., & Jenkins, E. B. 2001, AJ, 121, 1456
- (15)
- (16) Burbidge, E. M., Beaver, E. A., Cohen, R. D., Junkkarinen, V. T., & Lyons, R. W. 1996, AJ, 112, 2533
- (17)
- (18) Calzetti, D., Armus, L., Bohlin, R., Kinney, A., Koornneef, J., & Storchi-Bergmann, T. 2000, ApJ, 533, 682
- (19)
- (20) Cimatti, A., et al. 1999, A&A, 352, L45
- (21)
- (22) Cimatti, A., Villani, D., Pozzetti, L., & di Serego Alighieri, S. 2000, MNRAS, 318, 453
- (23)
- (24) Cowie, L. L., Gardner, J. P., Hu, E. M., Songaila, A., Hodapp, K.-W., & Wainscoat, R. J. 1994, ApJ, 434, 114
- (25)
- (26) Daddi, E., Cimatti, A., & Renzini, A. 2000, A&A, 362, L45
- (27)
- (28) Dey, A., Graham, J. R., Ivison, R. J., Smail, I., Wright, G. S., & Liu, M. C. 1999, ApJ, 519, 610
- (29)
- (30) Ellison, S. L., Yan, L., Hook, I. M.;,Pettini, M., Wall, J. V., & Shaver, P. 2001, A&A, 379, 393
- (31)
- (32) Haehnelt, M., Steinmetz, M., & Rauch, M. 1998, ApJ, 495, 647
- (33)
- (34) Hamilton, T. S., Casertano, S., & Turnshek, D. A. 2002, ApJ, 576, 61
- (35)
- (36) Jannuzi, B., et al. 1998, ApJS, 118, 1
- (37)
- (38) Kanekar, N., & Chengalur, J. N. 2001a, A&A, 369, 42
- (39)
- (40) Kanekar, N., & Chengalur, J. N. 2001b, A&A, 325, 631
- (41)
- (42) Kukula, M. J., Dunlop, J. S., McLure, R. J., Miller, L., Percival, W. J., Baum, S. A., O’Dea, C. P. 2001, MNRAS, 326, 1533
- (43)
- (44) Lane, W. 2000, Ph.D. thesis, Univ. Groningen
- (45)
- (46) Lane, W., Smette, A., Briggs, F., Rao, S., Turnshek, D., & Meylan, G. 1998, AJ, 116, 26
- (47)
- (48) Lanzetta, K. M., Wolfe, A. M., Turnshek, D. A., Lu, L., McMahon, R. G., & Hazard, C. 1991, ApJS, 77, 1
- (49)
- (50) Le Brun, V., Bergeron, J., Boissé, & Deharveng, J. M. 1997, A&A, 321, 733
- (51)
- (52) Lin, H., Kirshner, R. P., Shectman, S. A., Landy, S. D., Oemler, A., Tucker, D. L., Schechter, P. L. 1996, ApJ, 464, 60
- (53)
- (54) Loveday, J. 2000, MNRAS, 312, 557
- (55)
- (56) Madau, P., Pozzetti, L., & Dickinson, M. 1998, ApJ, 498, 106
- (57)
- (58) Marinoni, C., Monaco, P., Giuricin, G., Constantini, B. 1999, ApJ, 521, 50
- (59)
- (60) McDonald, P. & Miralda-Escudé, J. 1999, ApJ, 519, 486
- (61)
- (62) Peroux, C., McMahon, R. G., Storrie-Lombardi, L. J., & Irwin, M. J. 2001, MNRAS, submitted (astro-ph/0107045)
- (63)
- (64) Poggianti, B. M. 1997, A&AS, 122, 399
- (65)
- (66) Pozzetti, L. & Mannucci, F. 2000, MNRAS, 317, L17
- (67)
- (68) Prochaska, J. X., & Wolfe, A. M. 1997, ApJ, 487, 73
- (69)
- (70) Prochaska, J. X., & Wolfe, A. M. 1998, ApJ, 507, 113
- (71)
- (72) Rao, S. M., & Briggs, F. H. 1993, ApJ, 419, 515
- (73)
- (74) Rao, S. M., Turnshek, D. A., & Briggs, F. H. 1995, ApJ, 449, 488
- (75)
- (76) Rao, S. M. & Turnshek, D. A. 1988, ApJ, 500, L115
- (77)
- (78) Rao, S. M. & Turnshek, D. A. 2000, ApJS, 130, 1 (RT2000)
- (79)
- (80) Smith, P. G., Treu, T., Ellis, R., Smail, I., Kneib, J.-P., & Frye, B. L. 2001, ApJ, 562, 635
- (81)
- (82) Steidel, C. C. 1993, in The Environment and Evolution of Galaxies, ed. J. M. Shull and H. A. Thronson, Jr. (Dordrecht: Kluwer), 263
- (83)
- (84) Steidel, C. C., Pettini, M., Dickinson. M., & Persson, S. E. 1994, AJ, 108, 2046
- (85)
- (86) Steidel, C. C., Dickinson. M., Meyer, D. M., Adelberger, K. L., & Sembach, K. R. 1997, ApJ, 480, 568
- (87)
- (88) Steidel, C. C., Kollmeier, J. A., Shapley, A. E., Churchill, C. W., Dickinson. M., & Pettini, M. 2002, ApJ, 570, 526
- (89)
- (90) Turnshek, D. A., Rao, S., Nestor, D., Lane, W., Monier, E., Nergeron, J., & Smette, A. 2001, ApJ, 553, 288
- (91)
- (92) Turnshek, D. A., Rao, S., & Nestor, D. 2002, in ASP Conf. Ser. 254, Extragalactic Gas at Low Redshift, ed. J. Mulchaey & J. Stocke (San Francisco: ASP), 42
- (93)
- (94) Turnshek, D. A., Rao, S. M., Ptak, A. F., Griffiths, R. E., & Monier, E. M. 2003, ApJ, 590, 730
- (95)
- (96) Warren, S. J., Moller, P., Fall, S. M., & Jakobsen, P. 2001, MNRAS, 326, 759
- (97)
- (98) Wolfe, A. M., Turnshek, D. A., Smith, H. E., & Cohen, R. D. 1986, ApJS, 61, 249
- (99)
- (100) Yanny, B., York, D. G., Gallagher, J. S. 1989, ApJ, 338, 735
- (101)
- (102) Zwaan, M., Briggs, F. H., & Verheijen, M. 2002, in ASP Conf. Ser. 254, Extragalactic Gas at Low Redshift, ed. J. Mulchaey and J. Stocke (San Francisco: ASP), 169
- (103)
- (104) Zwaan, M., et al. 2003, AJ, 125, 2842
- (105)