XMM-Newton observations of ULIRGs I: A Compton-thick AGN in IRAS19254-7245
We present the XMM-Newton observation of the merging system IRAS 19254-7245, also known as The Superantennae, whose southern nucleus is classified as a Seyfert 2 galaxy. The XMM-Newton data have allowed us to perform a detailed X-ray imaging and spectral analysis of this system. We clearly detect, for the first time in this system, a strong ( keV) Fe emission line at keV (rest-frame). The X-ray spectrum requires a soft thermal component ( keV; erg s-1), likely associated with the starburst, and a hard power-law continuum above 2 keV (observed erg s-1 ). We confirm the flatness of this latter component, already noted in previous ASCA data. This flatness, together with the detection of the strong Fe-K line and other broad band indicators, suggest the presence of a Compton-thick AGN with intrinsic luminosity erg s-1. We show that a Compton-thick model can perfectly reproduce the X-ray spectral properties of this object.
Key Words.:
Galaxies: active, Galaxies: starburst, X-rays: galaxies, Galaxies: individual: IRAS 19254-72451 Introduction
The Ultra Luminous Infrared Galaxies (hereafter ULIRGs) are an enigmatic class of sources which emit most of their energy in the far-IR (FIR) domain, with luminosities in excess to 1012 L⊙, (i.e. comparable to QSO luminosities). While it is now clear that the huge observed FIR luminosity is due to the presence of large amounts of dust reprocessing the “primary” optical and UV emission from the central source, the nature of the latter is still debated. It is now widely accepted that both starburst (SB) and AGN activity may be responsible for the observed luminosity, but their relative contributions are still unconstrained (in some cases even the presence of an AGN is unclear).
Hard X–ray (2 keV) observations, less affected by the photoelectric absorption, are a fundamental tool not only to investigate the presence of an hidden AGN, but also to study its physical properties and to estimate its contribution to the high observed FIR emission. Indeed some of the ULIRGs, classified as pure SBs based on optical and IR spectroscopy, show spectral properties typical of obscured AGNs when observed in hard X-rays (i.e., NGC 6240: Iwasawa (1999)).
To shed light on this topic we are carrying out a mini-survey with XMM-Newton of 10 nearby () ULIRGs (see Braito et al. (2002)) for which high-quality mid-IR and optical spectroscopic data are available (Genzel et al. (1998); Lutz et al. (1999); Veilleux et al. (1999)). XMM-Newton, thanks to its wide energy band (0.2–10 keV) and high sensitivity (as compared to previous missions such as ASCA and ROSAT) allows for the first time the investigation of the X-ray spectral properties of this class of sources, which are usually X-ray faint (Risaliti et al. (2000)). In this paper we discuss the 0.2–10 keV XMM-Newton spectrum of IRAS 19254-7245 (The Superantennae), a well known ULIRG () located at redshift of . In particular, we will argue that IRAS 19254-7245 harbors a high-luminosity ( erg s), Compton-thick AGN. In this letter we assume km s-1 Mpc-1 and .
2 IRAS 19254-7245: Main Properties
Like most ULIRGs studied so far, IRAS 19254-7245 is a merger
system. It shows giant tails extending out to a distance of 350 kpc, triggered
by the merger of two gas-rich galaxies with nuclei
9 arcsec (with km s-1 Mpc-1 this corresponds to
kpc ) apart from each other. In the southern nucleus, which is the
dominant source at different wavelengths, mid-IR spectroscopy reveals
the presence of an AGN (Lutz et al. (1999)), classified as a Seyfert 2
from optical spectroscopy (Mirabel et al. (1991); Vanzi et al. (2002)).
IRAS 19254-7245 was previously observed in hard X-rays with ASCA (Imanishi et al. (1999); Pappa et al. (2000)). The ASCA data were consistent with two possible power-law (PL) models: an unabsorbed very flat model () model or an absorbed (cm-2) and steeper ( 1.7) model. No Fe-K lines in the range 6.4–7 keV were clearly detected, but the upper limit on the EW of such lines was 1-2 keV. The statistic of the ASCA spectrum prevented those authors from distinguishing between a Compton-thick (i.e. reflection-dominated) and a Compton-thin (i.e. transmission-dominated) source. Moreover, given the ASCA’s modest angular resolution (), it was not possible to pin-point the optical counterpart of the bulk of the X-ray emission.
3 Data Reduction
IRAS 19254-7245 was observed by XMM-Newton in March 2001 with
the EPIC (European Photon Imaging Camera: Strüder et al. (2001) and Turner et al. (2001)) cameras operating in full-frame mode and the thin filter applied. Data have been cleaned and processed using
the Science Analysis Software (SAS 5.3) and analyzed using standard software
packages (FTOOLS 5.0, XSPEC 11.0). The latest calibration files released by the EPIC team have been used. Event files produced from
the pipeline have been filtered from high-background time intervals and only
events corresponding to pattern 0-12 for MOS
and pattern 0-4 for PN have been used (see the
XMM-Newton Users’ Handbook Ehle et al. (2001)). The net exposure time, after data cleaning, are ksec, ksec, and ksec for PN, MOS1, and MOS2 respectively.
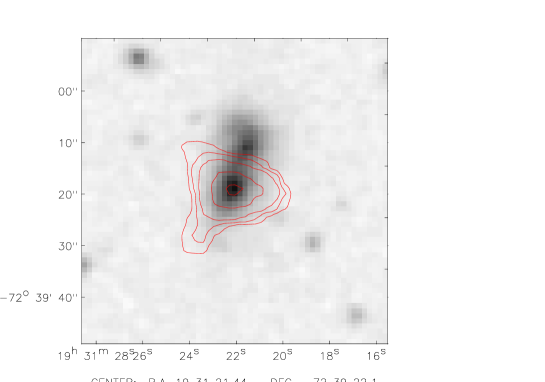
IRAS 19254-7245 is detected with a S/N ratio greater than 20 in all the EPIC cameras. In Fig. 1 we show the 3–10 keV contour plots from the MOS2 image overlaid on the DSS2 optical image of IRAS 19254-7245. The hard X-ray emission comes mostly from the southern Seyfert 2 nucleus 111The soft (E keV) X-ray emission, too, comes mostly from the southern nucleus. The soft X-ray emission appears to be extended and it includes the whole system. A detailed spectral and imaging analysis of this component will be reported elsewhere (Franceschini et al. 2002). . Since in this paper we want to address the X-ray spectral properties of the nuclear X-ray emission, X-ray counts have been extracted from a circular region of 15 arcsec radius 222The PSF of XMM-Newton does not allow us to extract the spectra from a smaller region. , positionally coincident with the core of the hard X-ray emission. Background counts have been extracted from a closeby source-free circular region. We have then generated our own response matrices (that include the correction for the effective area) using the SAS tasks arfgen and rmfgen.
In order to improve the statistics, the MOS1 and MOS2 data have been combined together and the combined MOS and PN spectra have been fitted simultaneously keeping the relative normalizations free. All the models discussed in this paper have been filtered through the Galactic absorbing column density along the line of sight to IRAS 19254-7245 (cm-2). Unless otherwise stated, in what follows errors will be given at the 90% confidence level for one interesting parameter (=2.71).
4 Spectral Analysis
Single-component models, e.g. a thermal model
333The thermal emissions used in this paper
are described by the MEKAL (Mewe et al. (1985)) model in the XSPEC package.
or a PL model, are
both rejected by the data at a high confidence level.
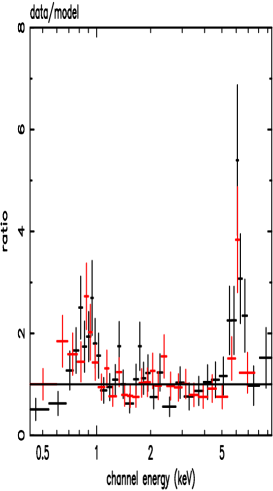
In Fig. 2 we show the ratio between the best-fit PL model and the
data: large excesses are clearly present in the soft energy band (suggesting the presence of a
soft thermal component) and a “line like” feature is evident between 6 and 7
keV (suggesting the presence of an Fe line). On the other hand a single
thermal component cannot account for the emission at keV.
We then tried to fit the data with a thermal component, an absorbed PL component plus a Gaussian line around keV. The best-fit values of this model are: keV, , cm-2 (model A in Table 1 and Table 2). The energy position and the EW of the Gaussian line are and keV (source rest-frame). The energy position of this line is consistent with cold Fe-K emission. It is worth noticing that the line profile appears to be marginally broad, with a width keV. This broadening can be due to the merging of several lines or to a more complex modeling of the continuum (e.g. the presence of an absorption edge modifying the underlying continuum, see below).
| Model | Norma | Normb | Normc | ||||||
|---|---|---|---|---|---|---|---|---|---|
| keV | cm-2 | keV | |||||||
| A | 0.86 | 1.23 | 1.30 | 0.31 | 2.63 | / | 6.48 | 1.4 | 50.9/57 |
| B | 0.85 | 1.26 | 1.84 | 0.47 | 3.71 | 46.4 | 6.49 | 2.0 | 48.1/56 |
a in units of , where D is
the distance to the source (cm), ne is the electron
density (cm-3), and nH is the hydrogen density (cm-3) at 1 keV.
b in units of 10-5 photons keV-1 cm-2 at 1 keV; in model B it refers to the scattered component.
c in units of 10-5 photons keV-1 cm-2 at 1 keV; in model B it refers to the reflected component.
| Model | BAND | Flux | Luminosityb | |||||
|---|---|---|---|---|---|---|---|---|
| 10-14 erg cm-2 s-1 | 1041 erg s-1 | |||||||
| TOTAL | Starburst | AGN | Starburst | AGN | ||||
| A | 0.5–2 keV | 5.30 | 2.13 | 3.16 | 4.4a | 9.7b | ||
| 2–10 keV | 23.0 | 0.1 | 22.9 | 0.30a | 37.7b | |||
| B | 0.5–2 keV | 5.31 | 2.10 | 3.21 | 4.3a | 13.6b | ||
| 2–10 keV | 23.5 | 0.1 | 23.4 | 0.28a | 38.7b | |||
a X-ray luminosity de-absorbed from intrinsic and galactic .
b X-ray luminosity de-absorbed from galactic .
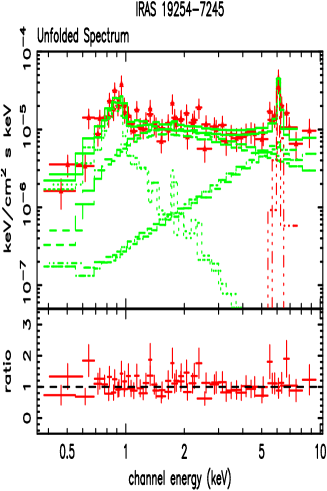
The flat photon index, , measured for the hard X-ray continuum, and the presence of a Fe-K emission are both typical of high-mass X-ray binaries (HMXB) spectra (White et al. (1983)). However, the equivalent width of the Fe-K complex arising from HMXBs, either observed directly in HMXBs (typically EW 0.3 keV: see White et al. 1983) or inferred for galaxies with X-ray emission dominated by HMXBs (Persic & Rephaeli (2002)), is not consistent with the huge value observed here. The flat hard continuum and the prominent Fe-K emission line, may alternatively suggest that IRAS 19254–7245 hosts a Compton-thick AGN (e.g. Maiolino et al. (1998)). In this perspective we have tried a composite model which accounts for the SB emission and for the “putative” Compton-thick AGN emission. The SB emission has been modeled with a soft thermal component. The AGN emission has been described by a pure Compton-reflected continuum (model PEXRAV 444Since we lack any information about the emission at energy above 10 keV we kept the inclination, the abundances and the energy cutoff frozen to standard values of , 1 and 100 keV; only the intrinsic PL photon index and the reflection normalization were allowed to vary in the fitting procedure. in XSPEC, Magdziarz & Zdziarski (1995)) combined with an absorbed PL model and a Gaussian line at keV. In this model the absorbed PL component represents the scattered emission of the central source, hence its photon index is tied to the one in the PEXRAV model. The results are reported in Tables 1 and 2 (model B) and shown in Fig. 3. We note that the best-fit photon index is 1.8, a value very similar to that observed in unobscured AGN (George et al. (2000)).
As described above, the baseline model for the hard X-ray continuum of IRAS 19254–7245 comprises a reflected plus a scattered component. If this latter component is supposed to arise from a “warm mirror”, then one would also expect to observe emission lines from highly ionized Fe. We have estimated the upper limits on the EW of the He-like (6.7 keV) and the H-like (6.97 keV) Fe emission lines to be 1.8 keV and 2 keV, respectively. A second narrow gaussian line could probably be accommodated within the data uncertainties. These upper limits are consistent with that expected from the scattered component, but the present statistics does not allow us to be conclusive about this point.
In summary, the broad-band X-ray emission from IRAS 19254–7245 requires a thermal emission ( keV) plus a hard continuum. The spectral parameters of the thermal emission are not a strong function of the detailed modeling of the hard X-ray continuum; this component (which dominates at keV) is likely associated with the starburst and, compared to the hard one, appears to be spatially extended. A detailed analysis of this emission will be presented in a forthcoming paper (Franceschini et al. 2002). The hard X-ray continuum can be described by two models: a) a Compton-thin (Table 1 model A) AGN having a very flat photon index or b) a Compton-thick (Table 1 model B) AGN having an intrinsic photon index of 1.8. Both models require a strong Fe line at 6.49 keV (rest-frame). Since these two competing models give similar in the next section we will try to discriminate between them.
5 Discussion
A viable interpretation of the observed flat () hard X-ray continuum and prominent ( 1.4 keV) Fe-K emission line involves a reprocessing of the primary spectrum, i.e. the presence of a Compton-thick source. Further indications of the Compton-thick nature of IRAS 19254–7245 come from observations at other wavelengths. One of the broad-band diagnostics largely used in the literature to estimate the strength of the nuclear source and the Compton thickness is the ratio between the strength of the [OIII]5007 emission line and the 2–10 keV flux. This ratio -once that the [OIII] emission is corrected for the extinction using the Balmer decrement (Bassani et al. (1999))- combined with the EW of the measured Fe emission line can be used to evaluate the Compton thickness of the source.
Using recent [OIII] estimates (for the southern nucleus; see Berta et al. 2002) and the 2-10 keV observed flux (see Table 2) we obtain F(2–10 keV)/F[OIII] . This value, combined with the measured keV of the Fe line, clearly locates IRAS 19254–7245 in the region populated by Compton-thick sources in Fig. 1 of Bassani et al. (1999).
The energy position of the line ( keV) is consistent with cold (i.e. Fe less ionized than Fe XVII) Fe K emission but not with highly ionized (He-like or H-like) iron. Therefore we can exclude an origin of the line from optically thin gas (the so called “warm mirror”) placed outside the torus (see e.g. Matt et al. (1996)), leaving the production from a cold medium as the only possibility. In this context the line could be produced by reflection from the inner surface of the circumnuclear absorbing material (Ghisellini et al. (1994)) or by transmission through the torus itself (Leahy & Creighton (1993)). Moreover the X-ray spectrum is well described by a reflection component, and the equivalent width of the detected line (with respect to the reflected component) is 2 keV: this is in good agreement with the expectation from a reflection dominated source (see Matt et al. (1996)).
If the Compton-thick hypothesis is correct, then the observed luminosity (see Table 2) could
be just few percent of the intrinsic one. Since the best-fit luminosity of
the scattered component is erg s-1,
then the intrinsic luminosity is estimated to be . Assuming the NGC1068 values
(Iwasawa et al. (1997)) for the mirror optical depth () and the
subtended angle (), we obtain an intrinsic luminosity
for the AGN harbored in IRAS 19254-7245 of erg s-1.
The derived intrinsic luminosity of the AGN present in IRAS 19254-7245 suggests that the AGN activity contributes a significant fraction of the FIR luminosity. Indeed mid-IR observations suggest that the AGN contribution to the FIR emission could be 40% (see Berta et al. 2002). We have then computed log( ) for the AGN component. We found that this ratio is , in agreement with the Compton-thick scenario (Mulchaey et al. (1994)).
In Fig. 4 we compare the spectral energy distribution (SED) of IRAS 19254-7245 with the SED of NGC6240 (Iwasawa et al. (2001)). The latter ULIRG is known to harbor a heavily-obscured, high-luminosity AGN. In this respect it is worth emphasizing the similarities of the two SEDs from the IR–to–X-ray band: in particular, both sources show a strong Fe emission line superimposed on a strongly absorbed continuum. In more detail NGC6240 and IRAS 19254-7245 show a similar emission in the X-ray band, while they differ in the optical/FIR band (IRAS 19254-7245 being more luminous then NGC6240). This could indicate that the AGN in IRAS 19254-7245 could be intrinsically more powerful and/or more obscured in the X-ray energy band. Alternatively, the SB activity may be stronger in IRAS 19254-7245 than in NGC6240. Finally the shapes of these SEDs are similar to the SED of the cosmic energy density spectrum (see Lehmann et al. (2001) and reference therein). In both ULIRGs there is evidence of comparable contributions by obscured SB and AGN activities.

6 Conclusions
We have presented the XMM-Newton observations of IRAS 19254-7245. The main results are hereby summarized.
-
1.
The hard X-ray emission originates from the southern nucleus of IRAS 19254-7245, which is optically classified as a Seyfert 2 galaxy.
-
2.
We detect, for the first time in this system, a strong ( keV) emission line at keV (rest-frame), which is consistent with a cold Fe- line.
-
3.
The broad-band X-ray spectra requires a soft thermal component, which accounts for the starburst emission, and a flat () continuum most likely associated with a heavily absorbed AGN. The hard continuum and the detected strong Fe-K emission line are highly indicative of a Compton-thick source. Indeed, from a statistical and a physical point of view, the X-ray spectral properties of this object can be well explained with a Compton thick model. In this scenario, the intrinsic 2–10 keV luminosity of IRAS 19254-7245 could be greater than erg s-1, i.e. attaining the QSO luminosity regime.
Acknowledgements.
This work has received financial support from ASI (I/R/037/01) under the project “Cosmologia Osservativa con XMM-Newton” and from the Italian Ministry of University and Scientific and Technological Research (MURST) through grants Cofin . PS acknowledges partial financial support by the Italian Consorzio Nazionale per l’Astronomia e l’Astrofisica (CNAA). We thanks K. Iwasawa to have provided us the SED of NGC6240 in a tabular form.References
- Bassani et al. (1999) Bassani L., Dadina M., Maiolino R. et al. 1999, ApJS 121, 473
- Berta et al (2002) Berta, S., Fritz J., Franceschini, A., Bressan, A. & Pernechele, C. A&A submitted
- Braito et al. (2002) Braito, V., Franceschini, A., Della Ceca, R. et al. 2002 “New Visions of the X-ray Universe in the XMM-Newton and Chandra Era”, ESA-SP, ed. F. Jansen (astro-ph/0202352)
- Ehle et al. (2001) Ehle, M., Breitfellner, M., Dahlem, M. et al. 2001, XMM-Newton Users’ Handbook
- Franceschini et al. (2002) Franceschini, A., Braito, V., Della Ceca, R. et al. in preparation
- Genzel et al. (1998) Genzel R., Lutz D., Sturm E. et al. 1998, ApJ 498, 579
- George et al. (2000) George, I. M., Turner, T. J., Yaqoob, T. et al. 2000, ApJ, 531, 52
- Ghisellini et al. (1994) Ghisellini, G., Haardt, F. & Matt, G. 1994 , MNRAS, 267, 743
- Imanishi et al. (1999) Imanishi, M. & Ueno, S. 1999, ApJ, 527, 709
- Iwasawa et al. (1997) Iwasawa, K., Fabian, A. C. & Matt, G., 1997, MNRAS, 289, 443
- Iwasawa (1999) Iwasawa, K. 1999, MNRAS, 302, 96
- Iwasawa et al. (2001) Iwasawa, K., Matt, G., Guainazzi, M. & Fabian, A. C., 2001, MNRAS, 326, 894
- Leahy & Creighton (1993) Leahy, D. A. & Creighton, J., 1993, MNRAS, 263, 314
- Lehmann et al. (2001) Lehmann, I., Hasinger G., Murray, S. S. & Schmidt M., Proceedings for X-rays at Sharp Focus Chandra Science Symposium, held in St. Paul, MN (2001), eds. E M. Schlegel and S.Vrtilek, 2001 heus confE, 10
- Lutz et al. (1999) Lutz, D. and Veilleux, S. & Genzel, R. 1999, ApJ, 517L, 13.
- Magdziarz & Zdziarski (1995) Magdziarz, P. & Zdziarski, A. A. 1995, MNRAS, 273, 837
- Maiolino et al. (1998) Maiolino, R., Salvati, M., Bassani, L. et al. 1998, A&A, 338, 781.
- Matt et al. (1996) Matt, G., Brandt, W. N. & Fabian, A. C., 1996, MNRAS, 280, 823
- Mewe et al. (1985) Mewe R., Gronenschild E. H. B. M. & van den Oord G. H. J., 1985, A&AS 62, 197
- Mirabel et al. (1991) Mirabel, I. F., Lutz, D. & Maza, J. 1991, A&A, 243, 367
- Mulchaey et al. (1994) Mulchaey, J. S. Koratkar, A., Ward, M. J. et al., 1994, ApJ, 436, 586
- Pappa et al. (2000) Pappa, A., Georgantopoulos, I. & Stewart, G. C. 2000, MNRAS, 314, 589
- Persic & Rephaeli (2002) Persic, M. & Rephaeli, Y. 2002, A&A, 382, 843
- Risaliti et al. (2000) Risaliti, G., Gilli, R., Maiolino, R. & Salvati, M. 2000, A&A, 357, 13
- Strüder et al. (2001) Strüder, L., Briel, U., Dannerl, K., et al. 2001, A&A, 365, L18
- Turner et al. (2001) Turner, M. J. L., Abbey, A., Arnaud, M., et al. 2001, A&A, 365, L27
- Vanzi et al. (2002) Vanzi, L., Bagnulo, S., Le Floc’h, E. et al., 2002, A&A, 386, 464
- Veilleux et al. (1999) Veilleux S., Kim D.-C. & Sanders, D. B. 1999, ApJ 522, 139
- White et al. (1983) White, N. E., Swank, J. H. & Holt, S. S.,1983, ApJ, 270, 711