Extended X-ray emission around four 3C quasars at observed with Chandra
Abstract
We report on the detection of a soft spatially-extended component of X-ray emission around four intermediate-redshift 3C quasars observed with Chandra: 3C254, 3C263, 3C275.1 and 3C281. The bolometric luminosity of this emission ranges over 0.3–1.6, and extends to lengthscales of over 350 kpc at the redshift of the quasar. The X-rays are most likely thermal emission from the intracluster medium of a cluster of galaxies around each quasar, which provides the working surface for the powerful radio lobes. Some X-ray emission is also seen to be associated with the radio plasma.
keywords:
galaxies: clusters: general – quasars: general – X-rays: galaxies1 Introduction
There has been accumulating evidence for many years that intermediate-redshift, radio-loud quasars reside in strongly clustered environments. The optical field galaxy counts around some radio-loud quasars (Wold et al 2000; Ellingson, Yee & Green 1991; Yee & Green 1987), and the high gas pressures inferred in the extended emission-line nebulae (Crawford & Vanderriest 1997, 2000; Durret et al 1994; Bremer et al 1992) suggest that they lie in clusters typically of Abell class 0 or richer. Attempts to detect spatially-extended and thermal X-ray emission from any cluster component were made using the ROSAT satellite (Crawford et al 1999; Hardcastle & Worrall 1999). An extended component was found around five intermediate-redshift 3C quasars (3C215, 3C254, 3C275.1, 3C281 and 3C334), having bolometric luminosities ranging over 2-17, and characteristic lengthscales of 25-265 kpc. The detection of the extended X-ray emission from ROSAT HRI data, however, was complicated by the need to remove the effects of spacecraft wobble before analysis. In this paper we revisit the environment of three of these 3C quasars (3C254, 3C275.1 and 3C281) and that of a further intermediate-redshift quasar (3C263) using our own pointed, and archival, Chandra observations.
We assume a cosmology of Hand q throughout this paper.
2 Observations
3C281 was observed by Chandra with the ACIS-S on 2001 May 30 using the FAINT telemetry mode, with the source position offset from the aimpoint of chip 7 by just over an arcminute. The observation was free from background flaring events, so we extracted data from the total exposure of 15.85 ksec.
We retrieved ACIS-S data from the Chandra archive on three other quasars at intermediate redshifts: 3C254, 3C263 and 3C275.1. Despite being a spectroscopic observation, we also examined the zeroth order image of the lower-redshift QSO 1821+643 which is known to lie in a cluster. The environment of this quasar has been previously studied by Fang et al (2002), and we include it to enable comparison of our method to a result in the literature. A log of observations is given in Table 1. There was no obvious flaring activity in the soft band on chip 7 for the observations of 3C254, 3C275.1 and 1821+643, so we took the data from the full exposure in each case. The observation of 3C263 showed a high background countrate at the start of the observation, so we used data from only the latter two-thirds of the exposure.
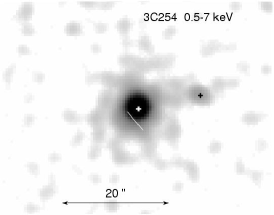
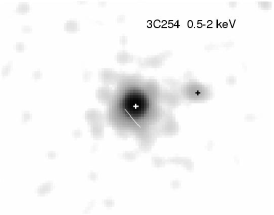
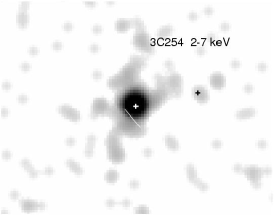
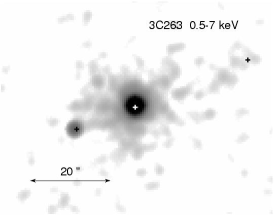
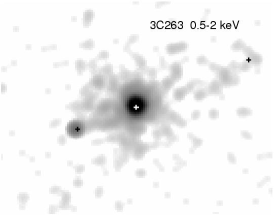
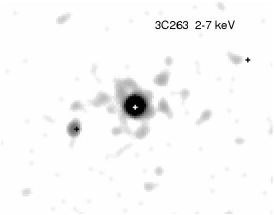
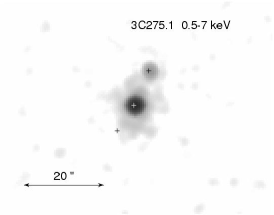
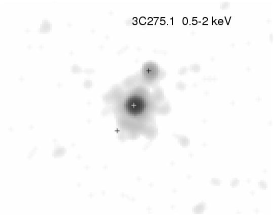
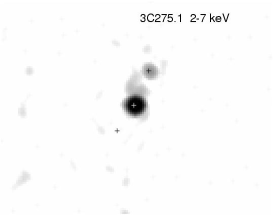
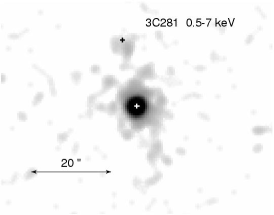
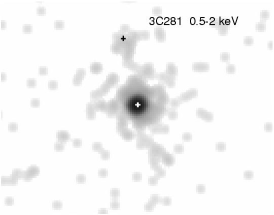
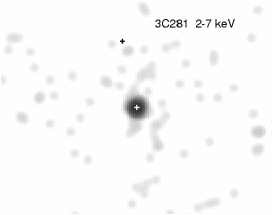
X-ray emission from the quasar is easily detected from all five sources; images of the four 3C quasars in each of three energy bands 0.5-7 keV, 0.5-2 keV (soft) and 2-7 keV (hard) are shown in Figure 1. On an initial visual inspection, all the quasars appear to have a diffuse halo of spatially extended emission surrounding the central quasar nucleus in the soft (0.5-2 keV) band. Each also has an offset X-ray source at the position of the more prominent radio hotspot: to the west of 3C254, the south-east of 3C263, the north-west of 3C275.1 and to the north of 3C281. The images of 3C254 also suggest extended emission slightly beyond, but still following the line of the highly distorted radio lobe to the south-east of the nucleus. We extract the net counts from a circular aperture over each of the hotspots, using an annular region at large radii around the quasar (see later) for estimation of the background. The counts from, and the luminosities inferred for these ‘X-ray hotspots’ (assuming a power-law spectrum at the same redshift as the quasar, and with only Galactic absorption) are presented in Table 2.
We are particularly interested in detecting any possible extended component of the X-ray emission around these quasars. It is thus important to assess whether the nuclear quasar emission suffers from a large degree of pileup, as this will distort the point-spread function (PSF) of the nucleus: if pileup is significant in the core, the centre of the nuclear PSF will be artificially suppressed relative to its wings. We used DMEXTRACT to estimate the number of counts from the X-ray source within a radius of 10 pixels (5 arcsec) centred on each quasar nucleus, without background-subtraction. Most of the quasar observations have a frame-time of 3.2s, except for the data from 3C275.1, which is sub-arrayed (to one-half the chip size, and so has a frame-time of 1.8s). We list the counts/frame-time from these central regions in Table 1; the higher values of 0.6-0.65 correspond to a modest pile-up fraction of around 25 per cent at the core of the X-ray source (CXC Handbook).
We extracted surface brightness profiles of the X-ray emission associated with each of the quasars using the CIAO software package DMEXTRACT. As we are concerned with testing for the presence of extended, thermal emission, we produce the azimuthal profiles only in the soft (0.5-2 keV) energy band. The counts were extracted from annuli centred on the quasar nuclear emission, extending out to a radius of 50 arcsec for the four 3C quasars. The annuli were of width 0.5 arcsec out to a 10 arcsec radius, 1 arcsec between 10 and 15 arcsec, 1.5 arcsec between 15 and 30 arcsec, and 2.5 arcsec beyond. The smoothed images also suggest the presence of jetted soft X-ray emission along the radio axis between the radio lobes in at least 3C263 and 3C281. To be conservative, we excluded X-ray emission from sectors spatially corresponding with the radio source in all four 3C quasars. Specifically: the sector between 270 and 300∘ (where the angles increase anticlockwise from North) out to a radius of 15 arcsec for the western arm of the radio source in 3C254, and from 90 to 110∘ out to 5 arcsec for the distorted SE lobe; between 104 and 121∘ out to 19.5 arcsec and between 288 and 298 ∘ out to 32.5 arcsec for the radio source arms in 3C263; between 168–192∘ and 325–345∘ out to 11 arcsec radius for 3C275.1; and between 4–24∘ out to a 20 arcsec radius, and between 185-205∘ out to 33 arcsec for 3C281. A background source directly to the E of 3C254 at 30-34 arcsec was also excluded. The background counts in each case were estimated from a larger concentric annular region centred on the quasar: between radii of 65–88 arcsec for 3C254, 60–105 arcsec for 3C263, 67–85 arcsec for 3C275.1 and 60–90 arcsec for 3C281. The profile for 1821+643 was extracted out to a radius of 75 arcsec, and the background estimated from a large, slightly offset region. Within these radii, the counts in the readout streaks were negligible for all the 3C quasars, and were excluded from the profile of 1821+643.
3 Determination of a Chandra point spread function
3.1 Model PSFs
We used CIAO/MKPSF with the PSF library available from the CXC to estimate a two-dimensional model of the PSF for each of our target quasars. The PSF was created at the position of the quasar on the detector, in seven discreet bands that sampled the energy range between 0.5 and 2 keV at 0.25 keV intervals. This sampling is required as the higher energy PSFs are broader than that at lower energy. These separate energy PSFs were coadded, with relative normalizations of the profile in each 0.25 keV interval scaled in proportion to the shape of the incident spectrum of the quasar (ie onto the mirror). This thus provides a composite theoretical estimate of the PSF of the quasar nucleus at the observed chip position.
The incident quasar continuum shape (used for scaling of the energy bands) was estimated using a background-subtracted nuclear spectrum taken from within the central 3.5 arcsec radius of the quasar X-ray centroid (except for 1821+643, where we instead used the incident spectrum published by Fang et al 2002). The nuclear spectra were fit by a simple absorbed power-law model, with the absorption fixed to be the Galactic column density in the direction of the quasar. The nuclear spectra of the four 3C quasars were fit (sometimes not so well, except for 3C275.1) by flat power law models (). The slightly flatter slope of these models compared to the canonical power-law fits observed for quasars (eg Sambruna, Eracleous & Mushotzky 1999) supports the inference that the observations are mildly piled up. However, the approximation of the incident continuum is sufficiently good for the normalization of the model PSFs; we found from experimentation that the major variance in the PSF output from MKPSF was the position of the source on the chip, rather than from the spectral slopes assumed for the incident continuum (see later).
The MKPSF creates model PSFs out to radii of 10 arcsec, and those produced for the five quasars vary slightly. The possibility of modest pile-up in the central pixels leads us to concentrate on comparing the more extended components of the PSF. Beyond 2 arcsec, the slope of the PSF is almost identical for 3C263 and 1821+643 (Figure 2); similarly the slopes for 3C254 and 3C281 are also very close to each other, although steeper than for the other two quasars. The model for 3C275.1 has by far the steepest profile. We ascribe this variation in the extended PSF slope as predominantly due to the different positions of the sources on the chip: the positions of 3C254 and 3C281 are very close to one another, whereas those of 3C263 and 1821+643 are offset. We confirm this interpretation by re-creating the two model PSFs for 3C263 and 1821+643, with the correct incident spectra but now supposing the quasars were located at the same position on the chip as 3C254 and 3C281. The resulting model profiles almost exactly match those of 3C254 and 3C281. However, as MKPSF itself warns, these model PSFs may be insufficient for detailed analysis and deconvolution of source profiles. We thus test their worth against empirical determinations of the PSF from archival Chandra data.
3.2 Empirical PSFs
We searched the archive (as of 2002 May) for publicly-available ACIS-S observations of both normal stars and distant ‘normal’ active galactic nuclei, excluding those without sufficient counts for a reliable PSF. We also excluded observations where the source was far from the positions of any of the target quasars on the chip. There was one stellar observation fulfilling these criteria, and three AGN observations. The most important datasets for this purpose, however, are the two with the most signal in the source: the long observation of the quasar PG1634+706 created by merging six different archival datasets (obsID’s of 47, 62, 69-71, 1269) using the CIAO script MERGE_ALL, and the observation of the quasar PKS 2126-128. These quasars are also at sufficiently high redshift that even if they lie in a clustered environment themselves, we do not expect to detect any extended component of X-ray emission. The details of the archival datasets used are listed in Table 3. The counts/frame-time we estimate from each of these observations do not exceed those of our quasar targets, so any pile-up fraction from these observations should be comparable or less than in our target quasars.
We used DMEXTRACT to extract a PSF in the 0.5-2 keV band centred on each of these X-ray sources, with background taken either from a large annulus further out around each source, or from a neighbouring region free of background sources. The PSF annuli for PG1634+706 and PKS 2126-128 had a narrow angle omitted to either side of the quasar so as to exclude the readout stripes. For comparison, we also created a model PSF for each of the four ‘control’ observations, for the same incident spectrum and position on the chip as the source (as described in the previous section). We again measured the slopes of the profile of the data and its appropriate PSF model at large radii (2-10 arcsec; where the profile is flatter) by a power-law fit. Figure 2 shows that in all these empirical cases the model PSF created for an object has a shallower slope than that taken from the actual data.
We thus will follow a conservative approach in approximating the Chandra PSF of the nuclear X-ray light from each quasar by its MKPSF model PSF. However, we need to extend this PSF model out beyond 10 arcsec, and after experimentation find a simple and sufficient method is to extrapolate each PSF following the power-law slope fit to the model between 5-10 arcsec. This extrapolation is good for the good for the ‘control’ observations (eg PKS2126-158 in Fig 3; note that its profile can be extracted only out to 30 arcsec, as this observation has been made on a subarray of the chip).
4 Results
Figure 2 demonstrates that the model PSFs are shallower than the surface brightness profiles of the four ‘control’ observations over the radial range of 2-10 arcsec. The converse is true for all but one (3C254) of the intermediate redshift quasars, which show an obviously shallower slope than the model PSFs. In order to quantify this difference in PSFs better, and to obtain an estimate of the ‘excess’ luminosity, we compare the model and actual surface brightness distributions in detail for each quasar. To avoid complications from pile-up, we normalize the profiles at the 1.250.25 arcsec radial bin, by which point the quasar flux has dropped by a factor of 20-30. In Figures 3 and 4 we show the surface brightness profiles of each of the five target quasars and the brightest control quasar PKS 2126-128, along with the appropriate model PSF for each. The ratio of the profile of the data to that of the normalized model are also shown for each case in the lower panel.
We add up the excess counts (ie the excess of the data over the model) within two annuli: 1.5–10 arcsec, the region for which the CIAO PSF has been created, outside of any possible piled up contribution from the nucleus; and 10–50 arcsec (10–75 arcsec for 1821+643), using the extrapolated model PSF. [To obtain the total excess counts it is necessary to scale back up by the annular area used in each ring, as well as the factor used to normalize the profiles at 1.25 arcsec.] The excess counts and their 1- uncertainties are listed in Table 4. PKS 2126-128 shows a net deficit of counts on both scales, which supports our approach of using model PSFs scaled at a radius of 1.25 arcsec as indeed a conservative approach. We also estimate a significance for the detection of excess counts by finding the 1- uncertainty predicted from the model PSF counts in the same area; these uncertainties are listed in square brackets next to each value of excess counts.
As can be seen in Figure 4 and Table 4, three of the target quasars (3C263, 3C275.1 and 1821+643) show a clear and very significant excess of counts over the scaled PSF at both the 1.5–10 and 10–50 (or 75) arcsec scale. 3C254 and 3C281 do not show a significant excess on the smaller scale, but do show a signal at 5-6 in the outer annulus, and of 2.5-3 overall.
We use PIMMS to infer a luminosity for this extended emission from the observed excess counts in the large annulus (1.5-50 arcsec), assuming that they are due to simple thermal bremsstrahlung emission from gas at a temperature of 4 keV at the same redshift as the quasar (except for 1821+643, where we use the measured value of 10 keV from Fang et al 2002), and that the light is subject only to Galactic absorption. These luminosities, however, would exclude the very inner (brighter) and far outer regions of any cluster. We correct for this factor by assuming that the excess extended emission follows a beta model, with and a core radius of 100 kpc, in order to estimate the total luminosity of the cluster (ie out to a radius of 5 times the core radius). For all the quasars the total luminosity of a cluster following this profile is only a factor of more than that within the 1.5-50 arcsec annulus. We tabulate the total inferred 0.5-7 keV and bolometric luminosities of the surrounding cluster in Table 4.
5 Discussion and Conclusions
We clearly detect soft X-ray emission associated with a hotspot in one of the lobes of the radio source in three of the 3C quasars. Where seen in other strong radio sources at the centre of a cluster – eg Cygnus A (Wilson, Young & Shopbell 2000), 3C295 (Harris et al 2000), 3C123 (Hardcastle, Birkinshaw & Worrall 2001) – such X-ray emission is well-fit as synchrotron-self Compton emission from the radio-emitting electrons with a magnetic field close to equipartition. This interpretation is supported by the detailed analysis of the X-ray emission from the hotspots and lobes of 3C263 by Hardcastle et al (2002). The smoothed images shown in Figure 1 indicate that there is also jetted soft X-ray emission associated with the radio source axis between the lobes, similar to the inverse Compton emission from lobes and jets in other intermediate-redshift quasars such as 3C207 (Brunetti et al 2002) and 3C 351 (Hardcastle et al 2002).
We find very significant evidence for soft, spatially extended emission around the intermediate redshift quasars 3C263 and 3C275.1, with inferred luminosities for this component of LBol = and respectively. We also find evidence for extended emission around 3C254 and 3C281, of L. We find the excess of counts continues out to at least 50 arcsec, corresponding to around 350–400 kpc at these redshifts. Both the luminosities and the lengthscales of this extended X-ray emission component match well the typical properties of the cores of clusters of galaxies at low redshift.
Despite the conservative approach used in this paper by scaling and subtracting the model PSF at 1.25 arcsec – ie above a radius of 10 kpc for most of our quasars, whereas it is possible that the cluster component may also contribute to the flux at the core of the source – our bolometric luminosity for the cluster around 1821+63 (assuming the observed temperature of 10 keV) agrees well with the Lgiven in Fang et al (2002). Our value of for the bolometric luminosity of the cluster around 3C263 is around half of the value of found by Hardcastle et al (2002).
There is more discrepancy between our Chandra-derived luminosities for the extended component and those published previously for the 3C quasars from ROSAT observations (Crawford et al 1999; Hardcastle & Worrall 1999). First of all we note that with Chandra we are able to resolve out the X-ray emission associated with the radio source and exclude it from the derived surface brightness profile. An immediate comparison of the entries in Tables 2 and 4 shows that the unwitting inclusion of the X-ray hotspots alone in the PSF would boost the cluster luminosities we derive by 45, 25 and 45 per cent for for 3C254, 3C263 and 3C275.1 respectively. Thus correcting for the assumed inclusion of the X-ray hotspot in the ROSAT data, our value for the extended component of 3C275.1 is similar to the ROSAT result (Crawford et al 1999). The cluster component around 3C263 was not previously detected by either Hardcastle & Worrall (1999) or Hall et al (1995), although it is clearly present in the Chandra observation (see also Hardcastle et al 2002). The largest shortfalls in cluster luminosity compared to the ROSAT values (Crawford et al 1999; Hardcastle & Worrall 1999) are for 3C254 and 3C281. We speculate that these differences only serve to highlight the uncertainty in the ROSAT results which could have been affected by an insufficient or erroneous wobble correction, whereas the Chandra data are of superior resolution and quality. We note that a decrease in the derived cluster luminosities from the ROSAT values would be more consistent with the estimates of gas pressure derived from the ionization state of the extended emission-line nebulae (Crawford & Vanderriest 1997, 2000; Bremer et al 1992).
Acknowledgements
We thank Kazushi Iwasawa for discussion about the Chandra PSFs at an early stage in this work, the CXC for provision of software and the PSF library, and the referee for helpful comments. ACF and CSC both thank the Royal Society for financial support.
References
- [] Bremer MN, Crawford CS, Fabian AC, Johnstone RM, 1992, MNRAS, 254, 614
- [] Brunetti G, Bondi M, Comastri A, Setti G, 2002, A&A, 381, 795
- [] Crawford CS, Lehmann I, Fabian AC, Bremer MN, Hasinger G, 1999, MNRAS, 308, 1159
- [] Crawford CS, Vanderriest C, 1997, MNRAS, 285, 580
- [] Crawford CS, Vanderriest C, 2000, MNRAS, 315, 433
- [] Durret F, Pecontal E, Petitjean P, Bergeron J, 1994, A&A, 291, 392
- [] Ellingson E, Yee HKC, Green RF, 1991, ApJS, 76, 455
- [] Fang T, Davis DS, Lee JC, Marshall HL, Bryan GL, Canizares CR, 2002, ApJ, 565, 86.
- [] Hall PB, Ellingson E, Green RF, Yee HKC, 1995, AJ, 110, 513
- [] Hardcastle MJ, Worrall DM, 1999, MNRAS, 309, 969
- [] Hardcastle MJ, Birkinshaw M, Worrall DM, 2001, MNRAS, 232, L17
- [] Hardcastle MJ, Birkinshaw M, Cameron RA, Harris DE, Looney LW, Worrall DM, 2002 (astro-ph/0208204).
- [] Harris DE, Hjorth J, Sadun AC, Silverman JD, Vestergaard M, 1999, ApJ, 518, 213
- [] Hutchings JB, Dewey A, Chaytor D, Ryneveld S, Gower AC, Ellingson E, 1998, PASP, 100, 111
- [] Owen FN, Puschell JJ, 1984, AJ, 89, 932
- [] Sambruna R, Eracleous M, Mushotzky RF, 1999 ApJ, 526, 60
- [] Stark AA, Gammie CF, Wilson RW, Bally J, Linke RA, Heiles C, Hurwitz M, 1992, ApJS, 79, 77
- [] Wilson AS, Young AJ, Shopbell PL, 2000, ApJ 544, L27
- [] Wold M, Lacy M, Lilje P, Serjeant S, 2000, MNRAS, 316, 267
- [] Yee HKC, Green RF, 1987, ApJ, 319, 28
| Name | Redshift | Exposure | NH | Cts/frame time | Off-axis angle | |
|---|---|---|---|---|---|---|
| (ksec) | () | () | (arcmin) | |||
| 1111+408 | 3C254 | 0.734 | 29.67 | 1.9 | 0.615 | 1.35 |
| 1137+660 | 3C263 | 0.646 | 33.03 | 1.2 | 0.646 | 0.85 |
| 1241+166 | 3C275.1 | 0.555 | 24.76 | 2.0 | 0.284 | 0.64 |
| 1305+069 | 3C281 | 0.602 | 15.85 | 2.2 | 0.474 | 1.29 |
| 1821+643 | 0.297 | 99.62 | 4.0 | 0.611 | 0.14 |
The Galactic absorption values given in the fifth column (NH) are estimated using the
hydrogen column densities from Stark et al (1992).
In the case of 3C263, only the usable time from the total exposure is
given in column 4.
| Hotspot | RA | Dec | Radius | 0.5-7 keV | 0.5-2 keV | 2-7 keV | L(0.5-2 keV) | LBol |
|---|---|---|---|---|---|---|---|---|
| (J2000) | (J2000) | (arcsec) | (counts) | (counts) | (counts) | () | () | |
| 3C254 (W) | 11:14:37.75 | +40:37:22.88 | 2 | 21.34.7 | 18.74.4 | 2.61.7 | 5.71.3 | 35.28.3 |
| 3C263 (SE) | 11:39:59.48 | +65:47:43.66 | 2.5 | 82.89.2 | 68.48.3 | 14.43.9 | 14.11.7 | 87.510.6 |
| 3C275.1 (NW) | 12:43:57.40 | +16:23:01.48 | 2 | 69.58.4 | 55.87.5 | 13.73.7 | 11.11.5 | 68.89.2 |
| 3C281 (N) | 13:07:54.13 | +06:42:28.73 | 5 | 4.0∗ | 4.0∗ | – | 1.5∗ | 9.2∗ |
The counts tabulated were extracted from a circular aperture
centred on the given RA and Dec, using the radius listed in the fourth column.
The luminosities have been estimated
from the soft (0.5-2 keV) countrates assuming that the spectrum of the
hotspot emission follows a power-law model, with only
Galactic absorption along the line of sight.
∗ A feature appears in the smoothed image
of 3C281 (Figure 1) coincident with the radio lobe, but it is not
significant at 3 .
| Name | ObsID | Exposure | RA | Dec | Cts/frame-time | Off-axis angle | Source Description |
| (ksec) | (J2000) | (J2000) | () | (arcmin) | |||
| CD-33 7795 | 971 | 9349 | 11:31:55.24 | 34:36:27.11 | 0.472 | 0.33 | M3Ve T-Tau star |
| 0235+164 | 884 | 27775 | 02:38:38.96 | +16:36:59.94 | 0.115 | 0.62 | OVV QSO |
| PG1634+706∗ | – | 35202 | 16:34:29.04 | +70:31:32.80 | 0.189–0.266 | 0.31-0.34 | QSO |
| PKS 2126-158 | 376 | 34132 | 21:29:12.16 | –15:38:40.69 | 0.645 | 0.35 | QSO |
Cts/frame-time are estimated from the total counts (in the full Chandra energy range) within a 10 arcsec radius aperture centred on
the source.
∗PG1634+706 is the merged image from 6 different observations,
accounting for the range in cts/frame-time and
off-axis angle given.
| Excess counts [] | Excess counts [] | Excess counts [] | L(0.5-7 keV) | LBol | |
|---|---|---|---|---|---|
| (1.5-10′′) | (10-50′′) | (1.5-50′′) | () | () | |
| 3C254 | 13.513.5 [12.9] | 29.59.1 [6.0] | 43.116.3 [14.2] | 3.081.16 | 3.671.39 |
| 3C263 | 137.523.4 [20.1] | 129.114.6 [7.9] | 266.627.6 [21.6] | 13.341.38 | 16.361.69 |
| 3C275.1 | 108.613.8 [8.3] | 15.87.1 [3.1] | 124.415.5 [8.9] | 6.340.79 | 7.570.92 |
| 3C281 | 7.112.0 [11.5] | 25.58.6 [4.3] | 32.614.7 [12.3] | 3.031.37 | 3.591.89 |
| 1821+643 | 1038.042.3 [27.2] | 4142.472.0∗ [12.2] | 5180.483.5∗ [29.8] | 301.734.86† | 485.397.82† |
The 0.5-2 keV counts in excess of the scaled model are given
summed over radii of 1.5-10 arcsec (second column), 10-50 arcsec
(third column) and 1.5-50 arcsec
(fourth column). The exception (marked by an asterisk) is for 1821+643
where the excess counts in the third and fourth columns are from an
annulus reaching out to 75 arcsec.
The 1- uncertainties in the excess counts are also given. The
uncertainty on the predicted counts from the model PSF is listed in square brackets next to each value.
The luminosities given are the total cluster
luminosity, scaling up from the 0.5-2 keV counts from the 1.5-50 arcsec annulus
(fourth column); see text for details. The conversion assumes a
thermal bremsstrahlung spectrum from gas at a
temperature of 4 keV at the redshift of the quasar.
The exception is again 1821+643 (luminosities marked by a †)
where we have assumed a temperature of 10 keV as measured by Fang et
al (2002).