BeppoSAX observation of the cluster Abell 970
We report new results on the cluster of galaxies Abell 970 obtained from X-ray observation with BeppoSAX. Our analysis of the BeppoSAX MECS and LECS data in the range [0.15–10] keV reveals a mean cluster gas temperature of , a metallicity of , and an interstellar hydrogen absorption density column of cm-2. Moreover, we obtained azimuthally averaged radial profiles of these quantities. Our results are consistent with the hypothesis that Abell 970 has been disturbed by a past merger or by the ongoing merger process of a substructure, that put the cluster out of equilibrium. This is also demonstrated by the offset between the gas and galaxy distributions. Combining the X-ray data with a recently published analysis of new galaxy radial velocities, we conclude that a subcluster 8 arcmin to the NW is falling into Abell 970 and will merge in a few Gigayears, thus disturbing Abell 970’s newly acquired equilibrium. The high -elements/iron ratio that we derive for this cluster supports the hypothesis of early intracluster medium enrichment by Type II supernovae.
Key Words.:
galaxies: clusters: Abell 970 – clusters: X-rays – clusters: abundances1 Introduction
Rich clusters of galaxies are the last structures to collapse in the Universe. When isolated and within its virial radius, the cluster contents should already be in quasi-stationary equilibrium by now. However, according to the hierarchical structure formation scenario, rich clusters are formed by the accretion of dark matter dominated haloes (White & Rees 1978 and, e.g., the -body simulations of Evrard et al. 2002). These recurring merger events will affect the cluster, moving it away from an equilibrium state. Therefore, the study of the morphology and dynamics of cluster of galaxies can give valuable information on structure formation in the Universe.
The hot (–10 keV) and tenuous (central density, cm-3) X-ray emitting gas found in rich clusters of galaxies is an excellent tool to probe the cluster properties and past history. As it was already recognized almost three decades ago (Lea et al. 1973), the short relaxation time of the gas, and the fact that the main emission mechanism is the optically thin thermal bremsstrahlung, make it an excellent tracer of the cluster gravitational potential well.
Besides the temperature and density, the X-ray observation of the intracluster medium (ICM) can be used to measure the metal abundance (hereafter metallicity) of mainly iron, but also of some -elements. Such observations can contribute to our understanding of gas enrichment in clusters, which depends on the early evolution of galaxies in clusters and their interaction with the intra-cluster medium.
Here, we present an X-ray study of Abell 970 (, richness class , B-M type III) following the work of Sodré et al. (2001, Paper I hereafter).
This cluster is in a rather dense environment, being part of the Sextans supercluster (number 88 in the catalogue of Einasto et al. 1997, and number 378 in the catalogue of Kalinkov et al. 1998, which also includes Abell 978, 979, and 993). It has moderate X-ray luminosity and it was observed with the Einstein Imaging Proportional Counter (e.g. Jones & Forman 1999); it was also detected in the ROSAT Bright Survey Catalogue (Schwope et al. 2000), although a pointed observation has never been carried out with ROSAT. In the study of White et al. (1997) using Einstein IPC data, it has been found that Abell 970 has at most a weak cooling flow, of about yr-1 (see also Loken et al. 1999).
In the dynamical analysis made in Paper I, we found that the galaxies in Abell 970 have a mean velocity dispersion of 845 km s-1 (and up to km s-1 in the centre). This analysis also indicated that this cluster must have substructure and is out of dynamical equilibrium. This conclusion is also supported by an offset in the peaks of the surface density distribution and the X-ray emission obtained from an Einstein IPC image. Further support came from a large-scale velocity gradient in the cluster. We also found a discrepancy between the dynamical masses inferred from the virial theorem and those inferred with the X-ray emission, which is expected when the galaxies and the gas inside the cluster are not in virial (or hydrostatic) equilibrium. Here we present new results on the distribution of temperature, density, and abundances of the X-ray emitting gas, as well as its -elements/iron ratio.
This paper is organized as follows. We describe in Sect. 2 the data obtained with BeppoSAX. In Sect. 3 we present the X-ray fluxes and luminosities and determine and analyse the temperature and metallicity radial profiles. The cluster gas and dynamical masses are estimated in Sect. 4. In Sect. 5 we discuss the possible merging scenario of Abell 970, and in Sect. 6 we give the individual metal abundances and discuss the consequences for the ICM enrichment modelling.
2 The Data
Abell 970 was observed in July 2000 by the BeppoSAX satellite (Boella et al. 1997a) with two of the narrow field instruments: the LECS providing sensitivity in the [0.1–4.0] keV band (Parmar et al. 1997), and the MECS 2 and 3, which are sensitive in the [1.6–10.5] keV range (Boella et al. 1997b). The net exposure times were and s for the MECS and LECS, respectively.
We restricted the scientific analysis to the 8 arcmin (kpc at the distance of Abell 970) circle centered at the aim point of the LECS and MECS instruments in order to prevent severe vignetting effects (Cusumano & Mineo 1998). Moreover, the MECS entrance window is supported by a beryllium “strongback” that is opaque to low energy photons (keV) and is not taken into account in the effective area files (Fiore, private communication). The strongback structure affects detector positions between to (Cusumano & Mineo 1998). Since we are analysing data inside the MECS window structure, we opted for combining both MECS 2 and 3 event files in order to improve the signal-to-noise ratio, instead of analysing them separately as De Grandi & Molendi (2002), which would be essential for an analysis extending beyond .
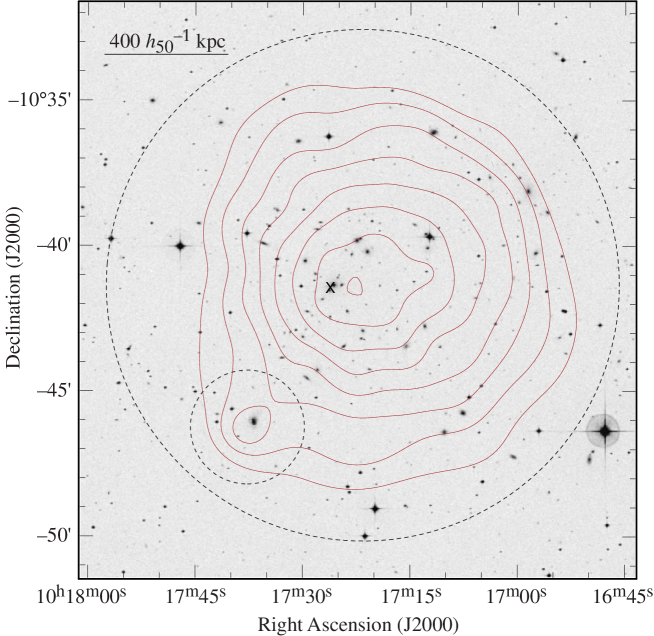
Figure 1 shows the X-ray isocontours superposed on a “Second Epoch Survey” DSS optical image111The “Second Epoch Survey” of the southern sky was made by the Anglo-Australian Observatory (AAO) with the UK Schmidt Telescope. Plates from this survey have been digitized and compressed by the STScI UK Schmidt Telescope and the Digitized Sky Survey.. The event file coordinates were corrected for the systematic error reported by the BeppoSAX team.222cf. www.asdc.asi.it/bebbosax/coord_correction.html.. After correction, we verified a very good matching of both the MECS and LECS images to the Einstein IPC image (see Paper I), including the small X-ray peak at the SE, which, as pointed out in Paper I, is associated to a pair of interacting cluster galaxies (numbers 37 and 38 of Paper I catalogue: , , J2000). The distance between the optical position of the pair and the associated X-ray peak is less than .
A comparison of Figure 1 with the Einstein IPC image (Figure 4 of Paper I) demonstrates that most of the features seen here were already present in the IPC image. The peculiar offset between the X-ray and the galaxy distribution maxima noticed before – about 0.8 arcmin – is also evident. As discussed in Paper I, this offset is a consequence of the displacement of the X-ray isophotes in the direction of a concentration of galaxies to the northwest (, ) which is centered on the brightest cluster galaxy. This galaxy group however has no associated X-ray excess (see also Fig 7, below).
Given the moderate spatial resolution of the MECS and LECS detectors (FWHM 1.4 arcmin at 6 keV and 3.6 arcmin at 2 keV, respectively), we have defined sub-regions in the field of view in order to perform separate spectral analysis. The X-ray data in these regions were extracted with xselect 2, from the HEAsoft package333A service of the Laboratory for High Energy Astrophysics (LHEA) at NASA/ GSFC and the High Energy Astrophysics Division of the Smithsonian Astrophysical Observatory (SAO)..
We have defined 6 concentric annuli, each wide (11 pixels), centered at the X-ray maximum (, ). These regions are employed to derive the radial profiles of various physical quantities. Notice that the last annulus extends over the detector region affected by the MECS “strongback”.
We have also defined 4 regions corresponding to the NW, NE, SW, and SE quadrants (excluding the central region, see Sect. 5 for details). This subdivision in sectors is very much like the one used by De Grandi & Molendi (1999). These regions, which are depicted in Fig. 7 below, were chosen based on the galaxy distribution and their velocity distribution (c.f. Paper I). Finally, we have defined a circular region of 2 arcmin (15 pixels) radius centered at the peak of the SE X-ray excess (, , see Fig. 1).
The X-ray spectrum of each region was modelled as being produced by a single temperature plasma and we employed the mekal (Kaastra & Mewe 1993; Liedahl et al. 1995) model. For the whole cluster data, we also used the vmekal model which allows the individual abundances for the elements to be fitted independently. However, the abundance of some metals cannot be constrained by the spectral fitting, therefore we have only used the following elements: Si, S, Ar, Ca, Fe, and Ni. The others metals were fixed to .
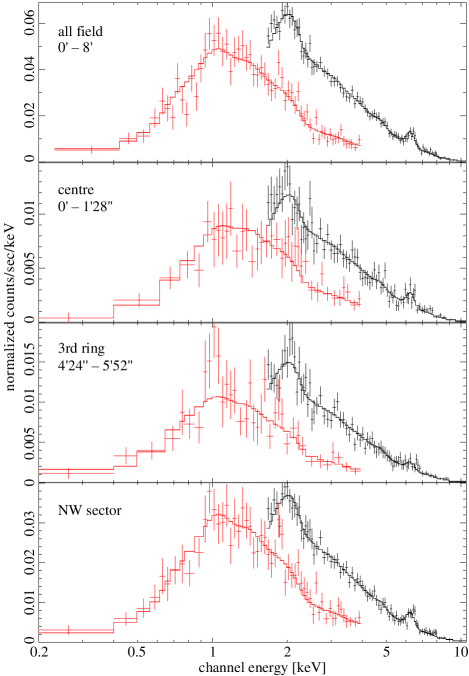
The spectral fits were done using xspec v11.0. Following the BeppoSAX “Cookbook” (Fiore et al. 1999), we have selected the data in the energy range [0.12–4.0] keV for the LECS, and [1.65–10.5] keV for the MECS. The photoelectric absorption – mainly due to neutral hydrogen – was computed using the cross-sections given by Balucinska-Church & McCammon (1992), available in xspec. Figure 2 shows four examples of spectral fits.
For the last annulus, we have also done the spectral fits using only MECS data in the interval [5.0–10.5] keV, in order to check the masking effect of the “strongback”. We verified that the difference between the best fit values obtained either in the full energy range [1.65–10.5] keV or in the [5.0–10.5] keV range is well within the error bars (cf. below, Sect. 3.2).
Background spectra were constructed from the event files (produced by the BeppoSAX Science Data Centre) of the standard background data, which represent an assemblage of several empty fields devoid of any noticeable source. For the MECS, we have used the combined background for detectors 2 and 3 available from the BeppoSAX web site (under /pub/sax/cal/bgd/98_11). For the LECS, we have used the background event file described by Parmar et al. (1999) and available at /pub/sax/cal/bgd/99_12. The background spectra were extracted at the same regions (in detector coordinates) defined above and used in the spectral fits.
3 Results
3.1 Flux and luminosity
Table 1 summarizes the fluxes and luminosities obtained for the whole usable field and the central region. The bolometric X-ray luminosity implies keV based on the – relation for clusters obtained by Xue & Wu (2000).
| Region | flux | flux | |||
|---|---|---|---|---|---|
| [0.1–2.4] | [0.5–4.5] | [0.1–2.4] | [0.5–4.5] | bolom. | |
| All field | 27.8 | 30.0 | 42.2 | 46.3 | 83.1 |
| Centre | 5.13 | 5.69 | 7.78 | 8.75 | 16.3 |
Note: flux units are erg cms-1.
Luminosity units are erg s-1.
As suggested in Paper I, the SE X-ray emission excess visible in Fig. 1 may be due to an active nucleus excited by the merger of the pair of interacting galaxies. In order to verify this hypothesis, we have extracted a spectrum in a 2 arcmin circle comprising this feature and tested different spectral models (see Table 2).
| Model | dof | ||||
|---|---|---|---|---|---|
| pow | — | — | 80.7/89 | ||
| mekal | — | 80.0/89 | |||
| mekal | — | 81.1/90 | |||
| mekal | — | 94.1/89 | |||
| mekal | — | 95.3/90 |
‡ Value fixed.
We have tested a power-law (pow) and a thermal plasma (mekal) models. A composite model, power-law plus mekal (i.e., a non-thermal source superposed on the cluster thermal emission) could not be fitted unambiguously – fits with different initial parameters ended with different minimum in parameter space. Therefore, we considered two opposite scenarios: I) the X-ray excess comes from a non-thermal source and the emission inside a circle of 2 arcmin will be dominated by a power-law spectrum; II) the merging galaxies have no AGN and the emission is mostly of thermal origin.
We found that the best models, both statistically equivalent, are the power-law and the thermal plasma endowed with the unreasonable high temperature of 14 keV or more. Fixing the plasma temperature at 4.5 keV (i.e., about the cluster mean temperature, see below), whether or not keeping fixed metallicities and , produces poorer fits. We are thus led to suggest that the X-ray source is of non-thermal origin, probably due to the nuclear activity of one or both of the components of the interacting pair of galaxies optically associated to it. This conclusion should however be regarded with caution given the poor quality of the spectrum in this region, with net counts rates of count/s for the MECS and count/s for the LECS.
3.2 Radial profiles
We have computed the radial profiles for several astrophysical quantities using the circular annuli defined in Section 2, with the combined MECS and LECS data. Since the SE X-ray excess may be of non-thermal origin, we have done the spectral fits excluding and including this region. The results are virtually the same, because the contribution of the SE excess to the X-ray counts inside the annuli is not significant. The X-ray SE excess was therefore excluded from the data prior to the spectral fits presented here.
Figure 3 shows the resulting temperature profile444Actually, it is the emission weighted temperature that is obtained in a spectral fit. However, for physical realistic gas models, the difference between the actual gas (electron) temperature and the measured emission weighted temperature should be negligible and well within the observational uncertainties (Komatsu & Seljak 2001)..
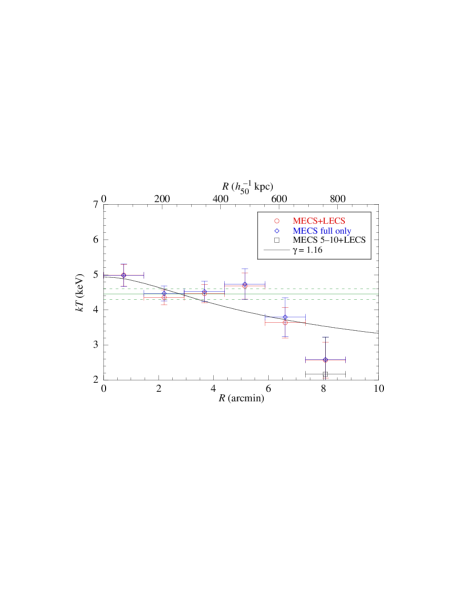
The temperature profile was also determined using only MECS data and fixing cm-2 (the galactic value, (Dickey & Lockman 1990). This was done for two reasons: first, to check the robustness of the fits, whether or not there was any spurious effect introduced by the use of two different detectors.
The second reason is that when both the temperature and hydrogen column density are taken as free parameters, and depending on the spectral range being adjusted, the spectral fitting procedure may produce spurious correlations between best-fit values of and [see, e.g., Pislar et al. (1997)].
As it can be seen from Fig. 3, the resulting temperature profiles, that is, for MECS data only and fixed at the galactic value and for the combined MECS and LECS data and free, are almost indistinguishable. This demonstrates the internal consistency of the modelled temperatures and a spurious correlation between fitted and values is not present.
An additional fit for the outermost annulus was done using only the [5.0–10.5] keV MECS data (but still using the full LECS). This was done to verify whether or not the MECS “strongback” has an important masking effect for low energy photons. It turns out that the effect on the temperature determination is within the error bars (which increases compared to the fit using the full MECS range).
A simple parametric form of the ICM temperature can be obtained using the polytropic equation of state. A polytropic model for the ICM is motivated by the results of hydrodynamical simulations (e.g., Suto et al. 1998), theoretical models (e.g., Cavaliere et al. 1999; Dos Santos & Doré 2002), and observed temperature gradients (e.g., Markevitch et al. 1999; Finoguenov et al. 2001a, , but see also Irwin et al. 1999; Irwin & Bregman 2000; De Grandi & Molendi 2002 for a different observational result – see discussion below).
The polytropic gas is defined by:
| (1) |
where and are the pressure and density of the gas, respectively, and is the gas polytropic index. For an ideal gas, ( is the number density of particles), therefore the temperature and density are related by:
| (2) |
For the gas density profile, we use the well known -model (Cavaliere & Fusco-Femiano 1976):
| (3) |
where , and are the central density, the core radius, and the shape parameter. We adopt the values determined in Paper I: and kpc or arcmin. For our considerations we have used the Einstein IPC results because this instrument provides a higher spatial resolution (about 25 arcsec) compared to the BeppoSAX MECS (about 1.5 arcmin). The temperature profile is then written as:
| (4) |
where is the central temperature.
A least-square fit of Eq. (4) yields and with for 4 degrees of freedom. This value agrees well with those predicted by Komatsu & Seljak (2001) and found by Finoguenov et al. (2001b). The fit, shown in Fig. 3, is poor because of the very steep temperature gradient beyond 5 arcmin. In their study of a sample of 21 nearby clusters observed with BeppoSAX, De Grandi & Molendi (2002) find that the temperature profiles of clusters are characterized by isothermal cores extending to about one-fifth of the cluster virial radius, followed by steep temperature gradients which are steepest for the non-cooling flow clusters. These authors also find poor fits when trying to adjust a polytropic law to the overall temperature profiles. This situation is much similar to that observed in Abell 970 which, when compared to their sample of non-cooling flow clusters, presents a steeper gradient. In section 4.2 we use both the isothermal and the polytropic model to estimate the total cluster mass.
We may check whether the last three radial points still correspond to a stable state or whether the temperature gradient is too steep for stability. If we take into account only the three external points, i.e., arcmin, the polytropic index increases to , which is slightly above the ideal gas value, 5/3, suggesting that the outer region may be barely in stable equilibrium.
The mekal plasma model spectral fit also gives the ICM metallicity. Figure 4 shows the metal abundance radial profile. In order to check the fit robustness, we also did the profile determination using only the MECS data, besides the fits using both detectors. Both profiles are very similar, well within the error bars.
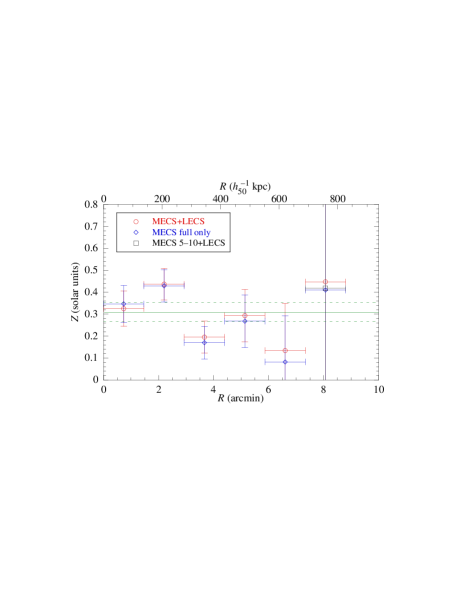
As before, we made an additional fit for the last annulus using only photons with keV. Although the metallicity value obtained is close to the spectral fit with the full MECS range, the error bars are so big that, in fact, the metallicity should be considered undetermined at this last annulus.
The metallicity profile shown in Fig. 4 has no apparent gradient, being consistent with the mean value found for the whole cluster (which is a typical value for a cluster of such richness and temperature). Contrary to some other clusters, e.g., Abell 496 (Dupke & White 2000, using ASCA data) or Abell 85 (Lima Neto et al. 2001, using BeppoSAX data), this cluster does not show an increase of metal abundance in the centre (defined by the X-ray peak emission). Irwin & Bregman (2001), also using BeppoSAX data, find that clusters generally show a negative metallicity gradient, but this gradient is usually smaller or even disappears in non-cooling flow clusters.
Figure 5 shows the radial profile of hydrogen column density. For comparison we also show the galactic value at the position of Abell 970. Here we observe a gradient, with significantly higher hydrogen column density in the inner 2 arcmin. This excess is significant at a 2- level, ignoring the uncertainty of the galactic measure.
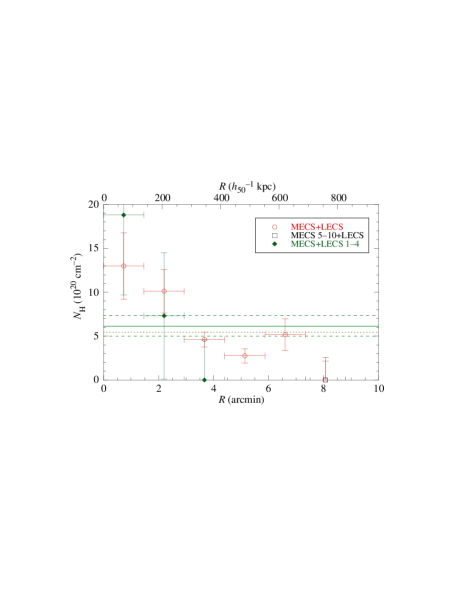
This level of significance may indicate that we are detecting an X-ray absorption excess compared with the expected absorption predicted by the observed galactic HI column density. The origin of such an excess is still controversial (Allen 2000, and references therein), the most promising hypotheses being very cool molecular gas and/or dust grains. Moreover, the amount of this cool material depends on the details of the spectral modelling (McCarthy, West & Welch 2002).
Figure 5 shows that decreases outwards, reaching the galactic value. However, a caveat must be introduced here: (I) there may be variations of the galactic that are unresolved by the galactic survey at the cluster scale; (II) the determination relies almost exclusively on the LECS data (photon energy keV). The error bars in this case may be underestimated given the low count rate, specially at the last bin.
Moreover, there are a number of issues associated with lowest energy photons detected by the LECS: the spatial resolution is poor (arcmin) and there is a disagreement between the measured (on-ground) and theoretical effective area for keV (see Parmar et al. 1997). Selecting only LECS counts with keV (the spatial resolution is arcmin at keV) can minimize these effects. Figure 5 shows the additional determination with such a selection, for the centre and the first two rings. The error bars are significantly larger, but the central excess in modelled neutral hydrogen column density is still present at significance.
4 Cluster mass
4.1 Gas mass
In order to determine the cluster gas mass we assume that the gas distribution can be described by a spherically symmetric -model profile with values of core radius, , and shape parameter, as determined in Paper I. With the good quality spectrum we now dispose, it is possible to estimate the central electronic density, , as follows.
We integrate the bremsstrahlung emissivity along the line-of-sight, in the energy bands given in Table 1 and obtain . Taking into account the error bars in and , we obtain cm-3. Notice that the shape of the temperature profile has only a minor effect (less than 5%) in the determination of .
4.2 Dynamical mass
With the density and temperature profiles, we can estimate the total cluster mass. Supposing the ICM is in hydrostatic equilibrium, the total “X-ray” dynamical mass (i.e., the dynamical mass determined from an X-ray observation, not to be confused with the mass of the X-ray emitting gas) inside is given by:
| (5) |
where is the mean mass per particle ( for a fully ionized primordial gas) and is the proton mass. We assume that matter is distributed spherically.
Adopting the -model to describe the intracluster gas density and the polytropic equation of state, the dynamical mass results in:
| (6) |
When we have the usual expression for the isothermal sphere. Figure 6 shows the mass profile computed both with an isothermal temperature and polytropic model.
The dynamical masses estimated here are about 15% to 25% higher than those given in Paper I where a 3.3 keV isothermal model was assumed.
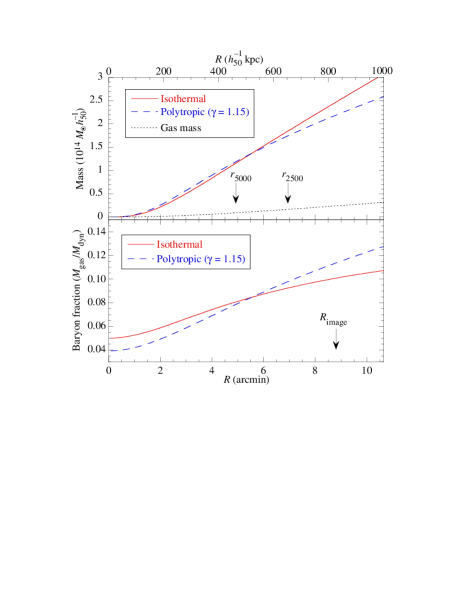
We can now compute the radius corresponding to the density ratio (see Appendix). For , we have the usual that is often used as an approximation to the virial radius (e.g., Lacey & Cole 1993). Assuming either an isothermal or polytropic profile, we obtain Mpc and Mpc, respectively. Thus, , the maximum radius analysed, is 0.33–, depending on the adopted temperature profile.
From the dynamical and gas mass profiles, we can derive the baryon fraction profile, , assuming that the bulk of the baryons are in the cluster ICM (i.e., ). The neglect of the galactic contribution (about 5 to 10% of the total mass, see Paper I), underestimates by just a few percent.
The bottom panel of Fig. 6 gives the estimated baryon fraction profile. For reference, we show and , the radii within the mean cluster density is 2500 and 5000 times the value of the critical density of the Universe.
The gas mass fraction obtained here agrees with the typical values obtained by White & Fabian (1995) (at Mpc) and by Allen et al. (2002) (at ). However, the shape of the is much flatter than the profiles computed by Allen et al.. A possible explanation might be the adopted model for the mass: while we assume a -model for the gas profile, Allen et al. adopt the NFW profile (Navarro et al. 1997) for the total mass.
Finally we must stress that although the new estimates of the X-ray dynamical mass presented here are higher than those given in Paper I, they are still a factor, –10, below the virial mass estimates (VME) obtained by the application of the Virial Theorem to the galaxies. As discussed in Paper I, in the case of equilibrium, the dynamical mass by the VME should not be overestimated by more than 20%. We are thus lead to interpret the large discrepancies between the virial theorem and the X-ray dynamical mass estimates as evidence of a non-equilibrium state of cluster. Indeed, in Paper I we had already remarked the incidence of substructures in the galaxy projected distribution and of a large scale gradient of their line-of-sight velocities, which are strong signs that the cluster is out of equilibrium. We will discuss more in the following Section.
5 Cluster merging
Figure 7 shows the temperature and metallicity measured in four quadrants: NW, NE, SW, and SE region.
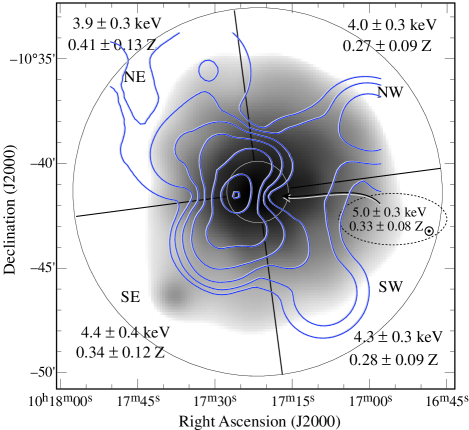
As it can be seen from this figure, there is a hint of a temperature gradient in the North–South direction. Also, there is a possible metallicity gradient in the NE–SW direction. However, within their error bars, those values are also compatible with an isotropic distribution. In Paper I, it has been shown that there is a large-scale gradient of the local mean velocities of the cluster galaxies. The general direction of this velocity gradient is approximately the same as the temperature gradient hinted in Figure 7.
Moreover, we observe that the irregular galaxy distribution does not coincide with the X-ray emission map. There is also a discrepancy between the dynamical mass determined by the virial theorem and X-ray gas emission (see Sect. 4). These features are recognized as signs of past mergers between sub-clusters. We may infer that, in this case, the merger is not so recent, since the X-ray distribution already shows a fairly axial symmetric distribution.
From another perspective, as discussed in Paper I and shown in Fig. 7, the galaxy distribution presents a substructure located at a projected distance of kpc ( arcmin) NW of the centre, with a velocity dispersion of km s-1 inside a circular radius of kpc ( arcmin). This was interpreted as a group falling into the core of Abell 970. Taking into account the mean velocities of the central region, km/s, and NW substructure, , (cf. Paper I), then we can roughly assume that the substructure may be falling with a velocity in the range 50–350 km/s. Consequently, with such a crude estimate, we conclude that a merger will occur in the next 2–6 Gyr.
Another possibility is that this substructure has already passed near the cluster centre, disturbing the overall cluster equilibrium, and will come back again to the cluster central regions, before being destroyed.
Therefore, the galaxy distribution (spatial and velocity) together with the X-ray isophote off-centre and possible temperature gradient suggest that Abell 970 is between two merger events: the first one that is responsible for the offset between the X-ray and galaxy distributions; the second one will occur when the NW substructure falls into the central part of the cluster.
6 Metal abundances
The pattern observed in the heavy-element abundances of the intracluster medium provides important clues on the types of galaxies and stars producing these elements and the mechanisms responsible for their removal from the interstellar medium of their parent galaxies.
Using the whole 8 arcmin field (0.33–, see Sect. 4.2), we fitted a plasma model with the following metal abundances as free parameters: Si, S, Ar, Ca, Fe, and Ni. The following element abundances were fixed to : He, C, N, O, Ne, Na, Mg, and Al.
The result is summarized in Figure 8, which shows the over-abundance of -elements relative to iron. Both the silicon and sulphur abundances are consistent with the typical values found recently by Finoguenov et al. (2001b) and are slightly above the value determined by Fukazawa et al. (1998) for a cluster of keV (which is –, cf. Fig. 2 of their paper). These authors have shown that the Si abundance correlates with the gas temperature, probably due to a decreasing contribution from Type II supernovae (SNe) in poorer clusters, where the metals produced by this type of SN could escape from the potential well.
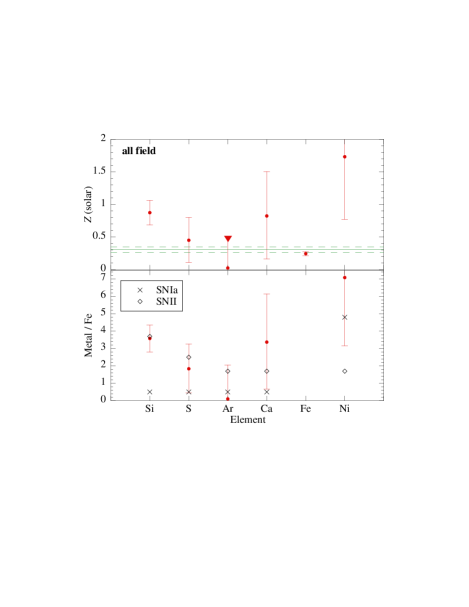
The over-density of -elements displayed in Fig. 8 is characteristic of the Type II SNe yield. This suggests that the intracluster gas enrichment was caused by ejected gas that was synthesized in massive stars, the progenitors of Type II SNe. Present day elliptical galaxies show a very low rate of Type II SNe, implying that the enrichment of the intracluster gas probably occurred early in the history of the cluster.
However, we cannot discard other possible enrichment mechanisms. In fact, as shown in Figure 8, the abundance ratio Ni/Fe is higher than expected for Type II SNe, but it is in agreement with the expected Type Ia SNe yield. This finding supports models where part of the metals in the ICM were produced by Type Ia SNe and which were either blown from the galaxies by SNe explosions or swept by ram-pressure (e.g., Dupke & White (2000)). However, the Ni abundance is uncertain. Moreover, the abundance ratio Si/Fe (with its smaller error bars) is incompatible with enrichment by Type Ia SNe.
7 Conclusions
We have presented here a new X-ray observation of Abell 970. Below we summarize our main results.
-
•
Although Abell 970 presents rather symmetric X-ray isophotes (except for an excess emission that is probably due to an active galactic nucleus, triggered by a galaxy merger), the peak of the X-ray distribution does not coincide with the centre of the galaxy distribution.
-
•
The temperature profile presents a strong radial gradient at arcmin, which is barely compatible with adiabatic stable equilibrium. The metal abundances are approximately constant up to 8 arcmin. There are indications of non radial temperature and metallicity gradients (but with confidence levels less than ), notably in the NW–SE direction, the same direction where a gradient in velocity is observed (cf. Paper I).
-
•
With the two findings above, we arrive at two possible scenarios for the recent history of Abell 970: either it has suffered a recent merger with a subcluster, or the NW substructure (detected only from galaxy counts) has recently passed through the centre of Abell 970. In both cases, the dynamical stability was disrupted, but the cluster is now approaching virial equilibrium again. The observed galaxy distribution suggests that this equilibrium will be broken in a few Gigayears when the nearby NW substructure will fall (again?) into the core of Abell 970.
-
•
We have derived an abundance ratio between -elements/iron greater than 1 and the iron metallicity is lower than the mean metallicity. The over abundance of -elements may be an indication of an early enrichment of the ICM by Type II supernovae in elliptical galaxies. Part or the metals in the ICM could be produced by Type Ia SNe, but the evidence from the Ni/Fe ratio is not strong.
-
•
We have found a central X-ray absorption excess compared to the absorption expected from the mean galactic value of , although the statistical error bars are large. The central excess could be associated to the central galaxies and/or to cooled intra-cluster material (either in molecular form and/or dust grains). The latter may be preferable since the core of the cluster is dominated by early-type galaxies. However, this result probably depends on the spectral modelling (see, e.g., McCarthy, West & Welch 2002).
Acknowledgements.
We would like to thank Gary Mamon and an anonymous referee for a critical reading of this paper. We acknowledge support from the COFECUB (Comité Français pour l’Evaluation de la Coopération avec le Brésil), CNPq (Conselho Nacional de Desenvolvimento Científico e Tecnológico), fapesp (Fundação de Amparo à Pesquisa do Estado de São Paulo), pronex, and the PICS France–Brazil cooperation. DP acknowledges IAG/USP for its hospitality. This research has made use of SAXDAS linearized and cleaned event files (Rev.1.1) produced at the BeppoSAX Science Data Center.Appendix A Derivation of
In Paper I, we give a formula for , which is defined by:
| (7) |
where is the mean density of the cluster inside and is the critical density of the Universe at the redshift of the cluster.
We take the dynamical mass corresponding to a -model ICM and polytropic temperature profile, Eq. (6), and the critical density given by:
| (8) |
with
| (9) |
Combining these equations and solving for we obtain:
| (10) |
where the cluster central temperature, , is given in keV and the core radius, , in kpc. For , , and Eq. (10) is simplified:
| (11) |
When , the isothermal case is obtained and is the mean temperature.
For we can use the approximation:
| (12) |
References
- Allen (2000) Allen S.W., 2000, MNRAS 315, 269
- Allen et al. (2002) Allen S.W., Schmidt R.W., Fabian A.C., 2002, MNRAS 334, L11
- Balucinska-Church & McCammon (1992) Balucinska-Church M., McCammon D., 1992, ApJ 400, 699
- Boella et al. (1997a) Boella G., Butler R.C., Perola G.C., Piro L., Scarsi L., Bleeker J.A.M., 1997a, A&AS 122, 299
- Boella et al. (1997b) Boella G., Chiappetti L., Conti G., Cusumano G., del Sordo S., La Rosa G., Maccarone M.C., Mineo T., Molendi S., Re S., Sacco B., Tripiciano M., 1997b, A&AS 122, 327
- Cavaliere & Fusco-Femiano (1976) Cavaliere A., Fusco-Femiano R, 1976, A&A 49, 137
- Cavaliere et al. (1999) Cavaliere A., Menci N., Tozzi P., 1999, MNRAS 308, 599
- Cusumano & Mineo (1998) Cusumano G., Mineo T., 1998, “On-flight calibration of the MECS vignetting”
- De Grandi & Molendi (1999) De Grandi S., Molendi S., 1999, ApJ 527, L25
- De Grandi & Molendi (2002) De Grandi S., Molendi S., 2002, ApJ 567, 163
- Dickey & Lockman (1990) Dickey, Lockman 1990, Ann. Rev. Ast. Astr. 28, 215
- Dos Santos & Doré (2002) Dos Santos S., Doré O., 2002, A&A 383, 450
- Dupke & White (2000) Dupke R.A., White R.E., III, 2000, ApJ 537, 123
- Einasto et al. (1997) Einasto M., Tago E., Jaaniste J., Einasto J., Andernach H., 1997, A&AS 123, 119
- Evrard et al. (2002) Evrard A.E., MacFarland T.J., Couchman H.M.P., Colberg J.M., Yoshida N., White S.D.M., Jenkins A.R., Frenk C.S., Pearce F.R., Peacock J.A., Thomas P.A., 2002, ApJ 573
- Finoguenov et al. (2001a) Finoguenov A., Reiprich T.H., Böhringer H., 2001a, A&A 368, 749
- Finoguenov et al. (2001b) Finoguenov A., Arnaud M., David L.P., 2001b, ApJ 555, 191
-
Fiore et al. (1999)
Fiore F., Guaianazzi M., Grandi P., 1999,
“Cookbook for BeppoSAX NFI spectral analysis”, version 1.2,
www.sdc.asi.it/pub/sax/doc/software_docs/saxabc_v1.2.
ps.gz - Fukazawa et al. (1998) Fukazawa Y., Makishima K., Tamura T., Ezawa H., Haiguang X., Ikebe Y., Kikuchi K., Ohashi T., 1998, PASJ 50, 187
- Irwin et al. (1999) Irwin J.A., Bregman J.N., Evrard A.E., 1999, ApJ 519, 518
- Irwin & Bregman (2000) Irwin J.A., Bregman J.N., 2000, ApJ 538, 543
- Irwin & Bregman (2001) Irwin J.A., Bregman J.N., 2001, ApJ 546, 150
- Jones & Forman (1999) Jones C., Forman W., 1999, ApJ 51, 65
- Kaastra & Mewe (1993) Kaastra J.S., Mewe R., 1993, A&AS 97, 443
- Kalinkov et al. (1998) Kalinkov M., Valtchanov I., Kuneva I., 1998, A&A 331, 838
- Komatsu & Seljak (2001) Komatsu E., Seljak U., 2001, MNRAS 327, 1353
- Lacey & Cole (1993) Lacey C., Cole S., 1993, MNRAS 262, 627
- Lea et al. (1973) Lea S.M., Silk J., Kellogg E., Murray S., 1973, ApJ 184, 105L
- Liedahl et al. (1995) Liedahl D.A., Osterheld A.L., Goldstein W.H., 1995, ApJ 438, L115
- Lima Neto et al. (2001) Lima Neto G.B., Pislar V., Bagchi J., 2001, A&A 368, 440
- Loken et al. (1999) Loken C., Melott A.L., Miller C.J., 1999, ApJ 520, L5
- Markevitch et al. (1999) Markevitch M., Vikhlinin A., Forman W.R., Sarazn C.L., 1999, ApJ 527, 545
- McCarthy, West & Welch (2002) McCarthy I.G., West M.J., Welch G.A., 2002, ApJ 567, 762
- Navarro et al. (1997) Navarro J.F., Frenk C.S., White S.D.M., 1997, ApJ 490, 493
- Parmar et al. (1997) Parmar A.N., Martin D.D.E., Bavdaz M., Favata F., Kuulkers E., Vacanti G., Lammers U., Peacock A., Taylor B.C., 1997, A&A Suppl. 122, 309
- Parmar et al. (1999) Parmar A.N., Oosterbroek T., Orr A., et al., 1999, A&A Suppl. 136, 407
- Pislar et al. (1997) Pislar V., Durret F., Gerbal D., Lima Neto G.B., Slezak E., 1997, A&A 322, 53
- Schwope et al. (2000) Schwope A., Hasinger G., Lehmann I., Schwarz R., Brunner H., Neizvestny S., Ugryumov A., Balega Yu., Trumper J., Voges, W., 2000, AN 321, 1
- Sodré et al. (2001) Sodré L., Jr., Proust D., Capelato H.V., Lima Neto G.B., Cuevas H., Quintana H., Fouqué P., 2001, A&A 377, 428 (Paper I)
- Suto et al. (1998) Suto Y., Sasaki S., Makino N., 1998, ApJ 509, 544
- White et al. (1997) White D.A., Jones C., Forman W., 1997, MNRAS 292, 419
- White & Rees (1978) White S.D.M., Rees M.J., 1978, MNRAS 183, 341
- White & Fabian (1995) White D.A., Fabian A.C., 1995, MNRAS 273, 72
- Xue & Wu (2000) Xue Y.J., Wu X.P., 2000, ApJ 538, 65