Is the afterglow of Gamma Ray Burst 021004 unusual?
Abstract
The bumpy light-curve of the bright optical afterglow (AG) of gamma ray burst (GRB) 021004, its spectral evolution and its radio emission have been claimed to be unusual. In the Cannonball Model of GRBs that is not the case. The very early AG’s shape is, as for GRB 990123, a direct tracer of the expected circumburst density profile. The unprecedented precision of the data allows for the “resolution” of two cannonballs (CBs) in the AG. These two CBs correspond to the two pulses in the GRB and to the two wide humps in the AG light curve. The smaller wiggles in the AG are, as for GRBs 000301c and 970508, to be expected: they trace moderate deviations from a constant density interstellar medium. The observed evolution of the optical spectrum is that predicted in the CB model. The X-ray and radio emissions of GRB 021004 are also normal.
Introduction
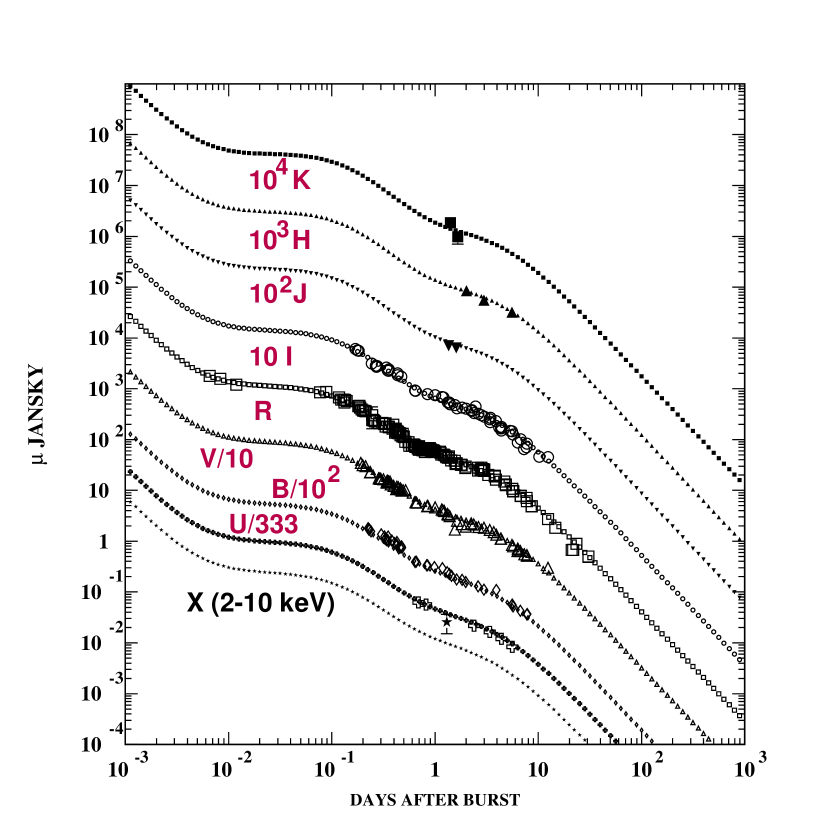
Instruments aboard HETE II detected GRB 021004 at 4.50432 UT October 2002 (Shirasaki et al. 2002). Its bright fading optical afterglow was discovered by Fox et al. (2002) nine minutes after the burst and was soon followed worldwide with many telescopes, quite continuously during the first few days. The unprecedented density and precision of the data are reported in Fig. 1. The redshift of the GRB’s host galaxy, , was first correctly determined by Chornock and Filippenko (2002) and confirmed by Salamanca et al. (2002), Mirabal et al. (2002a), Savaglio et al. (2002), Castro-Tirado et al. (2002) and Matheson et al. (2002). The AG’s brightness allowed precise measurements of its temporal decline, polarization, spectrum, and spectral evolution. The optical light-curves deviate from the smoothly steepening decline observed in most well-studied optical AGs. There are also “unexpected” features in the spectrum (e.g., Salamanca et al. 2002; Mirabal et al. 2002b) and its evolution (e.g., Matheson et al. 2002). The spectrum of the radio to submillimeter wavelengths was also claimed to be “unusual” (Berger et al. 2002a).
In this letter we show that –in the CB model– the only uncommon feature of GRB 021004 is the precision of the measurements. Its most “surprising” properties were anticipated, in the sense that there are –again, in the CB model– precedents for all of them in past GRBs.
1 The Cannonball Model of GRBs
There is mounting evidence that long duration GRBs are produced in the explosions of supernovae akin to SN1998bw (Galama et al. 1998), by the ejection of ordinary baryonic matter –essentially ionized Hydrogen– in the form of plasmoids or “cannonballs” (CBs), with very highly relativistic Lorentz factors () (Dar and De Rújula 2000, 2001, Dado et al. 2002a,b,c,d) but otherwise similar to the ones observed in quasars (Marscher et al. 2002) and microquasars (e.g., Mirabel and Rodriguez 1994; Belloni et al. 1997; Rodriguez and Mirabel 1999; Mirabel and Rodriguez 1999; Corbel et al. 2002, and references therein).
In the CB model (Dar and De Rújula 2000, 2001, reviewed in De Rújula 2002a,b) long duration GRBs and their AGs are produced in core collapse SNe by jets of highly relativistic CBs that pierce through the SN shell and the SN progenitor’s “wind” ejecta. A CB is emitted, as observed in -quasars, when part of an accretion disk falls abruptly onto the newly-born compact central object. Crossing the circumburst shells with a large Lorentz factor , the surface of a CB is collisionally heated to keV temperatures and the radiation it emits when it reaches the transparent outskirts of the shells —boosted and collimated by the CB’s motion— is a single -ray pulse in a GRB. The cadence of pulses reflects the chaotic accretion and is not predictable, but the individual-pulse temporal and spectral properties are. A long list of general properties (Dar and De Rújula 2001) of GRB pulses is reproduced in the CB-model, in which, unlike in the standard “fireball” models, the GRBs’ ’s have a thermal-bremsstrahlung —as opposed to synchrotron— origin111In this (Ghirlanda et al. 2002), as in the relevance of the viewing angle, or the explanation of AG features by density inhomogeneities, the “standard” model is phagocytizing the CB-model’s views..
A CB exiting the circumburst shells soon becomes transparent to its own enclosed radiation. At that point it is still expanding and cooling adiabatically and by bremsstrahlung. The hard bremsstrahlung spectrum dominates the very early X-ray AG (for a few tens of seconds) with a fluence of predictable magnitude decreasing with time as . All X-ray AGs are compatible in magnitude and shape with this prediction (Dado et al. 2002a).
After the first tens of seconds, a CB’s emissivity is dominated by synchrotron emission from the electrons that penetrate in it from the interstellar medium (ISM). Integrated over frequency, this synchrotron emissivity is proportional to the energy-deposition rate of the ISM electrons in the CB222The kinetic energy of a CB is mainly lost to the ISM protons it scatters; only a fraction is re-emitted by the incorporated electrons, as the AG.. These electrons are Fermi accelerated in the CB’s tangled magnetic maze to a broken power-law energy distribution with a “bend” energy equal to their incident energy in the CBs’ rest frame. In that frame, the electrons’ synchrotron emission (prior to attenuation corrections) has an approximate spectral energy density (Dado et al. 2002b):
| (1) |
where is a normalization constant, is the spectral index of the Fermi accelerated electrons prior to the inclusion of radiation losses, is the ISM baryon density, (with ) is the Lorentz factor of the CBs, and is the “injection bend” frequency in the CB’s rest frame333This bend frequency is not the conventional “cooling break”. It reflects an injection bend in the electron spectrum at the energy with which the ISM electrons enter the CB at a particular time in its decelerated motion (Dado et al. 2002b).,
| (2) |
The radiation emitted by a CB is Doppler-shifted and forward-collimated by its highly relativistic motion, and redshifted by the cosmological expansion. A distant observer sees a spectral energy flux:
| (3) |
where is the radius of the CB (which in the CB model tends to a calculable constant value of cm, in minutes of observer’s time), is the total extinction along the line of sight to the CB, is the luminosity distance (we adopt km/(s Mpc), and ), , , and is the Doppler factor of the light emitted by the CB. In the domain of interest for GRBs, and , with the angle between the CB’s direction of motion and the line of sight to the observer,
| (4) |
The total AG is the sum over CBs (or large individual GRB pulses) of the flux of Eq. (3).
For an ISM of constant baryon density , the deceleration of a CB results in a Lorentz factor, , that is given by (Dado et al. 2002a):
| (5) |
where , and characterizes the CB’s slow-down in terms of , its baryon number and , its radius (it takes a distance , typically of kpc, for the CB to slow down to half its original Lorentz factor).
The extinction, in Eq. (3), can be estimated from the difference between the observed spectral index at very early time when the CBs are near the SN and that expected in the absence of extinction (, for ). The CB model predicts —and the data confirm— the gradual evolution of the effective optical spectral index towards the constant value observed in all “late” AGs (Dado et al. 2002a). The “late” index is independent of the attenuation in the host galaxy, since at (observer’s) days after the explosion, the CBs are typically moving in the optically-transparent halo of the host galaxy.
The comparison of the predictions of Eq. (3) with the observations of optical, X-ray and radio light-curves and spectra is discussed in Dado et al. (2002a,b). The results —for all GRBs of known redshift— are very simple, satisfactory and parameter-thrifty. The CB-model results concerning X-ray lines in GRB AGs are also exceptionally predictive, simple and encouraging (Dado et al. 2002e).
2 GRB 021004 in the CB model
Five properties of AGs in the CB model are particularly relevant to GRB 021004:
a. For most GRB optical AGs, good fits are obtained by approximating the ISM-density by a constant (Dado et al. 2000a,b,c,d). One exception is the optical AG of GRBs “caught” at very early times, when the CBs are still moving in a wind-generated density profile . In the CB model the AGs’ flux is proportional to the instantaneous swept-in electron density, implying at very early times, as observed in GRB 990123 and GRB 991216.
b. The achromatic “bumps” in the AGs of GRB 970508 and GRB 000301c are explained (Dado et al. 2002a,b) by inhomogeneities in the density along the CBs’ trajectory, better than by gravitational lensing (Garnavich, et al. 2000). Density changes are expected within star formation regions and upon exit from the superbubbles where most of the SNe take place (Dado et al. 2000a).
c. The data on past AGs were course enough or started late enough for the contributions of different CBs (which can often be resolved as individual pulses in the GRB phase) to coalesce into an AG contribution describable as a single CB or a collection of similar ones. But individual CBs have different properties, and may even be emitted at somewhat different angles, due to precession of the accretion disk relative to the rotation axis of the compact object (Fargion and Salis 1995), as observed in the microquasar SS 433 (Margon 1984).
d. The spectral shape of the AGs and their time-evolution, in particular their steepening at the time-varying frequency of Eq.(2) —towards at late time— is very well supported by the data (Dado et al. 2002b).
e. The excess polarization of AGs above that induced by the ISM in our Galaxy may be largely due to the host galaxy’s ISM. In that case, it should be correlated with the extinction in the host and decline with time as the CBs move into the halo.
The -ray light curve of GRB 021004 shows two prominent pulses separated by seconds (Shirasaki et al. 2002 and http://space.mit.edu/HETE/Bursts/GRB021004/). In the CB model, these correspond to two dominant CBs. The good quality of the optical data for GRB 021004 —and its double-humped burst— make irresistible the temptation to fit its broad-band AG light curves with two CBs, emitted in the same direction relative to the observer444We have also made fits with two different values of the emission angles . They do not improve significantly, and yield similar parameters: two different emission angles are not really necessary., but with otherwise free parameters (normalization, and ). We fix the spectral index in Eq. (1) to the expected , assume a density profile of the form , and fit simultaneously all the reported NIR, optical and radio data.
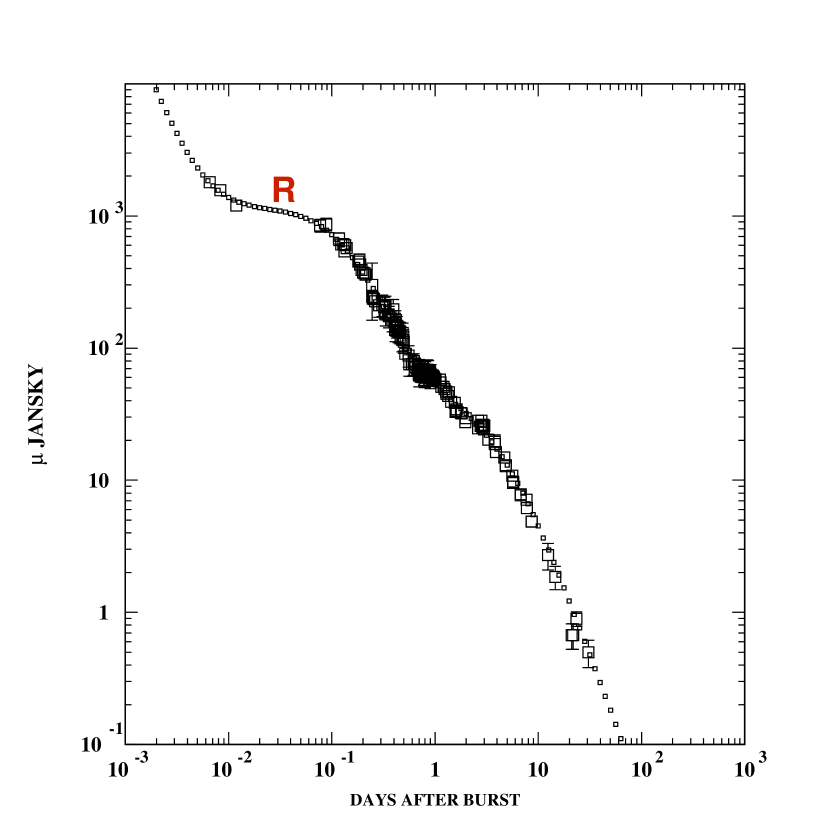
NIR-Optical AG: In Fig. 1 we compare the results of the CB-model’s fit to the data for the NIR-optical lightcurves. We have corrected for selective Galactic extinction in the direction of GRB 021004 (Schlegel et al. 1998): (attenuation magnitudes and in the various bands), and for absorption in the intergalactic space and in the host galaxy in the B and U bands, and mag, estimated from the reported spectra of GRB 021004 (Moller et al. 2002; Matheson et al. 2002; Pandey et al. 2002; Bersier et al. 2002; Holland, et al. 2002; Schaefer et al. 2002). The contribution from the host galaxy to the late AG, normalized to -Jansky in the R band (Holland et al. 2002), was subtracted. The results are very satisfactory though, as befits a rough approximation to a no-doubt very complex system, it is not perfect ( per d.o.f. for 465 data points, if all reported statistical errors smaller than 0.05 mag are fixed to 0.05 mag, to account for uncertainties in calibration and in the conversion from magnitudes to Janskies). The broad-band fitted parameters are, mrad, , (implying , ), kpc and kpc. To demonstrate the real quality of the fit, we have blown up the R-band results in Fig. 2. In the region between and days, the data “wiggle” by as much as 20% around the theoretical curve. It would be easy to correct for this by assuming similar deviations of the ISM density relative to the constant value adopted at large distances, clearly a moot exercise.
Optical Polarization: The observed polarization of the optical AG of GRB 021004, which is consistent with that induced by the ISM in our Galaxy (Covino et al. 2002a,b; Rol et al. 2002; Wang et al. 2002), implies that the polarization induced by the host’s ISM is rather small and consequently the attenuation of the AG in the host must be small, consistent with the CB model fit to the AG.
X-ray AG: The Chandra observations by Sako et al. (2002) in the 2-10 keV domain, from 0.867 to 1.874 days after burst, result in a spectrum and an AG decline , both consistent with the optical observations and with the CB-model’s expectations: and, except at earlier times, an achromatic light-curve. In this GRB, as in most others, the temporal and spectral behaviours are similar in the optical and X-ray bands, as shown in Fig. 1, but synchrotron emission alone underestimates the X-ray fluence (in this case, the optical to X-ray effective index is 0.2 units less steep than the separate indices). The CB-model explanation is that in the X-ray domain not only synchrotron radiation, but also Compton up-scattering and line-emission contribute to the flux (Dado et al. 2002a,b). There is nothing exceptional in the X-ray data for GRB 021004.
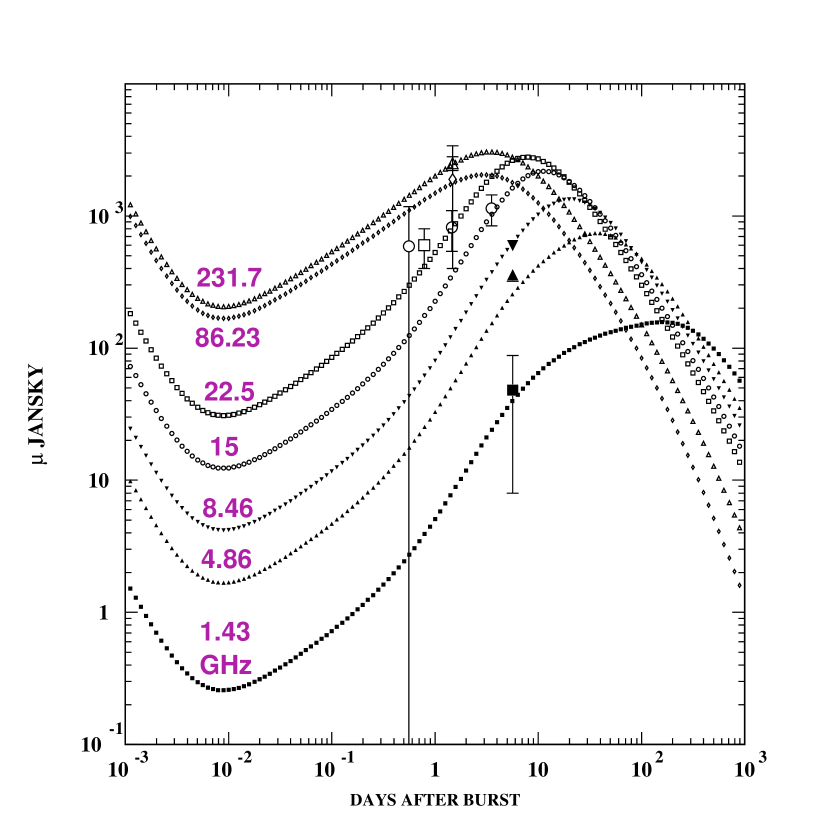
Radio and Submillimeter AG: In Fig. 3 we compare the results of the CB-model’s broad-band fit to the radio and submillimeter data. Unlike the X-ray and optical AGs, the radio AGs are sensitive to self-absorption in the CBs, parametrized by a single absorption frequency (Dado et al. 2002b). The fit value for the CB that dominates the “late” radio AG is GHz, similar to those of other GRBs (Dado et al. 2002b). The fit in Fig. 3 is very satisfactory, in particular in view of expected scintillations in the radio data. The CB model is seen to correctly predict the early temporal increase (to be followed by a later turn-over due to self absorption) and the spectral behaviour ( between 1.43 GHz and 86 GHz, observed around 5 days after the burst) again akin to those of other GRBs: 991208 (Galama et al. 2000), 000926 (Harrison et al. 2001) and 000301c (Berger et al. 2000). GRBs 021004 and 000301c also have very similar redshifts and fluences, dim host galaxies, bumpy light-curves and analogous “late” optical AGs (GRB 000301c was optically detected after days by Fynbo et al. 2000).
The GRB proper. In the CB model (Dar and De Rújula 2000), the rest-frame fluence of a CB viewed at a small is amplified by a huge factor, , due to the Doppler boost and relativistic beaming of the radiation (Shaviv and Dar 1995). In Dado et al. (2002a) we deduced that the GRB photons of the GRBs of known redshift correspond to a total energy release in the CBs’ rest system that is in a surprisingly narrow interval555GRBs in the CB model are much better standard candles than in the standard model (Frail et al. 2001)., erg; and that the spread in the “equivalent spherical energies” around their mean, , is mainly due to the spread of their Doppler factors (deduced from the fits to their AGs) around their mean: . For GRB 021004, and the CB-model expectation is erg, in agreement with the observed erg (we have corrected the value of Lamb et al. (2002) to a redshift , from their adopted ). The GRB of GRB 021004 is also entirely normal.
Spectral Variability: The energy dependence of the injection bend implies that the optical spectra, , typically steepen in the first few days, as the bend frequency in the observer’s frame “crosses” the optical band (Dado et al. 2002b). Let . Given the parameters of our fit to the optical AG, we can predict, by use of Eqs.(1), the spectral energy density as a function of the ISM density . The two CBs of GRB 021004 have similar and but different : their time evolution and injection bends are different. The AG is dominated before and after days by one or the other CB, whose properties determine the “early” or “late” spectral evolution. The predictions for the spectral ratio at the “late” times () measured by Matheson et al. (2002), are shown in Fig. 4. The upper panel is for , the density predicted from using the CB-model reference values (, ; Dado et al. 2000a,b). For this , Å and Å.
The interpolation between the limiting behaviours at and could be more abrupt than in Eq. (1). In the lower panel of Fig. 4 we illustrate the result for a sharp transition, for which, with cm-3, Å (below the measured range) and Å, at which point changes from to , so that the ratio shown in the figure is below 5500 Å, and unity above.
3 Conclusions
We have shown that the CB-model’s interpretation of all the data concerning GRB 021004 is quite simple and very successful. The only novelty is that, relative to other GRB AGs, the optical data start very early and are so copious that a single CB would not fare well in explaining the light-curve shapes. Two large pulses are observed in the GRB’s -ray light curve, enticing one to fit the rest of the data with two CB contributions. The results are excellent and do not require new ad-hoc assumptions about the circumburst ISM density: GRB 021004 fits well and naturally along all other GRBs of known redshift.
Having described a relatively simple AG evolution with 8 parameters, we cannot claim that they are all uncorrelated and well determined, although their use results in the impressive prediction for the spectral evolution reported in Fig. 4. We regard our results as an existence proof of a very simple CB-model understanding of the bumpy AG of GRB 021004.
It is, as usual, instructive to compare the CB-model’s results to those of the standard “fireball” scenarios. Two of the most striking differences are their degree of simplicity and predictive power; the explanation of the alleged X-ray lines in GRB afterglows is an extreme case666In the CB model the existence and time-dependent energies of the lines are predicted, requiring no custom-made metallic envelopes, nor any other ad-hoc assumption (Dado et al. 2002e).. The GRB under discussion is also in an extreme class: its standard explanations (Lazzati et al. 2002; Nakar et al. 2002; Heyl and Perna 2002) require model-dependent inversions of the observed light curves to obtain the input functions (the ISM-density or energy-supply profiles and the extinction in the host) needed to “predict” the output functions (the light curves at different frequencies). The various quoted authors extract very different input functions, thereby illustrating the limited “posdictive” power of fireballs. It would be difficult, on these grounds, to falsify any model with that much freedom.
For a non-constant ISM density, short-time spectral variations and AG features are expected in the CB model due to the local instantaneous dependence of and on the density, Eqs. (1,2). These are not expected in the standard models because signals emitted at a fixed from different portions of the fireball or firecone are observed at different times and with different Doppler boosts, erasing all effects of width . Moreover, the standard AG fluence depends on the integrated density (up to time ): an abrupt rise of fluence such as that observed in GRB 970508 requires a different explanation (the AG is “re-energized”, as in Piro et al. 1998). A similarly abrupt dip would be unexplainable.
The CB model is very modest in the adjectives that refer to GRBs. None of them is exceptional, not even the very energetic GRB 990123, nor 970508 with its peculiar AG shape, nor the extraordinarily close-by 980425. They are all associated with supernovae, seen when they are visible, not seen when they are not (Dado et al. 2002a). The explosions that generate GRBs are not “the biggest after the Big Bang”. The mechanism that begets GRBs is common: it takes place in quasars and microquasars as well. The model works very well and is very predictive, thus falsifiable.
Acknowledgment: This research was supported in part by the Helen Asher Space Research Fund and by the VPR fund for research at the Technion. Useful remarks by Stephen Holland are gratefully acknowledged.
References
- (1) Belloni, T., et al. 1997, ApJ, 479, 145
- (2) Berger, E., et al. 2000, ApJ, 545, 56
- (3) Berger, E., et al. 2002, GCN Circ. 1612
- (4) Berger, E., et al. 2002a, GCN Circ. 1612
- (5) Berger, E., et al. 2002b, GCN Circ. 1613
- (6) Bersier, D., et al. 2002, astro-ph/0211130
- (7) Bremer, M., et al. 2002c, GCN Circ. 1590
- (8) Castro-Tirado, A.J., et al. 2002, GCN Circ. 1635
- (9) Chornock, R., Filippenko, A.V., 2002, GCN Circ. 1605
- (10) Corbel, S., et al 2002, astro-ph/0210224
- (11) Covino, S., et al. 2002a, GCN Circ. 1595
- (12) Covino, S., et al. 2002b, GCN Circ. 1622
- (13) Dado S., Dar A., De Rújula A., 2002a, A&A 388, 1079
- (14) Dado S., Dar A., De Rújula A., 2002b, astro-ph/0204474
- (15) Dado S., Dar A., De Rújula A., 2002c, ApJ 572, L143
- (16) Dado S., Dar A., De Rújula A., 2002d, A&A, 393, L25
- (17) Dado S., Dar A., De Rújula A., 2002e, ApJ, in press (astro-ph/0207015)
- (18) Dar A., De Rújula A., 2000, astro-ph/0008474
- (19) Dar A., De Rújula A., 2001, astro-ph/0012227
- (20) De Rújula A., 2002a, Proc. of the GRB 2001 Conf., Woods Hole, Mass., astro-ph/0201210
- (21) De Rújula A., 2002b, Proc. of the 4th Microquasar Workshop, 2002, eds. Durouchoux, Fuchs and Rodriguez, Center for Space Physics: Kolkata, astro-ph/0207033
- (22) Fargion, D., Salis, A., 1995, Ap&SS, 231, 191
- (23) Fox, D.W., et al. 2002, GCN Circ. 1566
- (24) Frail, D.A., et al. 2001, ApJ, 562, L55
- (25) Frail, D.A., et al. 2002, GCN Circ. 1574
- (26) Fynbo, J.P.U., et al. 2000, GCN Circ. 570
- (27) Galama, T.J., et al. 1998, Nature, 395, 670
- (28) Galama, T.J., et al. 2000, ApJ, 541, L45
- (29) Garnavich, P M., Loeb, A., Stanek, K.Z., 2000, ApJ, 554, 11
- (30) Ghirlanda, G., Celotti, A., Ghisellini, G., astro-ph/0210693
- (31) Harrison. F.A., et al. 2001, ApJ, 559, 123
- (32) Henden, A., et al. 2002, GCN Circ. 1630
- (33) Heyl, J.S., Perna, R., 2002, astro-ph/0211256
- (34) Holland, S.T., et al. 2002, astro-ph/0211094
- (35) Lamb. D., et al. 2002, GCN Circ. 1600
- (36) Lazzati, D., et al. 2002, astro-ph/0210333
- (37) Marscher, A.P. 2002, Nature, 417, 625
- (38) Margon, B.A. 1984, ARA&A, 22, 507
- (39) Matheson, T., et al. 2002, astro-ph/0210403
- (40) Mirabal, N., et al. 2002a, GCN Circ. 1602
- (41) Mirabal, N., et al. 2002b, GCN Circ. 1618
- (42) Mirabel, I.F. & Rodriguez, L.F. 1994, Nature, 371, 46
- (43) Mirabel, I.F. & Rodriguez, L.F. 1999, ARA&A, 37, 409
- (44) Moller, P., et al. 2002, astro-ph/0210654
- (45) Nakar, E., Piran, T., Granot, J. 2002, astro-ph/0210631
- (46) Pandey, S.B., et al. 2002, astro-ph/0211108
- (47) Piro, L., et al. 1998, A&A, 331, L41
- (48) Pooley, G., et al. 2002a, GCN Circ. 1575
- (49) Pooley, G., et al. 2002b, GCN Circ. 1588
- (50) Pooley, G., et al. 2002c, GCN Circ. 1604
- (51) Rodriguez, L.F. & Mirabel, I.F. 1999, ApJ, 511, 398
- (52) Rol, E., et al., 2002, GCN Circ. 1596
- (53) Sako, M., et al. 2000, GCN Circ. 1624
- (54) Savaglio, S., et al. 2002, GCN Circ. 1633
- (55) Salamanca, I., et al. 2002, GCN Circ. 1611
- (56) Schaefer, B.E., et al. 2002, astro-ph/0211189
- (57) Schlegel D.J., Finkbeiner D.P., Davis M., 1998, ApJ, 500, 525
- (58) Shaviv, N., Dar, A., 1995, ApJ, 447, 863
- (59) Shirasaki, Y., et al. 2002, GCN Circ. 1564
- (60) Wang, L., et al. 2002, GCN Circ. 1672