Observing the effects of the event horizon in black holes
Abstract
The key difference between neutron stars and black holes is the presence/absence of a solid surface. Recent attempts to detect this difference have concentrated on the quiescent luminosity, but here these sources are faint and difficult to observe. Instead we look at these sources when they are bright, and show that there is a clear difference between black holes and neutron stars in the evolution of their X-ray spectra which is due to the presence of a surface in the neutron stars. We also show that there is a type of X-ray spectrum which is only seen from black holes, making it a good diagnostic for the nature of new transient sources.
keywords:
accretion, accretion discs – X-rays: binaries1 Introduction
Black holes and neutron stars have very similar gravitational potentials as neutron star radii are of the order of three Schwarzchild radii, the last stable orbit of material around a black hole. Thus the accretion flows should be similar, except that neutron stars have a solid surface, while black holes do not. This fundamental difference should give rise to some observable effects. Observations of X-ray bursts (from nuclear burning of the accreted material onto the surface), or coherent pulsations (from a magnetic field) are unique signatures of neutron stars. However, not all neutron star systems show these – they are a sufficient but not necessary condition of a surface (e.g. the review by van der Klis 1995).
Another key to the presence of a surface is that a boundary layer between the accretion flow and the surface can form. In Newtonian gravity an accretion disc can radiate only half of the gravitational potential energy. The other half is stored as kinetic energy of the rotating material, but this must be radiated at the surface in a boundary layer if the surface is stationary. In general relativity the energy in the boundary layer is even larger, about twice that of the disc (Sunyaev & Shakura 1986; Sibgatullin & Sunyaev 2000). Neutron stars can of course be rapidly rotating, but even the fastest spinning millisecond pulsar (at 640 Hz) is rotating at approximately half the Keplarian period (Backer et al. 1982), where the energy released in the boundary layer should be as much as that in the disc (Sibgatullin & Sunyaev 2000).
Attempts to look for the effects of the surface on the spectrum have concentrated on comparing black holes and neutron stars in quiescence. At low mass accretion rates the accreting material is not very dense, so can form a two temperature plasma (protons much hotter than the electrons) rather than the single temperature assumed by the standard Shakura-Sunyaev disc models. The two temperature accretion flows can cool by Compton scattering (Shapiro, Lightman & Eardley 1976), and by advection (carrying the energy along with the flow; Narayan & Yi 1995). The flow is radiatively inefficient if advective cooling dominates so the ratio of boundary layer to accretion flow luminosity should be very high. This was the motivation for the quiescent luminosity comparisons of black holes and neutron stars. While the neutron stars are somewhat more luminous than the black holes systems (Narayan, Garcia & McClintock 1997; Garcia et al. 2001), the difference is nothing like as large as predicted by the ADAF models (Menou et al. 1999). The discrepancy is probably due to the fact that convection and outflows are also important, and change the structure (but not the existence) of the hot flow (Hawley & Balbus 2002).
The boundary layer should be very obvious in the neutron star spectra at high mass accretion rates, where the sources are bright, and the only known solution of the accretion flow equations is a disc. Indeed, the neutron star spectra are generally interpreted in terms of disc and boundary layer emission, although the spectral decomposition is difficult (e.g. Mitsuda et al. 1984, 1989; White et al. 1988 but see di Salvo et al. 2000a and Done, Życki & Smith 2002). However, a unique black hole spectral signature remained elusive. Proposed spectral characteristics of black holes included the ultrasoft spectral state seen at high luminosities (White & Marshall 1984; White et al. 1984), the hard X-ray emission seen at low luminosities (e.g. Sunyaev et al. 1991), and the steep X-ray tail seen at high luminosities (e.g. Laurent & Titarchuk 1999). However, counter-examples to all these are known: Cir X-1 is a neutron star which shows an ultrasoft spectrum (e.g. Tanaka & Lewin 1995), low luminosity neutron stars show hard X-ray power law spectra (Barret & Vedrenne 1994) and high luminosity neutron stars show steep X-ray tails (e.g. di Salvo et al. 2001 and references therein).
Only subtle spectral differences between the neutron stars and black holes seemed apparent. Barret, McClintock & Grindlay (1996) were able to show that there is a difference in hard X-ray (20–200 keV) emission between the luminous neutron stars and black holes, but the relative insensitivity of high energy detectors again makes these observations difficult. By contrast, these does seem to be unique black hole/neutron star discriminants in the timing signatures (broad band power spectra: Sunyaev & Revnivtsev 2000; quasi-periodic oscillation frequencies: Belloni, Psaltis & van der Klis 2002), but the aim of this paper is to look instead at the spectrum, where the signature of the surface/boundary layer should be obvious in neutron stars but absent in black holes.
In this paper we collate a large sample of high quality data from the Rossi X-ray Timing Explorer Proportional Counter Array (RXTE/PCA) observations of black holes and low magnetic field neutron stars (atolls and Z sources), and show that the source evolution as a function of luminosity is very different depending on the nature of the compact object. We also show that there is a type of spectrum which is only seen in the black hole systems, where the thermal emission from a low temperature disc dominates, but with a steep power-law tail to higher energies. We argue that this is a unique black hole signature, a sufficient (though not necessary) condition for any new transient to be identified as a black hole.
We model the source evolution both qualitatively and quantitatively with a similar accretion flow in both black holes and neutron stars. The observed differences in colour evolution can be explained by the additional emission from a boundary layer/surface in the neutron stars, while the lack of this component in the black hole systems implies the presence of an event horizon.
2 The Data
While XMM-Newton and Chandra have opened up new windows in high resolution X-ray imaging and spectroscopy, RXTE gives an unprecedented volume of data on X-ray binary systems. To get a broad idea of the range of spectral shapes seen quantity as well as quality is important. But this also means that analysing individual spectra is very time consuming. Colour-colour and colour-intensity diagrams have long been used in neutron star X-ray binaries to get an overview of source behaviour (e.g. Hasinger & van der Klis 1989). The problem is that colours are often defined using the counts detected within a certain energy range, and so depend on both the instrument response and on the absorbing column towards the source (see e.g. Kuulkers et al. 1994). To get a measure of the true source behaviour we want to plot intrinsic colour, i.e. unabsorbed flux (as opposed to counts) ratios over a given energy band. To do this we need a physical model. Plainly, we expect emission from an accretion disc, together with a higher energy component from Comptonization. Reflection of this emission from the surface of the accretion disc can also contribute to the spectrum (see e.g. Done et al. 1992; Yoshida et al. 1993; Done, Życki & Smith 2002 for observations of reflection in black holes, neutron star atoll and Z sources, respectively). Thus we use a model consisting of a multicolour accretion disc, Comptonized emission (which is not a power-law at energies close to either the seed photon temperature or the mean electron energy), with Gaussian line and smeared edge to roughly model the reflected spectral features, and Galactic absorption.
The RXTE archival data for a given source is stored in segments, generally corresponding to between one and three orbits, and consisting of a few kiloseconds of data. For black hole candidates and atolls we extract a single PCA spectrum for each segment. Due to fast variability of Z sources, shorter than typical RXTE orbital timescales, we extract their spectra from 512 s intervals of the data. We use ftools ver. 5.2 to extract spectra and background data for PCA detectors 0, 2 and 3, top layer only, and add 1 per cent systematic error onto each energy channel. We fit these spectra to the model described above. We choose 4 energy bands, 3–4, 4–6.4, 6.4–9.7 and 9.7–16 keV, and integrate the unabsorbed model fluxes over these ranges to form intrinsic colours. We define hard colour as a ratio of fluxes in 9.7–16 and 6.4–9.7 keV bands and a soft colour as a ratio of 4–6.4 and 3–4 keV. We estimate errors on colours assuming that the relative error on the intrinsic colour is equal to an error of count rate ratio in the same energy ranges. We exclude from the analysis the data with poor statistics, where the errors on colours exceed 0.1.
This technique gives results which are, to some extent, model dependent. However, as long as a model fits the data well, the resulting colours are robust. And indeed, the model described above fits all the data with (for majority of observations ). To assess the model-dependence of the colours we have fit all the data with a simpler model consisting of a single-temperature blackbody, power-law and a Gaussian line. This model does not always give an adequate fit, however where it does () the differences in derived colours are always smaller than 0.1 and are generally smaller than the statistical errors. We have also tested a more complex model, using a reflected spectrum rather than the phenomenological line/edge description. Since this is too time consuming to fit to all the data we chose individual spectra at various points on the colour-colour diagram. The difference in derived colours between the refection fits and the phenomenological line/edge model are smaller than the statistical errors. Even taking the reflected emission away from the model, i.e. using the true continuum shape, gives colours which are different from the Gaussian/smeared edge colours. Hence the colours obtained with this method are robust, and do not depend on the detailed model used for the line and edge features.
Another possible source of inaccuracy can be the interstellar absorption, which affects measurement of the soft colour. We calculate the colours from unabsorbed model spectrum, but if the absorption used in the model is incorrect then this can shift the whole diagram along the soft colour axis. A change in absorption by cm-2 changes the calculated soft colour by 0.1. This is particularly important for highly absorbed sources. To avoid these problems we only use sources where the absorption is cm-2.
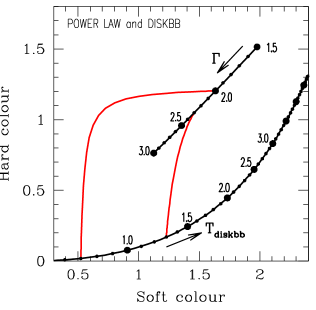
For reference we show in Fig. 1 the intrinsic colours expected from a power-law and disc blackbody spectra. These curves are overlayed in all the figures with colour-colour diagrams later in this paper.
We estimate the bolometric flux by extrapolating the unabsorbed model, and integrating over all energies. Obviously this is much more model dependent than the technique used to derive the colours. We fix a lower limit to the disc temperature of keV and an upper limit to the Comptonizing electron temperature of keV so that the continuum components cannot produce arbitrarily large luminosities peaking outside of the observed bandpass. With these constraints the total model flux can be always recovered by integrating between 0.01–1000 keV. A more restricted band of 0.1–100 keV is adequate for the soft states, but can underestimate the low/hard state luminosity by up to 40 per cent as the spectrum peaks at 100–200 keV (e.g. Gierliński et al. 1997). While this is outside the RXTE PCA bandpass, we stress that we use proper Comptonization models which roll over at energies above electron temperature. The upper limit on the electron temperature of 100 keV means that the model flux converges with increasing the upper integration limit, unlike a power law.
The total model flux, together with the distance to the source, , gives an estimate of the bolometric luminosity. Using the (fairly well constrained) mass, , we can then translate the bolometric luminosity into a fraction of the Eddington luminosity, , where M erg s-1.
3 The Sample
The aim of this paper is to look at the accretion flow as a function of in both neutron stars and black holes. To cover a large range in , and hence to include all the spectral states, we could either use a large sample of objects which vary by only a small amount, or a smaller sample of objects which vary by a large amount (or both). The key advantage of using single, variable, sources is that observed changes in spectral state must be associated with changes in the accretion flow, rather than with any other source property. Hence our main selection criteria is to use sources which vary substantially so that they cover a range in spectral states. We also require that the absorption is less than cm-2 so that the intrinsic colours are robust. This latter condition is actually quite a stringent constraint since many of the potential sources are at a large distance in the Galactic plane.
For the neutron stars, the only low-magnetic field systems (atolls) with RXTE data which have cm-2 and which sample all three branches of the island to banana pattern are Aql X-1, 4U 1608–52 and 4U 1705–44 (see Muno, Remillard & Chakrabarty 2002; Gierliński & Done 2002). We also add SAX J1808.4–3658 which varied by a factor of 10 in luminosity, but showed no strong spectral variability. Neutron stars in low-mass X-ray binaries are probably all of similar mass and spin ( M⊙ and see e.g. the review by van der Klis 2000), so their spectra should only depend on the (time averaged) .
We also include the low absorption Z sources, and the peculiar neutron star system Cir X-1 to show the range of neutron star behaviour.
For the black holes there are rather more objects which show state transitions, due to black holes being preferentially transient systems (King, Kolb & Szuszkiewicz 1997). Those which also have low absorption and are well observed are Cyg X-1, LMC X-3, GX 339–4, XTE J1550–564, XTE J1859+226 and GRO J1655–40.
Table 1 shows the systems which we used, together with the mass and distance assumed for calculating . For illustration purposes we also quote some uncertainties of mass and distance found in the literature, however we don’t use them in this paper. Obviously the Eddington limits for sources such as XTE J1550–564, GX 339–4 and Cir X-1 are poorly constrained, while those like Cyg X-1 and LMC X-3 are much more secure. The table also includes the assumed Galactic absorption.
We use all the RXTE PCA (detectors 0, 2 and 3) data of these sources which is publicly available (as for December 2002), except for Cir X-1 and GRO J1655–40. Both of these have variable absorption (e.g. Shirey, Bradt & Levine 1999; Kuulkers et al. 1998), so for these sources we select the data not affected by this from the lightcurves and spectra. For GRO J1655–40, detector 3 of the PCA was often off, so we use data from detectors 0 and 2 to follow the outburst behaviour.
| Source Name | (M⊙) | (kpc) | ( cm-2) | References |
|---|---|---|---|---|
| Cyg X-1 | 10 (4.8–14.7) | 2 (1.8-2.2) | 0.6 | 1, 2, 3 |
| GX 339–4 | 6 (2.5–10) | 4 (2.6–5) | 0.6 | 4, 5 |
| XTE J1550–564 | 10 (9.7–11.6) | 5.3 (2.8–7.6) | 0.4 | 6, 7 |
| LMC X-3 | 9 (7–14) | 52 (51.4–52.6) | 0.06 | 8, 9, 10 |
| XTE J1859+226 | 10 (5–12) | 7.6 (4.8–8) | 0.4 | 11 |
| GRO J1655–40 | 7 (6.8–7.2) | 3.2 (3–3.4) | 0.8 | 12, 13, 14 |
| 4U 1608–522 | 1.4 | 3.6 (2.2–5) | 1.5 | 15, 16, 17 |
| 4U 1705–44 | 1.4 | 7 (6.3–8.2) | 1.2 | 18, 19 |
| Aql X-1 | 1.4 | 5 (4–6.5) | 0.5 | 20, 21 |
| SAX J1808.4–3658 | 1.4 | 2.5 (2.2–3.2) | 0.1 | 22, 23 |
| Sco X-1 | 1.4 | 2.8 (2.5–3.1) | 0.15 | 24, 25 |
| GX 17+2 | 1.4 | 8 (5.6–10.4) | 2 | 26, 27 |
| Cyg X-2 | 1.4 | 11.6 (11.3–11.9) | 0.22 | 19, 28 |
| Cir X-1 | 1.4 | 10 ( 8) | 2 | 19, 29, 30 |
4 Results
4.1 Black holes
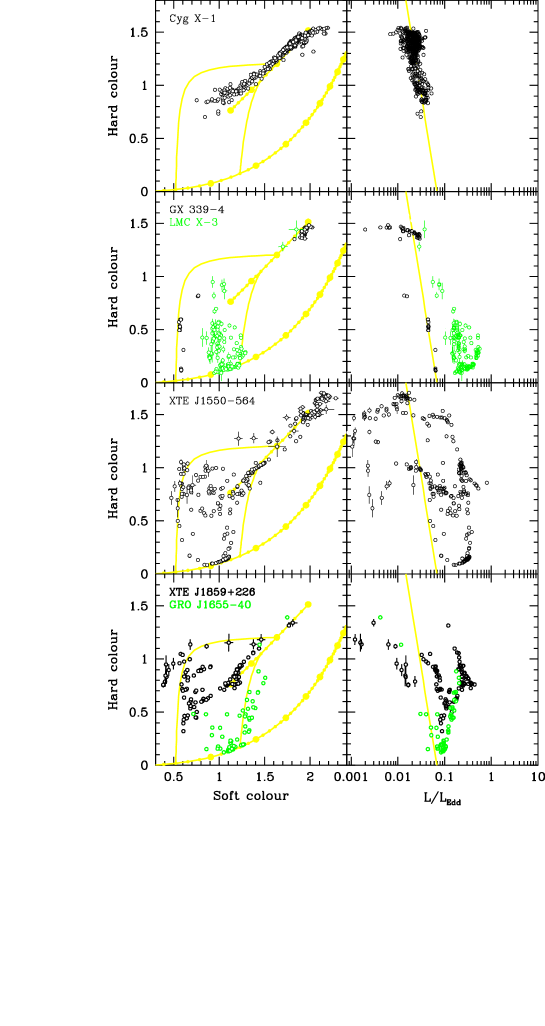
The left hand panel in Fig. 2 shows the intrinsic colours, while the right hand panel shows the hard colour versus the reconstructed . The top panels show data from Cyg X-1, where the range in luminosity is small and it traces out a well defined track in both the colour-colour and colour-luminosity plots as it switches from the low/hard to high/soft state (see e.g. the review of black hole spectral states in Tanaka & Lewin 1995; Esin, McClintock & Narayan 1997). The second panel shows GX 339–4 and LMC X-3 which together span a much larger range in colour and intensity. Their tracks look very similar to those in the third panel from the best observed black hole transient, XTE J1550–564, and to the behaviour of GRO J1655–40 and XTE J1859+226 in the lower panel. All these black holes are consistent with the same spectral evolution, in which low/hard state spectra form a well defined diagonal track in colour-colour plots, while the high/soft spectra show an amazing variety of shapes for a given .
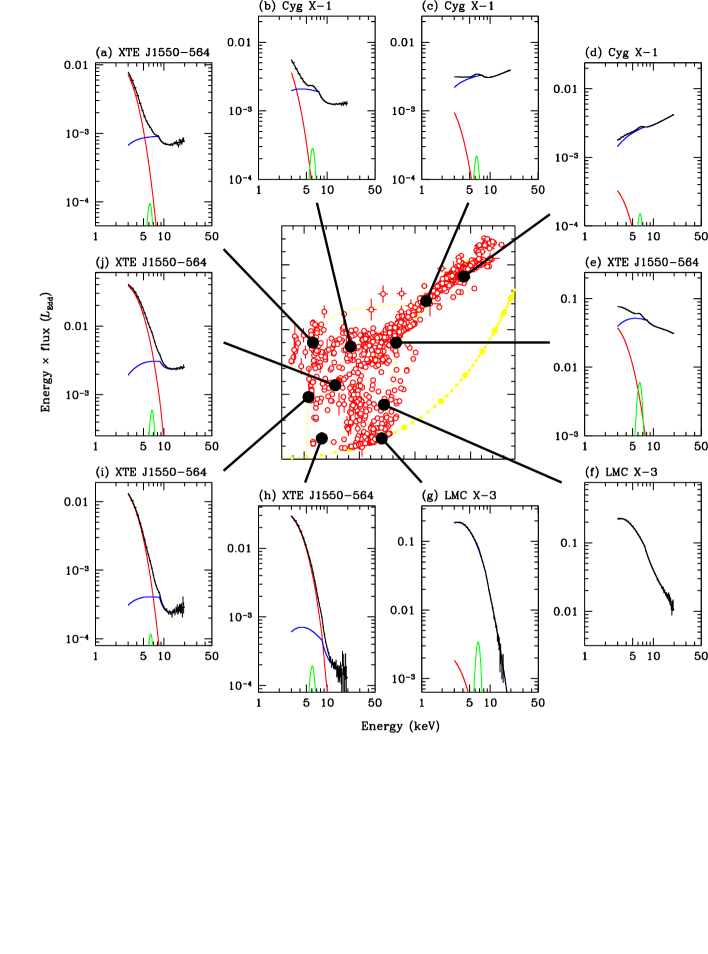
The colour-colour tracks of the simple models (power-law and disc) shown in Fig. 1 are overlaid on the data and show that the well defined diagonal track of the low/hard state spectra fall on the power-law track. The variety of high/soft state spectral colours are mostly bounded by the two composite models, and the disc blackbody track (implying a disc temperature between 0.6–1.3 keV, = 2.1–2.3 and a power-law fraction between 0 and 1). The spectral shape at a range of points on this colour-colour diagram is shown explicitly in Fig. 3. For reference, the nomenclature used in this paper is that hard power-law spectra such as and are termed low/hard state, completely disc dominated spectra ( and ) are termed ultrasoft, disc dominated spectra with some steep power law tail ( and ) are termed high/soft state, while those in which the steep power law and disc have comparable luminosities (e.g. spectrum ) are very high state.
The colour-luminosity track seen in Cyg X-1 is extrapolated and overlaid on all the other colour-luminosity plots in Fig. 2. There are clear indications that all of the sources can change from the hard to soft state along this track, although plainly the situation is more complex than a simple switch at . XTE J1550–564 can be in the hard state at , and can be in the soft state at . The accretion flow clearly does not simply depend on (Nowak 1995; Maccarone & Coppi 2002b see also van der Klis 2001 for a similar effect in the neutron star systems).
4.2 Neutron stars: Atolls and Z sources
Fig. 4 shows the same colour-colour and colour-luminosity plots for the atoll neutron star systems, while Fig. 5 shows representative spectra at different points along the colour-colour track. The intrinsic colour-colour diagrams are similar for each atoll, with the track forming a large Z with increasing (Gierliński & Done 2002a; Muno, Remillard & Chakrabarty 2002). This traces a transition from a well defined hard (island, spectra – in Fig. 5) state to a softer spectrum (banana state, spectra – in Fig. 5). The tracks shown in Fig. 1 which bounded the black hole colours are shown overlaid on the colour-colour diagrams for the atoll systems. This shows that the hard spectra seen in the atolls at low luminosities (island state, spectra –) have similar colours to those of the brightest low states seen in the black holes. This spectral similarity noted by e.g. Yoshida et al. (1993), Barret et al. (1996) and Barret et al. (2000), contrasts with the very different spectral evolution of the neutron stars and black hole systems. In the hard state the atolls move horizontally from left to right with increasing average flux, while the black holes move diagonally down and to the left. After the hard-soft transition the atolls have a well defined soft track, whereas the black holes show a variety of spectral states.
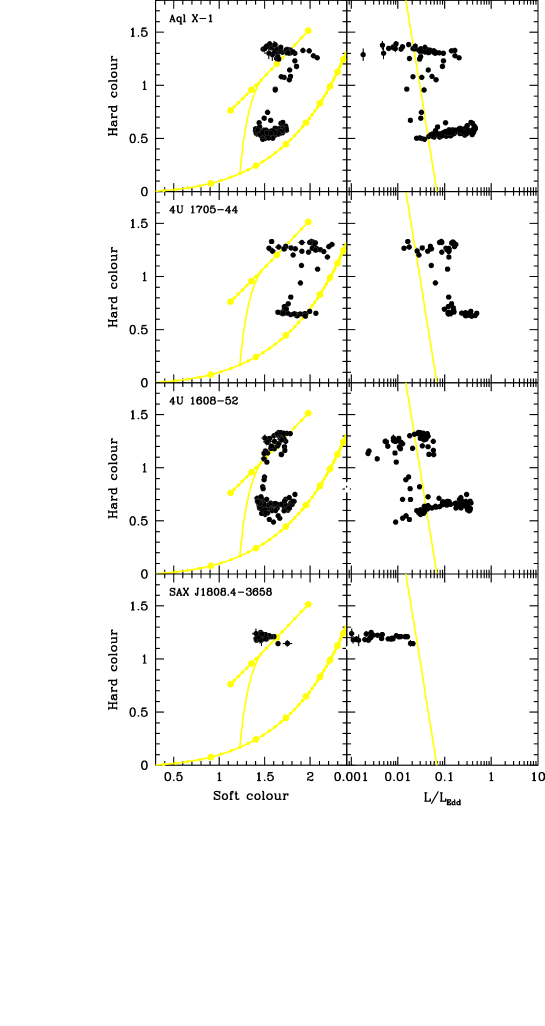
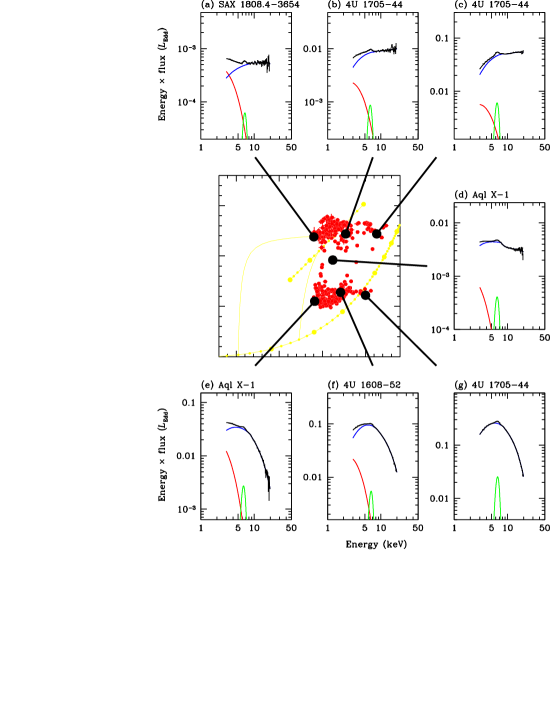
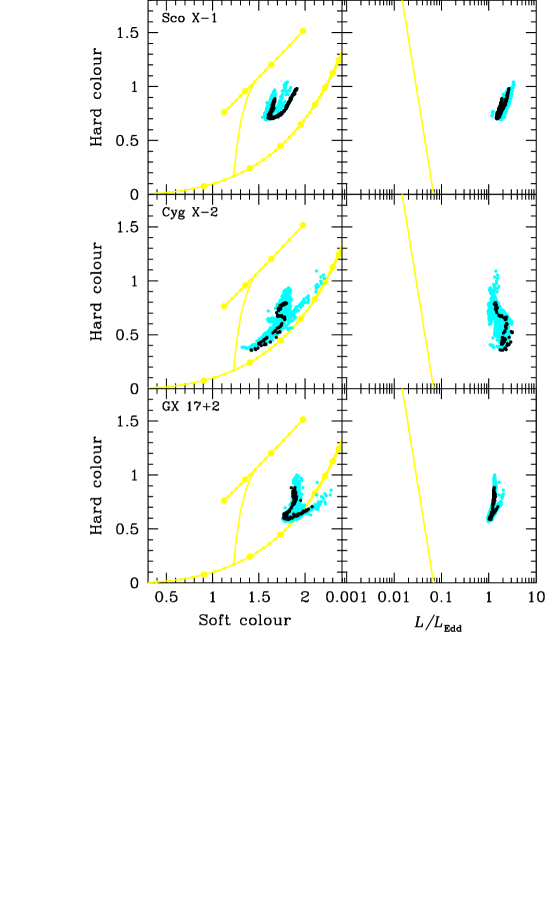
Fig. 6 shows the same information for the Z sources. By contrast to the very variable black holes and transient atolls used in this paper, the Z sources are stable to the disc instability because of their high mass transfer rate (King & Ritter 1998). Their typical luminosities are around the Eddington luminosity, and they vary only by factors of a few, rather than by several orders of magnitude as seen in the transient systems. The Z pattern is not particularly evident in any of the individual sources, due to the secular shift in the pattern over time. These shifts are poorly understood but may be due to obscuration (Kuulkers et al. 1994; Kuulkers, van der Klis & Vaughan 1996) or changes in the overall mass accretion rate (Homan et al. 2002). We plot a section of contiguous data for each Z source which shows the track more clearly.
In contrast to the black hole and atoll systems, the Z sources do not overlap with each other on the colour-colour diagram. In addition, the secular shift in the position of the track smears out the track for each source. Differences in magnetic field and/or spin period may be the most obvious way to explain this, since Sco X-1 and GX 17+2 are thought to be at similar inclinations (Kuulkers et al. 1996).
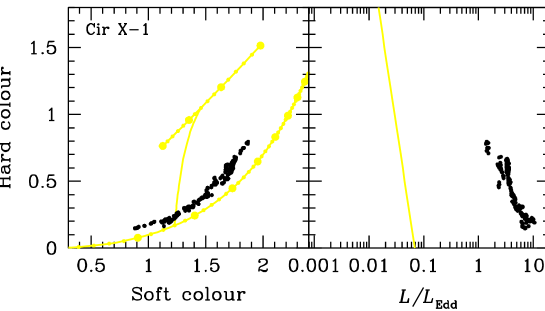
Fig 7 shows the colour-colour and colour-luminosity data for Cir X-1. This system has shown X-ray bursts so must be a neutron star (Tennant, Fabian & Shafer 1986), and is tentatively identified as a Z source (Shirey et al. 1999). There is only a lower limit to its distance ( kpc: Goss & Mebold 1977) as recent HST observations have shown that it is not associated with a nearby supernova remnant (Mignani et al. 2002). It is highly supereddington, with luminosity of = 2.5–10 for a 1.4 solar mass neutron star at 10 kpc. With these parameters its colour-colour and colour-luminosity diagrams are similar to parts of those of Cyg X-2, but extend to much higher luminosities, where it shows spectra unlike those of any other neutron star (Z or atoll). This seems to give a consistent picture, in which Cir X–1 is a Z source (i.e. a neutron star with moderate magnetic field) but is seen at generally higher luminosities than the ‘normal’ Z sources, so can have quite different spectral evolution.
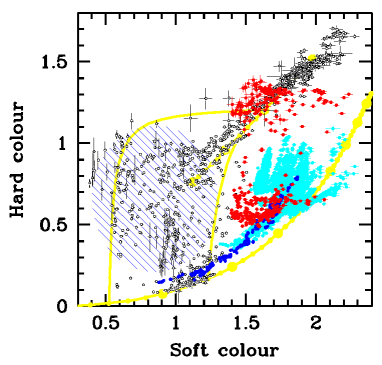
Fig. 8 shows all the data for black holes, atolls and Z sources overlaid. It is clear that the various classes of sources have regions of overlap. The high luminosity atolls (banana branch) show similar spectra to the Z sources (a similarity noted many times before e.g. van der Klis 1995). Low-luminosity black holes and atolls can both show hard colours while black holes at the highest luminosity show similar colours to atolls on the island/banana branch transition. More importantly, at highest luminosity Cir X-1 ends up at the same place on the colour-colour diagrams as the ultrasoft black hole spectra. It is clear that there are some parts of the colour-colour diagram where both neutron stars and black holes can be found.
However, no neutron star systems show any spectrum which has soft colour between 0.5–1.1 and hard colour (hatched region in Fig. 8). These types of spectra, with small soft colour from a dominant low temperature disc spectrum, and mid hard colour from the power-law tail (high/soft state) seem to be a unique black hole signature. The steep power law tail in these high/soft state spectra was previously suggested as a black hole identifier (e.g. Laurent & Titarchuk 1999), but recent observations show such components in the Z sources (see, for example, di Salvo et al. 2001 and references therein). Very soft spectra (low soft colour) were proposed as a unique black hole signature (White & Marshall 1984), but this criterium also includes the ultrasoft spectra which can be produced by the neutron star Cir X-1.
Here we propose that the high/soft state spectra are a sufficient (although not necessary) black hole signature, and that this region of the colour-colour diagram (see Fig. 8) is inaccessible to the neutron star systems simply because they have additional boundary layer emission. Even if the accretion flow around a neutron star gave rise to an identical spectrum as that around a black hole, with a low temperature disc and steep X-ray tail (though the disc would be at a marginally higher temperature due to the smaller mass of the neutron star), the neutron star should have additional emission from the boundary layer. At the high mass accretion rates above the hard-soft transition the boundary layer should be optically thick, and mostly thermalized (Popham & Sunyaev 2001). This will give an additional higher temperature component in the neutron star spectra, increasing its soft colour out of the range seen from the black hole systems.
To summarise, there are observational differences between the black holes and neutron star systems. They evolve very differently as a function of average flux on a colour-colour diagram, and black holes can occupy regions on this diagram which no neutron star can get to. The obvious interpretation is that there are physical, observable spectral differences due to the presence/absence of a solid surface.
5 Simple source evolution models
Specific models of a truncated disc/inner hot flow have been used to explain the spectra and spectral transitions in the black hole binaries (Shapiro et al. 1976; Esin et al. 1997). These models can also qualitatively explain the shape of the variability power spectrum (Churazov, Gilfanov & Revnivtsev 2001), and the correlations between the characteristic power spectral break frequencies and QPO’s (Psaltis & Norman 2000; Stella & Vietri 1998). Truncation of the disc is also required for the disc instability model for the black holes to produce long quiescent periods, rather than many mini-outbursts (Dubus, Hameury & Lasota 2001) and is compatible with all the constraints on the extent of the accretion disc as measured by direct emission (McClintock et al. 2001) and reflection (Życki, Done & Smith 1998, Gilfanov, Churazov & Revnivtsev 1999).
Here we show how a phenomenological truncated disc/inner hot flow model can explain the evolution of both black holes and neutron star binaries on the colour-colour and colour-luminosity diagram. For all types of sources we assume that the evolution of the source can be explained if the main parameter driving the spectral evolution is the average mass accretion rate, (which we define in units of Eddington accretion rate, ).
5.1 Black Hole Binaries
A qualitative picture could be as follows, starting at low . The disc truncates at rather large radii, and most of the accretion takes place in an optically thin, geometrically thick hot inner flow. There are few seed photons for Compton scattering so the X-ray spectrum is hard (Fig. 3). As increases, the truncation radius of the disc decreases, so it penetrates further into the hot flow. The disc is brighter and hotter, and the changing geometry gives a higher fraction of soft photons which are intercepted by the hot flow. This increases the Compton cooling, so the electron temperature is lower and the Comptonized spectrum steepens (Fig. 3). Both hard and soft colours decrease together as the X-ray spectrum in the PCA bandpass is still dominated by the Compton scattered power-law. When the inner flow becomes optically thick it collapses, and the inner disc replaces the hot flow (see e.g. Esin et al. 1997). The disc then is hot enough to contribute to the spectrum above 3 keV, so the soft colour decreases (Fig. 3). The hard X-ray tail is produced by the small fraction of magnetic reconnection which takes place outside of the optically thick disc (high state). At even higher the disc structure is not well understood, but there seems to be a variety of disc states, ranging from ones dominated by the disc emission (ultrasoft: Fig. 3), to ones in which there is both the disc emission and a non-thermal power-law tail extending to high energies (high/soft state: Fig. 3), and ones in which the disc emission is Comptonized by a low temperature thermal plasma as well as by the non-thermal electrons (very high state: Fig. 3).
Fig. 3 shows that the low/hard state spectra are very close to a power-law shape, and the overall change in colour in this state can be mostly described simply by increasing the power-law index with increasing . The only significant exception to this is the low/hard state spectra seen from XTE J1550–564 on its 8 day rise to outburst in 1998. The source was first observed with colour close to that of a power-law of index = 1.5, and then softens by 0.2 in hard colour with little change in soft colour, taking it below the power-law track. The colours then change together, forming a roughly parallel track to the power-law but offset by 0.2 in soft colour, until the source curves back to the power-law track at as it approaches it maximum (lower panel on Fig. 2). This anomalous behaviour can easily be modelled by including a small amount of ionized reflection. The increased reflectivity of the ionized material means it contributes to both soft and hard colour bands, whereas more neutral reflection contributes only to the hard bands. Such ionized reflection is seen in XTE J1550–564 in these rise spectra (Wilson & Done 2001), and might be expected as the disc is plainly far from steady state.
Conversely, the ultrasoft spectra are very close to the disc blackbody track, which forms the lower limit to the hard colour from the galactic black holes. Any of the rest of the soft state colours can be made with a combination of a given temperature disc blackbody spectrum and a given index of power-law. Rough ranges for the expected disc temperatures for the soft state spectra from a M⊙ Schwarzchild black hole are 0.6–1.6 keV, where the upper limit is for accretion at the Eddington limit (with colour correction of 1.8: Shimura & Takahara 1995; Merloni, Fabian & Ross 2000) while the lower limit is taken from the observation that in general the soft spectra are seen at luminosities above (although there is some spread here since the X-ray luminosity is not uniquely related to spectral shape: van der Klis 2001; Homan et al. 2001; Wijnands & Miller 2002).
5.2 Atolls
Unlike black holes, neutron stars have a solid surface so the kinetic energy at the innermost disc orbit can also be released in a boundary layer. The luminosity dissipated in the boundary layer depends on the accretion flow as well as on and the spin of the neutron star. The boundary layer should be 1–2 times as bright as the disc for a standard disc extending down to the neutron star surface (Sunyaev & Shakura 1986; Sibgatullin & Sunyaev 2000).
At low the disc is truncated a long way from the neutron star, so it emits few soft photons and very few of these are intercepted by the inner hot flow. The boundary layer is not very dense, so does not thermalize into a blackbody but instead radiates the energy through Comptonization (King & Lasota 1987; Popham & Sunyaev 2001). This hot, optically thin boundary layer emission can join smoothly onto the emission from the inner accretion flow (Medvedev & Narayan 2001). The hard X-rays from the hot plasma (accretion flow and a boundary layer combined) illuminates the neutron star surface. The reflection albedo is small at high energies due to Compton down-scattering, so even if the neutron star surface is fully ionized it cannot reflect all the illuminating flux. The energy absorbed is reprocessed, creating a small thermal component which will form the dominant source of seed photons for Compton cooling of the inner flow if the disc is far away. As increases, the disc moves inwards in the same way as for the black holes. However, the changing disc geometry has no effect on the fraction of seed photons Compton scattered by the hot inner flow if the seed photons are still predominantly from the neutron star surface. The constant seed photon/hot inner flow geometry irrespectively of means the balance of heating and cooling stays the same so the Comptonized continuum and hence the high energy spectral shape does not change.
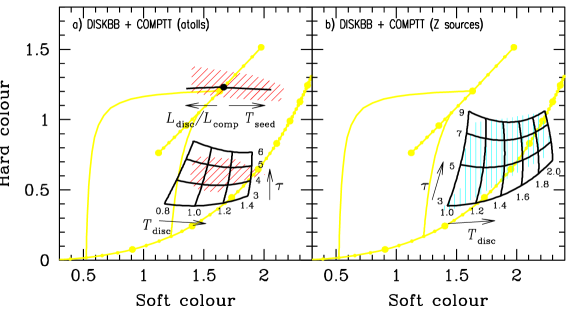
Fig. 9 shows the region of colour-colour space occupied by the atolls (diagonal shading), with a solid circle showing the colours of a power-law spectrum of = 1.95. Adding any form of soft component from the disc or neutron star surface softens the low energy spectrum (reducing the soft colour), but does not affect the hard colour, forming a horizontal track extending to the left of the power-law track. However, it is clear that this cannot explain the large patch of atoll island state spectra which are horizontally to the right of the power-law track. To match these spectra requires a hardening the low energy spectrum, while keeping the power-law of = 1.95 dominating the higher energy spectrum. From direct data fitting it is clear that these large soft colours are easily produced when proper Comptonization models are used to describe the hard X-ray component, rather than a power-law (e.g. Gierliński & Done 2002b). True Comptonization has a low energy cutoff close to the seed photon energies (see e.g. Done et al. 2002) which hardens the soft spectrum.
We show the track corresponding to a Comptonized spectrum with (modelled by comptt with and keV) from seed photons from the neutron star surface increasing in temperature from 0.3 to 0.85 keV. Plainly this matches very well with the island branch to the right of the power law track. This leads us to explain the entire upper island branch can be explained as follows. At low the disc is far away from the neutron star so cannot contribute to the PCA spectrum. The observed soft component, which pulls the colours to the left of the power-law track is from direct emission from the neutron star surface which can be seen as the optical depth of the flow is low. With increasing the flow becomes more optically thick and the seed photon temperature from the neutron star surface increases. This increasing optical depth reduces the contribution of the direct soft photons from the neutron star surface which escape unscattered, so the soft colour increases. Eventually, none of the seed photons can be seen, but the increasing seed photon temperature starts to put a low energy cutoff on the spectrum, hardening the low energy spectrum further. As the seed photon geometry remains the same throughout all this (dominated by photons from the neutron star surface rather than from the disc) then the net result is a horizontal track where the soft colour increases with source luminosity.
The atolls keep this constant hard colour until the inner flow/boundary layer reaches its maximum luminosity when it becomes optically thick. This causes the hard colour to decrease as the cooling is much more effective when the boundary layer thermalizes, so its temperature drops. Since it has more luminosity to thermalize over a smaller area, its temperature is higher than that of the disc (Popham & Sunyaev 2001). The disc replaces the inner hot flow, so the disc temperature starts to contribute to the PCA bandpass and the soft colour decreases. The track turns abruptly down and to the left during this transition. After this, increasing simply increases the disc (and boundary layer) temperature. The banana state is then analogous to the high/soft or ultrasoft state in the galactic black holes, but with additional luminosity from the boundary layer.
The disc temperature expected from a neutron star can be calculated relative to that of a black hole emitting at the same . Given the additional boundary layer luminosity, the accretion rate going through the black hole disc must be a factor = 2–3 higher than in the neutron star disc. Since the maximum disc temperature scales as and , at a given fraction of Eddington luminosity the ratio of neutron star to black hole disc temperatures should be . As , the disc temperature around the neutron star should be a factor 1.2–1.3 higher than that around the black hole, for the same . The rough limit of 0.6–1.6 keV for the black hole high state disc temperatures translates to 0.8–1.9 keV for neutron stars.
Fig. 9 shows a range of models which have a Comptonized boundary layer (modelled using comptt) with = 3–5 and = 3 keV with seed photons from a disc at = 0.8–1.4 keV, with the same luminosity as the boundary layer. This gives the same range of colours as seen on the atoll banana branch, showing it can be explained by the increasing mass accretion rate leading to higher disc and seed photon temperatures.
5.3 Z sources
The Z sources are probably similar to the high luminosity atolls, but with the addition of a magnetic field (Hasinger & van der Klis 1989). The disc evaporation efficiency decreases as a function of increasing mass accretion rate (e.g. Różańska & Czerny 2000), so this cannot truncate the disc in the Z sources. Instead the truncation is likely to be caused by stronger magnetic field, but here the increased mass accretion rate means that the inner flow/boundary layer is already optically thick, and so always thermalizes (Popham & Sunyaev 2001; Gierliński & Done 2002b).
Fig. 9 shows the region of colour-colour space occupied by the Z sources, together with the comptt banana state models from the atoll systems. Since the luminosities are always close to Eddington (at least twice as bright as the highest luminosity seen from the atolls) we expect disc temperatures to be always larger then 1.4 keV. However, a substantial fraction of the Z source colours lie to the left of the line expected for a disc temperature of 1.4 keV. Direct spectral fitting (e.g. Done et al. 2002) confirms that the disc temperature can be much lower than this, at 0.8 keV for the GINGA data from Cyg X–2. This shows that the low temperatures are not merely an artifact of our model assumptions (e.g. seed photon temperature, luminosity ratio of the boundary layer and disc, electron temperature) as the spectral fitting allowed all these to be free parameters. Much higher temperatures, comparable with those expected, are sometimes seen from Cyg X–2 (e.g. di Salvo et al. 2002), from spectra which have large soft colour, but many of the spectra from both Cyg X–2 and Sco X–1 imply lower disc temperatures which are surprisingly similar to those of the lower luminosity atolls. While a lower disc temperature might be expected for the upper branch of the Z (horizontal branch) where the disc is held away from the neutron star by the magnetic field, this is not thought to be the case for the lower (flaring) branch. One explanation for this could be that the inner disc is always slowed down from Keplarian rotation by its interaction with the magnetic field (e.g. Miller & Stone 1997), so that its temperature is reduced.
6 Spectral models for the source evolution
We have described the low/hard state source behaviour in terms of a truncated disc/inner hot flow, and shown that this can qualitatively (and to some extent quantitatively) explain the different spectral evolution of the neutron stars and black holes. However, there are alternative geometries which can explain the low/hard state 2–20 keV X-ray spectra, including an untruncated disc, with magnetic flares expanding away from the disc at relativistic speeds (Beloborodov 1999), or non-outflowing flares which strongly ionized the disc surface (Nayakshin, Kazanas & Kallman 2000) or the X-rays being produced by synchrotron emission in a jet (e.g. Markoff et al. 2003). All these alternative models have severe difficulties in explaining the observed QPO variability without a varying inner disc radius, but this could merely reflect our incomplete understanding of QPO mechanisms.
Irrespective of the envisaged geometry, there is a clear observational difference in spectral evolution between the black holes and neutron stars. While the phenomenological spectral models used in the previous section form a useful backdrop to understanding spectral states, it is plain that more sophisticated models are required to describe the spectra from the accretion flow. We use the thermal/non-thermal Comptonization model of Coppi (1999), the eqpair code, as the basis for a more geometry independent approach to modelling the emitted spectrum. This code has successfully fit black hole spectra in both high/soft (Gierliński et al. 1999), very high (Zdziarski et al. 2001; Gierliński & Done 2002c) and low/hard states (Zdziarski et al. 2002). It calculates the emission spectrum resulting from Comptonization, Coulomb collisions and pair production processes, so it can describe the spectrum formed from these radiation processes in any geometry.
The eqpair code assumes only that electrons with optical depth are accelerated by some mechanism with total power (parameterized as a compactness so where and are the luminosity and size of the region). This is split between a thermal and non-thermal distribution, with power and , respectively. These electrons can cool via Compton scattering of soft photons (with input power at temperature ), or via Coulomb collisions. The key quality of this code is that it balances these heating and cooling processes to calculate the self-consistent electron distribution and photon spectrum. Thus there is no specified temperature for the thermal part of the electron heating, because this is completely determined by the rest of the input parameters. The non-thermal electrons are injected as a power-law with index , but in general the low energy non-thermal electrons will cool and thermalize via Coulomb collisions, so even if the electron acceleration is predominantly non-thermal, Coulomb collisions can result in a predominantly thermal electron distribution which Compton scatters the seed photons. The code also includes the self-consistent pair production, so the optical depth can be increased when the intensity of high energy ( keV) photons in the source is large. However, this also leads to a strong annihilation feature which is not seen (Grove et al. 1998), giving a limit on the photon density (e.g. Gierliński et al. 1999; Zdziarski et al. 2001).
6.1 Black holes
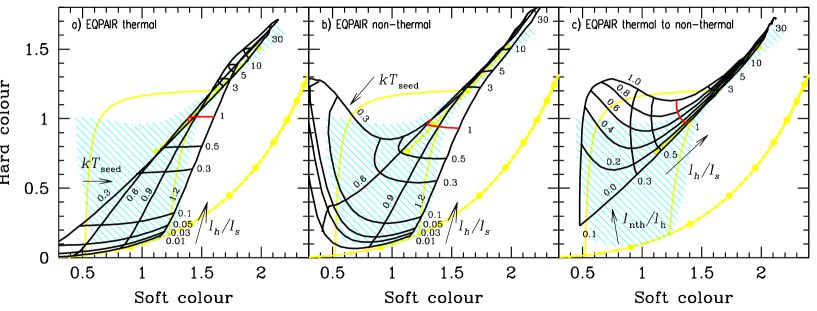
Fig. 10 shows a grid of model colours from eqpair assuming that the electron acceleration is completely thermal, for disc seed photon temperatures between 0.3–1.2 keV (none of the black holes here are at Eddington), for an optical depth of unity and . In the low/hard state the disc temperature is observed to be generally lower than keV, and the observed hard spectrum requires . Both these are naturally produced in a truncated disc model (disc is far away, so has low temperature, and few disc photons illuminate the central source), but the same resulting spectrum is produced for any geometry which has the same seed photon temperature and . There is a limit to how few seed photons can be present, which we take to be , as cyclo-synchrotron photons produced in the flow can become the dominant source of seed photons (e.g. Wardziński & Zdziarski 2000). Conversely, to produce the high/soft state spectra requires much smaller , so we show the colours for a grid of models with from 0.01 to 30.
Plainly the thermal models with temperatures below 0.6 keV and reproduce the low/hard state colours well. The self consistently derived electron temperature from eqpair is around 100 keV, so is compatible with the higher energy data as well. Changing the disc temperature below 0.6 keV makes little difference to the low/hard state colours as the spectrum is effectively a power-law. However, for the range of observed soft state colours is not well reproduced by these thermal models. Regions in the colour-colour diagram corresponding to the classic high state spectra i.e. with soft colour around 0.5 and hard colour around 1 are inaccessible with a simple thermal plasma. Comparison with the spectra shown in Fig. 3 shows that the problem is that the disc spectrum is much more dominant in the data than in our models. We assumed , so less than half of the seed photons can escape without scattering, and the scattered spectrum is always of comparable luminosity to that of the disc. The relative importance of the disc emission can be easily increased by either reducing the optical depth, or by considering a geometry in which many of the seed photons from the disc are not intercepted by the Comptonizing region (e.g. if the hot electrons are in magnetic flares which cover only a small fraction of the disc surface). However, while this would match the colours used here, detailed spectral fitting which includes data at higher energies clearly shows the presence of a non-thermal tail (e.g. Gierliński et al. 1999; Zdziarski et al. 2001; Gierliński & Done 2002c), while the thermal models with have keV. Guided by these results, Fig. 10 shows the same set of models but using a hybrid thermal/non-thermal electron distribution with = 0.5. Clearly this can reproduce the whole range of colours seen in the black hole binaries.
The ratio of non-thermal to thermal power is not necessarily constant from the hard to soft states. Fig. 10 shows a grid of models with ranging from 0 to 1 for a fixed disc temperature of 0.3 keV. Plainly the hard state is completely insensitive to the non-thermal fraction (Maccarone & Coppi 2002a). This is because the electron distribution is calculated self-consistently in the eqpair code by balancing heating (non-thermal injection) and cooling (Compton scattering and Coulomb collisions). If Coulomb collisions dominate the cooling then the electrons thermalize, irrespective of their initial injected distribution. In the low state Coulomb scattering dominates the cooling as Compton scattering is limited due to the lack of seed photons (). Conversely, in the high state, Compton scattering dominates as seed photons are plentiful, so the electron distribution can retain its non-thermal character. To describe the spectra with soft and hard colours of 0.5 and 1 (that are never observed in neutron star systems) requires a low temperature disc and a considerable fraction of power injected as non-thermal electrons.
6.2 Atolls
Fig. 11 shows the resulting colours assuming that the accretion flow in atolls is identical to that in black holes but with the addition of an optically thick boundary layer, which we model using the comptt code. This is only applicable at high mass accretion rates (as otherwise the boundary layer is optically thin), so we include only the black hole soft state spectral models. We use the hybrid plasma (Fig. 10) with seed photons temperature of 0.3–0.9 keV and between 0.1 and 1 to model the accretion flow. For the boundary layer we use thermal Comptonization in plasma with = 6 and = 2.2 keV. The seed photons for the boundary layer (assumed to origin from the neutron star surface) have temperature times that of the seed photons for the hybrid plasma (from the disc). The wide region of soft colours covered by the black hole models is transformed into a narrow strip around the atoll banana branch simply by the addition of the optically thick boundary layer.
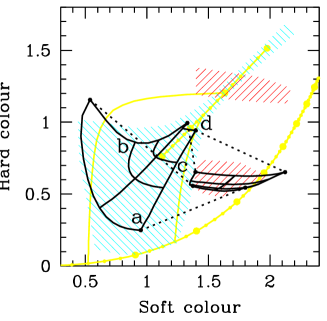
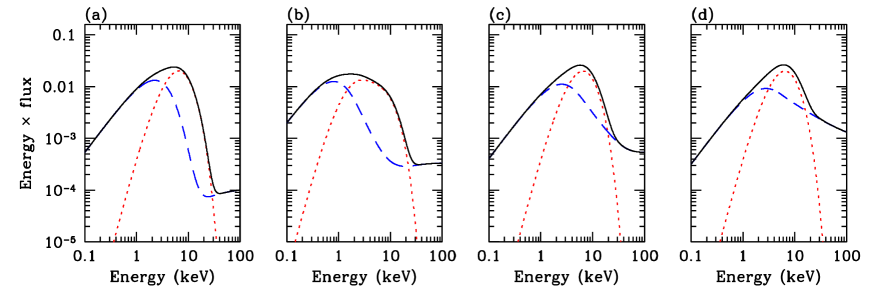
Fig. 11 shows the resulting spectra from four of these models (points , , and in Fig. 11), with the hybrid plasma from the accretion flow as the blue line and the boundary layer as a red line. Plainly these all predict that hard tails should be seen in neutron stars systems, and indeed recent BeppoSAX and RXTE data have detected tails at comparable levels to that shown in the ultrasoft, high state and moderate very high state spectra (panels , and in Fig. 12), but the extreme very high state spectra (Fig. 12) seems stronger than any yet seen in the neutron star systems (e.g. di Salvo et al. 2001 and references therein). This is plausibly due to the increased Compton cooling of the accretion flow from the boundary layer emission, giving neutron stars a lower ratio than black holes, which leads to a steeper/weaker hard tail.
7 Conclusions
The huge amount of data taken from RXTE makes it possible to study the average spectral evolution of black holes versus that from neutron stars. With intrinsic colours, data from different objects can be directly compared, showing that black hole spectra clearly evolve very differently from those of neutron stars with increasing average flux. An unknown transient system can be classified as a black hole or neutron star simply in terms of its colour evolution as a function of flux.
We show that this spectral evolution is consistent with models of the accretion flow which involve a truncated disc at low mass accretion rates, where the inner disc is replaced by an X-ray hot flow. However, irrespective of the underlying geometry, we show that we can match the evolution of the broad band spectral shape in the accreting black holes in terms of thermal/non-thermal Comptonization models for the X-ray emission, and that these same emission models can also match the very different neutron star spectral evolution. The key to their different behaviour is simply that neutron stars have a solid surface, giving an additional emission component from the boundary layer, while black holes do not.
Acknowledgements
We thank Didier Barret and Aya Kubota for useful discussions.
References
- [] Backer D. C., Kulkarni S. R., Heiles C., Davis M. M., Goss W. M., 1982, Nature, 300, 61
- [] Bałucińska-Church M.,Belloni T., Church M. J., Hasinger G., 1995, A&A, 309, L5
- [] Barret D., McClintock J. E., Grindlay J. E., 1996, ApJ, 473, 963
- [] Barret, D.; Olive, J. F.; Boirin, L.; Done, C.; Skinner, G. K.; Grindlay, J. E. 2000, ApJ, 533, 329
- [] Barret D., Vedrenne G., 1994, ApJS, 92, 505
- [] Belloni T., Psaltis D., van der Klis M., 2002, ApJ, 572, 392
- [] Beloborodov A.M. 1999, ApJ, 510, L123
- [] Bradshaw C. F., Fomalont E. B., Geldzahler B. J., 1999, ApJ, 512, L121
- [Campana et al. 2002] Campana S., Stella L., Gastaldello F., et al., 2002, ApJ, 575, L15
- [] Churazov E., Gilfanov M., Revnivtsev M., 2001, MNRAS, 321, 759
- [] Church M. J., Bałucińska-Church M., 2001, A&A, 369, 915
- [Cowley et al. 1983] Cowley A. P., Crampton D., Hutchings J. B., Remillard R., Penfold J. E., 1983, ApJ, 272, 118
- [] Cowley A. P., Schmidtke P. C., Hutchings J. B., Crampton D., 2002, AJ, 123, 1741
- [] Coppi P. S., 1999, in ASP Conf. Ser. 161, High Energy Processes in Accreting Black Holes, ed. J. Poutanen & R. Svensson (San Francisco: ASP), 375
- [] Cui W., Zhang S. N., Chen W., 1998, ApJ, 492, L53
- [] Di Benedetto G. P. 1997, ApJ, 486, 60
- [] Di Salvo T., Iaria R., Burderi L., Robba N. R., 2000a, ApJ, 542, 1034
- [Di Salvo et al. 2000] Di Salvo T., Stella L., Robba N. R., et al., 2000b, ApJ, 544, L119
- [] Di Salvo T., Robba N. R.,Iaria R., Stella L., Burderi L., Israel G. L., 2001, 554, 49
- [] Di Salvo T., et al., 2002, A&A, 386, 535
- [1] Done C., Mulchaey J.S., Mushotzky R.F., Arnaud K.A., 1992, ApJ, 395, 275
- [Done et al. 2002] Done C., Życki P. T., Smith D. A., 2002, MNRAS, 331, 453
- [] Dubus G., Hameury J.-M., Lasota J.-P., 2001, A& A, 373, 251
- [] Esin A.A., McClintock J.E., Narayan R. 1997, ApJ, 489, 865
- [] Garcia M. R., McClintock J. E., Narayan R., Callanan P., Barret D., Murray S. S., 2001, ApJ, 553, L47
- [] Gierliński M., Maciołek-Niedźwiecki A., Ebisawa K., 2001, MNRAS, 325, 1253
- [] Gierliński M., Done C., 2002a, MNRAS, 331, L47
- [] Gierliński M., Done C., 2002b, MNRAS, 337, 1373
- [] Gierliński M., Done C., 2002c, MNRAS, submitted (astro-ph/0212384)
- [] Gierliński M., Zdziarski A. A., Poutanen J., Coppi P. S., Ebisawa K., Johnson W. M., 1999, MNRAS, 309, 496
- [] Gierliński M., Maciołek-Niedźwiecki A., Ebisawa K., 2001, MNRAS, 325, 1253
- [] Gilfanov M., Churazov E., Revnivtsev M., 1999, A& A, 352, 182
- [] Goss W. M., Mebold U., 1977, MNRAS, 181, 255
- [Grove et al. 1998] Grove J. E., Johnson W. N., Kroeger R. A., McNaron-Brown K., Skibo J. G., Phlips B. F., 1998, ApJ, 500, 899
- [] Haardt F., et al. 2001, 2001, ApJS., 133, 187
- [] Haberl F., Titarchuk L., 1994, A&A, 299, 414
- [] Hasinger G., van der Klis M., 1989, A&A, 225, 79
- [] Hawley J. F., Balbus S. A., 2002, ApJ, 573, 738
- [] Herrero A., Kudritzki R. P., Gabler R., Vilchez J. M., Gabler A., 1995, A&A, 309, 556
- [] Hjellming R. M., Rupen M. P., 1995, Nat, 375, 464
- [] Homan J., Wijnands R., van der Klis M., Belloni T., van Paradijs J., Klein-Wolt M., Fender R., Méndez M., 2001, ApJS, 132, 377
- [] Homan J., van der Klis M., Jonker P. G., Wijnands R., Kuulkers E., Méndez M., Lewin W. H. G., 2002, ApJ, 568, 878
- [] Hynes R. I., Haswell C. A., Chaty S., Shrader C. R., Cui W., 2002, MNRAS, 331, 169
- [] in ’t Zand J. J. M., et al. 2001, astro-ph/0104285
- [] King A. R., Lasota J.–P., 1987, A&A, 185, 155
- [] King A.R., Ritter H., 1998, MNRAS, 293, L42
- [] King A. R., Kolb U., Szuszkiewicz E., 1997, ApJ, 488, 89
- [] Kuulkers E., van der Klis M., Oosterbroek T., Asai K., Dotani T., van Paradijs J., Lewin W. H. G., 1994, A&A, 289, 795
- [] Kuulkers E., van der Klis M., Vaughan B. A., 1996, A&A, 311, 197
- [] Kuulkers E., Wijnands R., Belloni T., Mendez M., van der Klis M., van Paradijs J., 1998, ApJ, 494, 753
- [] Kuulkers E., Homan J., van der Klis M., Lewin W. H. G., Méndez M., 2002, A&A, 382, 947
- [] Laurent P., Titarchuk L., 1999, ApJ, 511, 289
- [] Maccarone T. J., Coppi P., 2002a, MNRAS, submitted (astro-ph/0204235)
- [] Maccarone T. J., Coppi P., 2002b, MNRAS, submitted (astro-ph/0209116)
- [] Markoff S., Nowak M., Corbel S., Fender R., & Falcke H. 2003, A&A, 397, 645
- [] McClintock J.E., et al., 2001, ApJ., 555, 477
- [] Medvedev M. V., Narayan R., 2001, ApJ, 554, 1255
- [] Menou K., Esin A. A., Narayan R., Garcia M. R., Lasota J.-P., McClintock J. E., 1999, ApJ, 520, 276
- [] Merloni A., Fabian A. C., Ross R. R., 2000, MNRAS, 313, 193
- [] Mignani R. P., De Luca A., Caraveo P. A., Mirabel I. F., 2002, A&A, 386, 487
- [] Miller K.A., Stone J.M., 1997, ApJ, 489, 890
- [] Mitsuda K., et al. 1984, PASJ, 36, 741
- [] Mitsuda K., Inoue H., Nakamura N., Tanaka Y., 1989, PASJ, 41, 97
- [Muno et al. 2002] Muno M. P., Remillard R. A., Chakrabarty D., 2002, ApJ, 568, L35
- [] Nakamura N., Dotani T., Inoue H., Mitsuda K., Tanaka Y., Matsuoka M.,1989, PASJ, 41, 617
- [] Narayan R., Yi I., 1995, ApJ., 452, 710
- [] Narayan R., Garcia M. R., McClintock J. E., 1997, ApJ, 478, 79
- [] Nayakshin S., Kazanas D., Kallman T.R., 2000, ApJ., 537, 833
- [] Nowak M.A., 1995, PASP, 107, 1207
- [] Nowak M. A., 2000, MNRAS, 318, 361
- [] Orosz, J. A. Bailyn, C. D., 1997, ApJ, 477, 876
- [] Orosz J. A., Kuulkers E., 1999, MNRAS, 305, 132
- [] Orosz J. A., et al., 2002, ApJ, 568, 845
- [] Paerels F., Kahn S. M., Wolkovitch D. N., 1998, ApJ., 496, 473
- [] Penninx W., Damen E., Tan J., Lewin W. H. G., van Paradijs J., 1989, A&A, 208, 146
- [] Popham R., Sunyaev R., 2001, ApJ, 547, 355
- [] Predehl P., Schmitt J. H. M. M., 1995, A&A, 293, 889
- [] Psaltis D., Norman C., 2000, astro-ph/0001391
- [] Różańska A., Czerny B., 2000, MNRAS, 316, 473
- [] Rutledge R. E., Bildsten L., Brown E. F., Pavlov G. G., Zavlin V. E., 2001, ApJ, 559, 1054
- [] Sibgatullin N. R., Sunyaev R. A., 2000, AstL, 26, 699
- [] Shapiro S.L., Lightman A.P., Eardley D.M. 1976, ApJ, 204, 187
- [] Shimura T., Takahara F., 1995, ApJ, 445, 780
- [] Shirey R. E., Bradt H. V., Levine A. M., 1999, ApJ, 517, 472
- [] Stella L., Vietri M., 1998, ApJ, 492, L59
- [] Sunyaev R. A., Shakura N. I., 1986, SvAL, 12, 117
- [] Sunyaev R. A. et al., 1991, SvAL,17, 409
- [] Sunyaev R. A., Revnivtsev M., 2000, A&A, 358, 617
- [] Tanaka Y., Lewin W. H. G. 1995, in X–Ray Binaries, ed. W. H. G. Lewin, J. van Paradijs & E. van den Heuvel (Cambridge: Cambridge Univ. Press), 126
- [] Tennant A. F., Fabian A. C., Shafer R. A., 1986, MNRAS, 221, L27
- [] van der Klis M., 1995, in Lewin W. H. G., van Paradijs J., van den Heuvel E. P. J., eds., X-ray Binaries, Cambridge University Press, Cambridge, P. 252
- [] van der Klis M., 2000, ARAA, 38, 717
- [] van der Klis M., 2001, ApJ, 561, 943
- [] Wachter S., Hoard D. W., Baylin C. D., Corbel S., Kaaret P., 2002, ApJ., 568, 901
- [] Wardziński G., Zdziarski A. A., 2000, MNRAS, 314, 183
- [] Wijnands R., van der Klis M., 1999, ApJ, 514, 939
- [] Wijnands R., Miller J. M., 2002, ApJ, 564, 974
- [] Wilson C. D., Done C., 2001, MNRAS, 325, 167
- [] White N. E., Stella L., Parmar A. N., 1988, ApJ, 324, 363
- [] White N. E., Marshall F. E., 1984, ApJ, 281, 354
- [] White N. E., Parmar A. N., Sztajno M., Zimmermann H. U., Mason K. O., Khan S. M., 1984, ApJ, 283, L9
- [] Yoshida K., Mitsuda K., Ebisawa K., Ueda Y., Fujimoto R., Taqoob T., Done C., 1993, PASJ, 45, 605
- [] Zdziarski A. A., Poutanen J., Mikolajewska J., Gierliński M., Ebisawa K., Johnson W. N., 1998, MNRAS, 301, 435
- [] Zdziarski A. A., Grove J. E., Poutanen J., Rao A. R., Vadawale S. V., 2001, ApJ, 554, L45
- [] Zdziarski A. A., Poutanen J., Paciesas W. S., Wen L., 2002, ApJ, 578, 357
- [] Zhang S. N., Cui W., Chen W., 1997, ApJ, 482, L155
- [] Życki P.T., Done C., Smith D.A., 1998, ApJ, 496, L25