BeppoSAX observation of the composite remnant G327.1–1.1
We report an X-ray study of the composite supernova remnant G327.1–1.1, with particular emphasis on its thermal emission. By virtue of a combined spatial and spectral analysis, we have been able to model the X-ray emission of the remnant as a sum of two components: a non-thermal component, due to the pulsar nebula and the pulsar itself, and a thermal component, of which we have analysed spectrum and morphology, after proper subtraction of the plerion. We discuss three possible interpretations of the thermal emission of G327.1–1.1: pure Sedov expansion, expansion through a inhomogeneous medium with evaporation from ISM clouds, and radiative expansion. On the light of our new data and interpretation, we have re-derived all the physical parameters of this SNR. In the framework of Sedov or radiative expansion we derive a longer age than previously estimated (), thus not requiring a high velocity for the pulsar.
Key Words.:
Acceleration of particles; Radiation mechanisms: non-thermal; ISM: clouds; ISM: individual object: G327.1–1.1; ISM: supernova remnantsF. Bocchino (bocchino@astropa.unipa.it)
1 Introduction
The class of supernova remnants (SNRs) contains a wide variety of objects, that cannot be accounted for by the traditional subdivision in just two categories, namely shell-like remnants (powered by a blast wave expanding in the ambient medium) and filled-center (or Crab-like, or plerionic) remnants (powered by a spinning-down pulsar). The class of composite SNRs has in fact been introduced (Helfand & Becker 1987) in order to arrange a number of objects that neither could be classified as pure shell-like nor as pure filled-center remnants. This classification was originally only morphological, by requiring just the coexistence of a shell and of a center-filled component: the underlying belief was that the inner component always has a plerionic nature. Such scenario, originally devised for objects in which both components are detected in radio, seemed to apply also to those appearing as pure shells in radio, but with a centrally peaked emission in X rays. A natural explanation was that in these SNRs the central X-ray component is due to synchrotron emission of plerionic nature, which happens to be too weak in radio.
From the analysis of the X-ray spectra however it became clear that for a large fraction of composite SNRs (the so-called “mixed-morphology” remnants) the emission from the central component is thermal. Along this line (White & Long 1991, hereafter WL) presented a model showing that a centrally peaked (thermal) X-ray emission characterizes SNRs in which the blast wave is expanding in a cloudy interstellar medium and induces a delayed evaporation of the clouds. This model has been applied to several SNRs, although its validity is still under debate. For instance Rho et al. (1994) found that the radial profiles of SNR W44 are nicely fitted by a WL model; but Harrus et al. (1997) then showed that this model fails in dating the SNR, and suggested an alternative scenario based on the idea that the shock has reached the radiative phase. A more detailed radiative model for W44 has been recently presented (Cox et al. 1999; Shelton et al. 1999), which includes thermal conduction and a density gradient in the ambient medium. An alternative suggestion (Petruk 2001) is that even a shell-type SNR which expands in a strong density gradient may mimic a center-filled morphology, if seen with a peculiar orientation. Further investigation is still required to clarify which scenario is most appropriate to describe the majority of thermal X-ray SNRs with a center-filled morphology.
On the observational side, the diagnostics and even the recognition of mixed-morphology SNRs are not easy tasks. The determination of the nature (thermal or non-thermal) of the central X-ray component on the basis of its X-ray spectrum is in principle straightforward. However a thermal and a non-thermal component may coexist in the same remnant, in which case both a high spatial resolution and a broad-spectrum sensitivity are required in order to study them separately. The coexistence, in composite SNRs, of more components typically implies a dynamical interaction between them, a study of which may provide important clues on the physical conditions. For instance, an X-ray spectral determination of the pressure in the shell component, together with the requirement of a pressure balance between the thermal remnant and the plerion, allows an estimate of the plerionic magnetic field.
Although there are various composite SNRs that in X rays show both a shell-like and a plerionic component, up to now only in one case (W44) a plerionic component is clearly seen coexisting with a centrally peaked thermal X-ray component. In this paper we suggest that also SNR G327.1–1.1 may present such coexistence, and be in various respects similar to W44.
G327.1–1.1 is a composite SNR with a rather complex structure. Details of its morphology have been revealed only recently at radio wavelengths, by the 843 MHz MOST SNR survey (Whiteoak & Green 1996). In particular its plerionic component is substantially offset with respect to the centroid of an otherwise rather symmetric remnant. A recent Chandra observation has in fact confirmed the presence of a compact source (P.O. Slane, private communication) on the tip of a finger-like feature extending from the radio plerion to the north-west direction, which also coincides with a hard X-ray source (Sun et al. 1999, hereafter SWC). On the other hand, the thermal component of G327.1–1.1 has not been mapped in detail, and its origin is still uncertain. SWC interpreted it as a thermal shell, and applied the Sedov solution to derive the shell parameters. However, the presence of the strong non-thermal nebula prevented them from showing the putative limb-brightened X-ray morphology of the thermal emission. In this work, we attempt to derive the spatial morphology of the thermal component.
The plan of the paper is the following: in Sect. 2 the observation is described; Sect. 3 presents results from a joined spectral and spatial analysis of the data; Sect. 4 is devoted to a discussion on the nature of G327.1–1.1; Sect. 5 concludes.
2 Observations
The BeppoSAX imaging instruments are the Medium-Energy Concentrator Spectrometer (MECS; 1.8–10 keV; Boella et al. 1997) and the Low-Energy Concentrator Spectrometer (LECS; 0.1–10 keV; Parmar et al. 1997). The MECS consists of two grazing incidence telescopes with imaging gas scintillation proportional counters in their focal planes. The LECS uses an identical concentrator system as the MECS, but utilizes an ultra-thin entrance window and a driftless configuration to extend the low-energy response to 0.1 keV. The fields of view (FOV) of the LECS and MECS are circular with diameters of 37′ and 56′, respectively. In the overlapping energy range, the space resolution of both instruments is similar and corresponds to 90% encircled energy within a radius of 25 at 1.5 keV. In addition, the BeppoSAX payload includes two high energy instruments - the High Pressure Gas Scintillation Proportional Counter (HPGSPC; 5–120 keV; Manzo et al. 1997) and the Phoswich Detection System (PDS; 15–300 keV; Frontera et al. 1997).
The region of sky containing G327.1–1.1 was observed between 1999 March 14 and March 16. The pointing direction was R.A.=, Dec.= (J2000). In order to avoid solar scattered emission and other contaminating effects, data were limited to intervals when the elevation angle above the Earth’s limb was and when the instrument configurations were nominal. The screened exposures in the LECS and MECS are 31.0 ks and 82.5 ks, respectively. The LECS and MECS images are shown in Fig. 1. G327.1–1.1 is located, in both images, near the field center, as a resolved peak centered near R.A.=, Dec.=. (J2000).
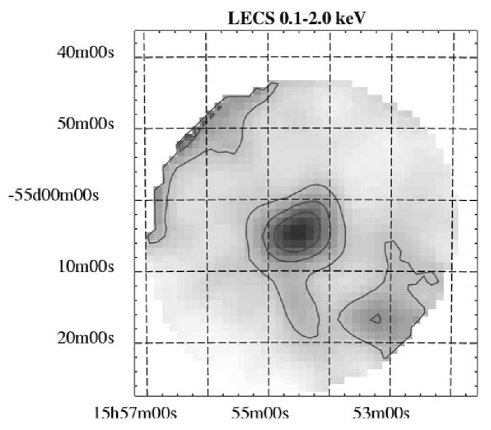
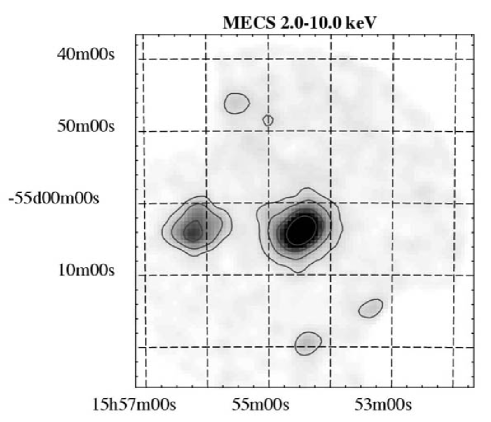
An unresolved peak not related to G327.1–1.1, located at position R.A.=, Dec.=, with a hard power-law spectrum, is also present in MECS2 data. However it neither appears in LECS nor in MECS3 data, nor it is present in existing catalogs (e.g. RASS). Since the spectral response of MECS2 and MECS3 are similar, if this source were real the only way to miss it in MECS3 data would be to have it right behind a rib of the strongback: however only soft sources can be hidden completely in this way; while ribs are transparent above 5 keV. Of course it cannot be an effect of source variability, because the integrations of the two MECS are virtually contemporaneous. Moreover in a nearby archival BeppoSAX observation (Target: HD141926, Obs.Code: 20309004), this source again appears in MECS2, while it does not in MECS3. The conclusion we have reached is that the peak seen in MECS2 is a ghost image. It cannot be due to problems in the electronics, because it is also visible in the archival MECS2 image, while tests on dark and bright earth exposure close in time to our observation do not reveal anything abnormal. The peak is presumably produced by a bright source located off-axis (but that has not been identified), and therefore we have simply not considered it in the further analysis. Anyway it does not seem to affect the data in the direction of G327.1–1.1. We thank F. Fiore and G. Cusumano, of the BeppoSAX team, for their valuable advice during the analysis of the nature of this source.
3 Results
3.1 Spectral analysis
The thermal and non-thermal components of G327.1–1.1 are only partially resolved by BeppoSAX, and therefore an accurate analysis is required to separate them. This analysis should take advantage of the differences in the spectra of the (soft) thermal and (hard) non-thermal components, as well as of the differences in their position and size.
We have performed spectral fits using different spatial and spectral selections of the available photons, and combined the results. In all cases we exclude photons with energies which are outside the ranges 0.1–8 keV for LECS and 1.6–10.5 keV for MECS. Fittings have used, separately or in combination, the following two emission components: a non-thermal component, modelled as a power law with photon index , and a thermal one, modelled as due to ionized plasma hit by the shock wave (mekal model in XSPEC V11.0). Reference abundances are from Anders & Grevesse 1989, while the interstellar absorption has been modelled using the Morrison & McCammon (1983) cross-sections. The background was taken in a sector located to NE of G327.1–1.1, with radial distances ranging from 10′ to 20′(an area reasonably free from point-like sources), and then corrected for vignetting and extraction areas.
We have first extracted a spectrum from a circular region with radius, centered on the X-ray peak position (hereafter referred to as the “plerion” region), with the aim of minimizing the contribution of the thermal component. For the spectral fitting we have generated an “ad-hoc” response file which takes into account the source extension, that has been estimated in the following way. In the 2–10 keV MECS band the apparent size of the source, as derived with a gaussian fit, is (FWHM), while that of the MECS Point spread Function (PSF, obtained by a similar fit to the archive observation of Cyg X-1) in the same energy range is : therefore the intrinsic size of the source can be estimated as ′ (FWHM), with an uncertainty 0.3′.
We have performed different fits (labelled as Fit A, B and C) to the spectrum of the plerion region, whose results are reported in Table 1. A pure power-law model using the LECS+MECS data (Fit A) provides a good overall fit of the spectra in terms of test, but tends to underestimate the flux below 1 keV. The addition of a thermal component is needed in order to have the spectra well fitted over the whole LECS+MECS bandwidth (Fit B). It is worth noting that both the value of the absorption and that of the power-law index are significantly different from the values obtained with the pure power-law model. The results of Fit B are confirmed by a pure power-law fit which uses only the 2–10 keV data of both instruments (Fit C), where the contribution of the thermal component is minor. Therefore we have decided to take the parameters of Fit B as our best guess for the plerion.
We have then performed a set of fits using a larger extraction region (Fit D and E), that is for MECS and for LECS. The aim of this selection is to include as much as possible the contribution of the thermal component. The response has been generated consistently, assuming a putative size for the shell, estimated using the corrected LECS image in the 0.1–1 keV band (Fig. 4–top) and applying the same procedure as that described for the plerionic component: The measured, PSF and deconvolved size are respectively , and FWHM. The results of these fits are also reported in Table 1. Again the two-component fit (Fit E) is statistically to be preferred to the pure power-law one (Fit D): the decrease between the two is significant at the 99.9% confidence level. The two-component fit of this spectrum is shown in Fig. 2, while the contour levels for the determination of the temperature and interstellar absorption are reported in Fig. 3. The contribution of the thermal component to the observed spectrum is low. We have estimated that the thermal contribution to the total absorbed 0.5–10 keV flux is %, and decreases to 0.4% in the 2–10 keV band.
When compared with previous X-ray spectral analyses, we find a lower value for the temperature and a higher value of : Seward et al. (1996) in fact derived and , while SWC gave and . When the quoted uncertainties are taken into account, our results are still marginally consistent with those of Seward et al. (1996) and SWC. The discrepancy should be ascribed to differences in the instrumental response of LECS (used here) and ROSAT PSPC (used both by SWC and by Seward et al. (1996) for the soft band).
| Name | 0.5–10 keV flux111Unabsorbed non-thermal flux in the 0.5–10 keV band. For Fit A, C, D it refers to the non-thermal component; while for Fit B and E we have reported the flux of the thermal component only. | kT | |||
|---|---|---|---|---|---|
| cm-2 | erg cm-2 s-1 | keV | |||
| Fit A - Ple 3′ | - | 139/160 | |||
| Fit B - Ple 3′ | 131/158 | ||||
| Fit C - Ple 3′ 2–10 keV | - | 118/141 | |||
| Fit D - G327 6′ | - | 235/232 | |||
| Fit E - G327 6′ | 223/230 |


3.2 The image of the thermal component
In order to further disentangle the image of the thermal component from the total image, in a low-energy image we have subtracted the plerionic component, by using the following approach. First, we have extracted the MECS image in the 2–10 keV energy band, in which the contribution of the thermal component is far below the one of the plerion. Then we have convolved that image in order to simulate the effect of the LECS PSF at keV (we have found appropriate a convolution with a gaussian of 5′ FWHM). Using the plerion best-fit model (Fit B) reported in Table 1, we have scaled its image in order to reproduce the LECS image of the plerion only at 0.1–1 keV. Finally, we have subtracted it from the original LECS image of G327.1–1.1 in the 0.1–1 keV band. The result is shown in Fig. 4.
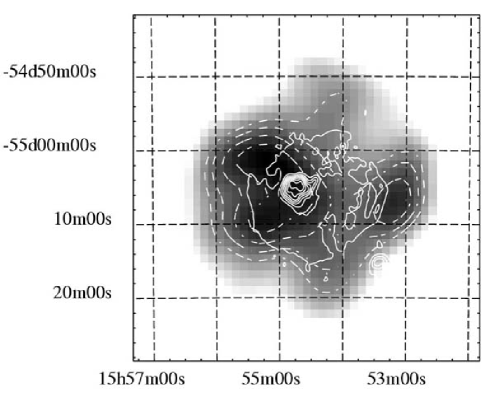
The image is composed of a large diffuse component located in the eastern part of the radio shell and a small X-ray blob located near the western rim. The center of the large diffuse component is located at R.A.=, Dec.=, and it is displaced by from the radio SNR center and by from the plerion center. The observed size of this component is FWHM. An interesting point is that the image of the thermal component does not show a complete shell structure. It could be interpreted as partial shell SNR, with a possible extension of the X-ray emission in the inner region. The absence of a limb can be inferred also from a PSPC image of the whole X-ray SNR, as obtained by Seward et al. (1996).
3.3 Timing analysis
We have searched for pulsation in the events collected in the region of the plerion defined above. We have found no pulsation at the 99% confidence limit, with an upper limit at the same level of confidence of 19.4% in the 0.1–256 Hz frequency range.
4 Discussion
4.1 The thermal component
SWC have discussed a scenario in which the shell component of G327.1–1.1 is expanding adiabatically in a homogeneous medium, and have thoroughly used for it the well known Sedov (1959) analytic solution. In this way SWC obtained a self-consistent scenario according to which the remnant is yr old and expands adiabatically in an ambient medium with a density of .
The two substantially new facts with respect to the starting point of their analysis are that the X-ray structure cannot now be interpreted as a complete shell, and that the effective temperature turned out to be lower than previously determined. Moreover, with respect to SWC we use a slightly higher estimate of the average diameter of the SNR, namely 175, as derived from the size of the radio shell (Whiteoak & Green 1996).
Let us first re-evaluate some parameters of G327.1–1.1 assuming a Sedov (1959) scenario. In this way we derive how the difference from SWC in the starting point is going to affect the result. The basic relations for the effective temperature (), the age of the SNR (), the emission measure parameter (EM) defined as , the radius of the shock () and the total swept mass () are respectively:
| (1) | |||||
| (2) | |||||
| EM | (3) | ||||
| (4) | |||||
| (5) |
where is the supernova energy, is the atomic number density in the ambient medium (with standard abundances; ), indicates the SNR distance, and are respectively the shock velocity and the post-shock temperature: the shock has been modelled assuming it to be a strong non-radiative shock with temperature equilibration between ions and electrons.
Using the information on G327.1–1.1 angular size, the above relations translate into the following ones:
| (6) | |||||
| (7) | |||||
| (8) | |||||
| (9) | |||||
| (10) | |||||
| (11) |
which directly link physical and observable quantities. In these equations is the effective temperature, in keV; is the emission measure parameter, in units of ; is the G327.1–1.1 distance, in units of 10 kpc; and is the supernova energy, when assumed, in units of . The quantity indicates the SNR angular size, in units of the G327.1–1.1 one. The physical quantities as derived from our spectral fit in Sedov approximation are listed in the first column of Table 2. It is apparent that, while the swept mass is much larger than any reasonable stellar mass, the SNR shock is slow, so that the resulting supernova energy is rather normal for any reasonable distance value.
| Sedov model | WL model | |
|---|---|---|
| () | ||
| 222For the Sedov model | ||
In other terms, assuming the standard value of for the supernova energy, we derive a distance between 4.8 and 16.2 kpc, which is in agreement with published distance estimates, ranging from 6.5 kpc (Seward et al. 1996) to 9 kpc (SWC), as well with the distance estimated from the - empirical relation (Case & Bhattacharya 1998). The average 1 GHz surface brightness of the G327.1–1.1 shell component is (5.6 Jy at 843 GHz, with a spectral index ; SWC): this translates into a shell diameter of , and then into a distance estimate of kpc.
To summarize the results of our Sedov fit compared to those of SWC (using the same assumed distance of 9 kpc), we find a SNR 2.4 times older and with 4.7 times more energy, expanding in a medium 3.9 times denser. The swept mass is 12.5 times larger than that derived by SWC.
The last row in Table 2 gives the efficiency in radiative cooling, defined as the ratio between the SNR age and the present cooling time right behind the shock, which can be expressed in terms of the observed quantities as:
| (12) |
where for the cooling coefficient we have used the formula , with in units of (McCray 1987). A value for much smaller than unity is required in order to test the adiabaticity condition, as required by the Sedov model. However Fig. 5 shows that, since is strongly decreasing with , fits giving low values for also imply relevant radiative losses.

The possible extension of the thermal X-ray component to the inner shell regions, together with the non-negligible radiative cooling, leads us to consider scenarios alternative to the Sedov one for the evolution of G327.1–1.1.
Let us first examine the WL model, describing (by a class of self-similar solutions) a wide range of conditions under which a SNR may expand in a cloudy interstellar medium. In this scenario, a delayed evaporation of the clouds causes the central density to increase with respect to the pure Sedov case. This class of solutions depends on two parameters: the mass fraction in clouds () and the cloud evaporation time scaled with the SNR age (). The solutions converge to the Sedov case when the mass deposition is small, either because little mass is contained in the clouds () or because the clouds have anyway released little mass during the SNR lifetime (). Here we assume that the mass in clouds is large (), but the evaporation time is long (): in this case the solutions form a one-parameter class, depending on just (these solutions are approximately valid also for ).
We have qualitatively compared the radial profile of the thermal component (using the center coordinates reported in Sect. 3.2) with the WL predicted profiles for various value of the parameter. We found a reasonable matching, considering the uncertainties involved, for in the range between 2.5 and 4.0. These uncertainties originate not only from the faintness of the source, but also from deviations from the assumed spherical symmetry as well as from a non perfect subtraction of the plerionic component: all of these effects, with the present data, are even difficult to quantify. Therefore, under the assumption that WL models are appropriate to model the G327.1–1.1 thermal component, we can estimate . By using the results tabulated by WL we derive which correction factors must be applied to the Sedov estimates.
For instance
| (13) |
shows how much the shock radius shrinks with respect to the Sedov case (for fixed , and ): with reference to the quantity , defined in Eq. 7 of WL, the relation holds. Moreover the equations
| (14) | |||||
| (15) | |||||
| (16) |
refer to comparisons with the Sedov solution keeping and constant. The above scaling factors are evaluated by interpolating data from Table 6 of WL. In the above expressions we have used the index S to indicate the values in the Sedov solution.
Therefore the corrections required to derive, for the WL model, the relations equivalent to Eqs. 6–11 for the associated Sedov case are:
| (17) | |||||
| (18) | |||||
| (19) | |||||
| (20) | |||||
| (21) | |||||
| (22) |
It should be noted that here by “associated” WL and Sedov solutions we indicate those showing the same observed properties (i.e. size, and EM).
The values of the parameters derived with the WL model are also given in the second column of Table 2. Compared to the pure Sedov case, now the ambient (intercloud) density results to be lower, while the shock velocity is higher (which also makes the SNR younger). The distance estimate based on the energy requirement now gives , still compatible with the lowest distance estimates for this source (Seward et al. 1996). The cooling efficiency (in the intercloud medium) can be evaluated from Eq. 12, by substituting with and with : it results much smaller () than in the Sedov case.
On the basis of our analysis, a WL model fits the average radial profile of the Thermal remnant better than the Sedov model. Moreover the WL model gives reasonable values of the SNR parameters, even though: 1. it leads to a rather small SNR age, with problems for the offset of the associated neutron star (see below); 2. for a standard SNR energy, it leads to a distance somehow smaller than what estimated by other methods.
A further scenario which may account for thermal X-ray from inner regions is that of a SNR in radiative phase (with in addition possible effects, like thermal conduction and flux saturation). A common property of non-radiative spherical shocks expanding in a homogeneous medium is the presence in the inner region of a hot and thin medium, which therefore behaves as a very low efficiency emitter, and forms the typical hollow sphere emission pattern of shell-type SNRs. In a cloud evaporation model (as WL, see above), this region is filled with material originally stored in small clouds. But since inside the shell the pressure equilibrium is roughly maintained, it would be sufficient to cool down this gas (even without adding further material) in order to make it denser.
Unfortunately no self-similar solution is known for radiative shell-type SNRs, and therefore a quantitative description of this class of objects requires to develop numerical models, which are beyond the scope of this work. Models of this kind have been already developed, for instance for W44, by various authors (Harrus et al. 1997; Cox et al. 1999; Shelton et al. 1999). Here let us simply compare the basic parameters of G327.1–1.1 and W44 to infer their relative evolutive conditions, under the assumption that both have reached the radiative phase.
Table 3 lists, for both remnants, some basic parameters, either observed or derived: in the latter case a Sedov model has been used for the derivation. Thus if these SNRs are no longer in Sedov phase, the listed values are inaccurate (even though, simply for dimensional arguments, not too far from the correct values).
For instance the absolute ages, as reported in Table 3, may be understimated since in radiative phase the SNRs must have decelerated with respect to the Sedov phase. We know this is the case for W44, where the Sedov estimate is about half of what derived from more detailed NEI models, as well as half of the pulsar spin-down age (Harrus et al. 1997).
If also G327.1–1.1 is in radiative phase, its true age may be substantially larger than 29,000 yr (as from Table 3). At any rate, if we exclude the WL scenario, this SNR must be much older than originally estimated by SWC (11,000 yr). An implication would be that the lower limit on the velocity of the compact object ( km s-1, as from SWC, in order to account for the displacement of the compact source from the SNR center) can be lowered by a factor 3 or even more: therefore in this case there is no need for an anomalous pulsar velocity.
Although some values listed in Table 3 may be inaccurate in an absolute sense, we are confident that they may still be used for a comparative analysis of the two SNRs. For instance G327.1–1.1 looks older than W44; it also expands with a lower velocity, and in a slightly thinner medium. Moreover, as shown in the last line of the table, the cooling efficiency in G327.1–1.1 is much higher than in W44, and this fact strengthens the idea that, if a radiative scenario results to be appropriate to the case of W44, it should be even more reasonable for G327.1–1.1.
| G327.1–1.1 | W44 | |
|---|---|---|
| age | ||
Although expanding in a higher ambient density, G327.1–1.1 radio shell is about 3 times fainter than W44: also this difference could be a consequence of its age. The fact that high resolution maps of the radio continuum from W44 present a strongly filamented pattern has been taken (Cox et al. 1999) as evidence for the remnant being in radiative phase. If this is the case, higher resolution radio maps of G327.1–1.1, able to test the presence of filamentation, could be valuable to shed light on the evolutive phase of this remnant.
4.2 The plerionic component
Like W44, G327.1–1.1 shows both a shell and a plerionic component in radio, while a thermal filled-centre and a non-thermal component in X rays: the main difference is that in G327.1–1.1 the plerionic component is more prominent than in W44. Another similarity between W44 and G327.1–1.1 is the displacement of the plerionic component from the shell centroid, as well as its bow shock shape.
An analysis of the integrated spectrum of the plerionic component can be carried on in a very similar way as already done by SWC. Our estimate of the 0.5–10 keV luminosity of the plerion () is about 0.5 times that estimated by SWC; moreover the age we find is at least a factor 2.4 larger, and all this affects the derivation of pulsar and nebular parameters.
By applying an empirical relation (Seward & Wang 1988), SWC used the X-ray nebular luminosity () to infer the pulsar spin down power (), which for a magnetic dipole braking is proportional to . The age estimate () is the other relation which allows one separating the pulsar timing parameters and , and to estimate also the pulsar surface field: SWC report and . Since by this procedure , while , our revised values lead to a somehow shorter period () and to a lower surface field (). The presence of a faster, and lower-B pulsar compared to that in W44 is in fact required by the presence of a reasonably bright, although aged, plerion.
SWC also used a spectral break in the nebular spectrum (at about ) to infer a nebular field . Since the field derived in this way is , we infer instead a nebular field . For a radius of for the (radio) plerion, the total magnetic energy is . The plerion is then slightly underpressured (), compared to the thermal remnant, if in Sedov or WL regime; while a better pressure balance may be attained if the shell is in radiative expansion. Anyway the uncertainties involved in these estimates are too large to take this as a strong argument in favour of a radiative shell.
5 Summary and conclusions
We have used a BeppoSAX X-ray observation of G327.1–1.1 to study the origin of its X-ray emission, with particular emphasis on its thermal component, which has not been studied in detail in the literature, because of its superposition with the bright non-thermal plerion. We fitted the plerion and the total SNR spectrum with a combination of thermal and non-thermal models, finding an X-ray temperature keV for the hot plasma and a power-law photon index for the plerion. Using the flux derived for the non-thermal plerion, we have subtracted the non-thermal component from the total 0.1–1 keV SNR image, thus obtaining for the first time an image of the thermal hot plasma.
The emission from the plasma is not confined to a bright shell, and shows possible emission for inner regions. We have then examined for this SNR also scenarios different from the Sedov one. The model of SNR expansion in a medium with evaporative clouds developed by White & Long (1991) may account for the observations, although it may imply an age and distance for this object which are somehow smaller than expected. We have shown that a radiative expansion with strong central cooling may also describe the data. We have derived and compared the remnant characteristic parameters for the various scenarios, either Sedov, or White & Long (1991), or radiative model, showing that the last model implies a very long age ( yr): in this case the observed offset of the associated pulsar may be accounted for without requiring a too high spatial velocity for it.
A comparison with W44, a remnant for which there is also evidence of radiative expansion, indicates that G327.1–1.1 may be substantially more evolved than W44. Future high sensitivity X-ray and radio observations are strongly encouraged, because they may dissipate any doubt about the evolutionary stage of this object and in particular of its shell. Finally, we have also revised the estimate of the pulsar and nebular magnetic field.
Acknowledgements.
F. Bocchino acknowledges partial support from MIUR and ASI. This work has been partly supported by MIUR under Grant Cofin2002–02–10.References
- Anders & Grevesse (1989) Anders, E. & Grevesse, N. 1989, Geochim. Cosmochim. Acta., 53, 197
- Boella et al. (1997) Boella, G., Butler, R. C., Perola, G. C., et al. 1997, A&AS, 122, 299
- Case & Bhattacharya (1998) Case, G. L. & Bhattacharya, D. 1998, ApJ, 504, 761
- Cox et al. (1999) Cox, D. P., Shelton, R. L., Maciejewski, W., et al. 1999, ApJ, 524, 179
- Frontera et al. (1997) Frontera, F., Costa, E., dal Fiume, D., et al., 1997, A&AS, 122, 357
- Harrus et al. (1997) Harrus, I. M., Hughes, J. P., Singh, K. P., Koyama, K., & Asaoka, I. 1997, ApJ, 488, 781
- Helfand & Becker (1987) Helfand, D. J. & Becker, R. H. 1987, ApJ, 314, 203
- Manzo et al. (1997) Manzo, G., Giarrusso, S., Santangelo, A., et al., 1997, A&AS, 122, 341
- McCray (1987) McCray, R. A. 1987, in Spectroscopy of Astrophysical Plasmas, A. Dalgarno and D. Layzer eds. (Cambridge University Press), 255–278
- Morrison & McCammon (1983) Morrison, R. & McCammon, D. 1983, ApJ, 270, 119
- Parmar et al. (1997) Parmar, A. N., Martin, D. D. E., Bavdaz, M., et al., 1997, A&AS, 122, 309
- Petruk (2001) Petruk, O. 2001, A&A, 371, 267
- Rho & Petre (1998) Rho, J. & Petre, R. 1998, ApJ, 503, L167
- Rho et al. (1994) Rho, J., Petre, R., Schlegel, E. M., & Hester, J. J. 1994, ApJ, 430, 757
- Sedov (1959) Sedov, L. I. 1959, Similarity and Dimensional Methods in Mechanics (New York: Academic Press, 1959)
- Seward et al. (1996) Seward, F. D., Kearns, K. E., & Rhode, K. L. 1996, ApJ, 471, 887
- Seward & Wang (1988) Seward, F. D. & Wang, Z. 1988, ApJ, 332, 199
- Shelton et al. (1999) Shelton, R. L., Cox, D. P., Maciejewski, W., et al. 1999, ApJ, 524, 192
- Sun et al. (1999) Sun, M., Wang, Z., & Chen, Y. 1999, ApJ, 511, 274
- White & Long (1991) White, R. L. & Long, K. S. 1991, ApJ, 373, 543
- Whiteoak & Green (1996) Whiteoak, J. B. Z. & Green, A. J. 1996, A&AS, 118, 329