The Brera Multi-scale Wavelet ROSAT HRI source catalogue (BMW-HRI)
We present the Brera Multi-scale Wavelet ROSAT HRI source catalogue (BMW-HRI) derived from all ROSAT HRI pointed observations with exposure time longer than 100 s available in the ROSAT public archives. The data were analyzed automatically using a wavelet detection algorithm suited to the detection and characterization of both point-like and extended sources. This algorithm is able to detect and disentangle sources in very crowded fields and/or in presence of extended or bright sources. Images have been also visually inspected after the analysis to ensure verification. The final catalogue, derived from 4,303 observations, consists of 29,089 sources detected with a detection probability of . For each source, the primary catalogue entries provide name, position, count rate, flux and extension along with the relative errors. In addition, results of cross-correlations with existing catalogues at different wavelengths (FIRST, IRAS, 2MASS and GSC2) are also reported. All these information are available on the web via the DIANA Interface. As an external check, we compared our catalogue with the previously available ROSHRICAT catalogue (both in its short and long versions) and we were able to recover, for the short version, of the entries. We computed the sky coverage of the entire HRI data set by means of simulations. The complete BMW-HRI catalogue provides a sky coverage of 732 deg2 down to a limiting flux of and of 10 deg2 down to . We were able to compute the cosmological log(N)-log(S) distribution down to a flux of .
Key Words.:
catalogues – X–rays: general1 Introduction
Since the early phases of X–ray astronomy, source catalogues have been regularly compiled either from systematic sky surveys or from the collection of serendipitous observations, especially when imaging X–ray telescopes became available (e.g. Einstein EMSS, Gioia et al. gioia90 (1990); EXOSAT HGSC, Giommi et al. giommi91 (1991); ROSAT WGA, White, Giommi & Angelini white94 (1994); ROSAT SRC, Zimmermann zimmermann94 (1994); ASCA SIS, Gotthelf & White gotthelf97 (1997)). Depending on the telescope field of view and mission lifetime, these surveys covered of the sky and allowed to pursue the statistical studies on virtually all classes of X–ray emitting sources.
Observations with the ROSAT PSPC produced a number of catalogues; besides the RASS-BSC (Voges et al. voges99 (1999)), derived from the ROSAT All Sky Survey, there are the WGA (White, Giommi, Angelini white94 (1994)) and the ROSPSPC (ROSAT Team 2001), derived from the collection of all PSPC pointed observation. On the contrary the large database of ROSAT High Resolution Imager (HRI) observations has been only marginally exploited. Rather recently (August 2001), a full catalogue based on the Standard Analysis Software System (SASS) has been released (ROSHRICAT, ROSAT Team 2001). This catalogue contains arcsecond positions and count rates for automatically and visually inspected sources, including 13,452 high confidence (S/N ) detections, from 5,393 public ROSAT HRI observations covering of the sky. However, the SASS suffers from some limitations (e.g. 331 “obvious” sources were added manually since they were not detected by the SASS), not least the fact that only bright sources can be securely detected.
The HRI on board the ROSAT satellite is a microchannel plate detector with an octagon–like shape field of view (with radius) that reveals single X–ray photons providing information on their positions and arrival times. The HRI Point Spread Function (PSF) as measured on–axis is of about 5 arcsec FWHM, i.e. a factor of better than the one of ROSAT-PSPC (and just a factor of worse than Chandra). The sharp core of the HRI PSF allows to detect and disentangle sources in very crowded fields and to detect extended emission on a small angular size. On the other hand, the HRI has a very crude spectral resolution in the 0.1–2.4 keV energy band (for more details see Prestwich et al. prestwich96 (1996)), it is less efficient than the PSPC (a factor of 3 to 8 for a plausible range of incident spectra) and it has a higher instrumental background. The ROSAT satellite, its X–ray telescope, and the HRI detector have been described in detail by Pfeffermann et al. (pfeffermann86 (1986)), Zombeck et al. (zombeck90 (1990)), Trümper et al. (trumper91 (1991)) and David et al. (david98 (1998)).
For these reasons, we decided to reanalyze the entire HRI data set with a dedicated source detection algorithm based on the wavelet transform (Lazzati et al. lazzati99 (1999); Campana et al. campana99 (1999)). The outcome is a new source catalogue named Brera Multi-scale Wavelet HRI (BMW-HRI). Here we present the results of our analysis. In section 2 we resume the main characteristics of the detection algorithm. In section 3 we discuss the selection of the ROSAT HRI fields used and we describe the catalogue. In section 4 we present the cosmological Log(N)-Log(S) distribution computed from our catalogue. In section 5 we made a comparison with the ROSHRICAT catalogues. In section 6 we describe the cross-correlations between the BMW-HRI and other catalogues at various wavelengths. Conclusions and catalogue accessibility are reported in section 7.
2 Wavelet detection algorithm
The analysis and source detection of HRI images, together with the simulations carried out to test the detection pipeline, are extensively described in Campana et al. (campana99 (1999)) and Lazzati et al. (lazzati99 (1999)). In this case we decided to run the detection algorithm with a single significance threshold for the sources () corresponding to a contamination of 0.4 spurious sources per field. We remark here that one of the most interesting features of the wavelet analysis is the possibility of characterizing the source extension (see sub-section 3.2 and Campana et al. 1999). The data were retrieved from the MPE and GSFC public ROSAT databases. Our data processing pipeline analyzes the FITS event files, as produced through the SASS procedure, and the ancillary files that include orbit and spacecraft pointing and other engineering or housekeeping information. From the analysis of each observation we derived a catalogue of sources with position, count rate, extension, along with the relative errors, as well as ancillary information about the observation itself and source fitting. The count-to-flux conversion factor was determined assuming as reference a Crab spectrum (power law with photon index 2.0). A conversion factor was computed both for a low column density () and for the full galactic value. We also applied the corrections due to the vignetting, PSF modelling (we considered a Gaussian fit), plate scale (the nominal pixel size was reduced to after detailed observations on the Lockman hole field, see Hasinger et al. hasinger98 (1998)) and PSF asymmetry at large off–axis angles (see Campana et al. campana99 (1999)).


3 The BMW-HRI catalogue
3.1 Selection of the ROSAT HRI fields
The starting point for the BMW-HRI catalogue production was the sample of 4,507 ROSAT HRI fields published till December 2001 with exposure time longer than 100 s. We did not include in our selection the 341 fields pointed on supernova remnants (fields with identification number, ROR, starting with 5) due to the large number of bright overlapping spots in which the remnant is splitted. This despite the fact that the central source of the (e.g) Cas A remnant is clearly detected as point source (Pavlov et al. pavlov00 (2000)). We also did not consider the 598 calibration observations (fields with ROR starting with 1). All the 4,507 fields were analyzed self-consistently with the detection algorithm described in section 2. Of the 4,507 fields analyzed, 204 () were discarded due to problems in the construction of the exposure map, or in the reconstruction of the aspect attitude, or due to problems during the analysis. In particular, several fields affected by the spacecraft wobbling during the exposures were discarded because bright sources appeared artificially elongated and therefore splitted into at least two sources by the detection algorithm. Moreover, very confused fields like, e.g., the ones targetted to Eta Carinae, were discarded. Finally, a few fields pointed on planets and comets were discarded due to their proper motion which induces multiple detections across the images. Therefore, we ended up with 4,303 fields. As our detection threshold corresponds to 0.4 spurious sources per fields, we expect spurious sources over all the fields. In 146 fields no sources were detected, due to the too short exposure time. Fig. 1 shows the Aitoff projection in galactic coordinates for the 4,303 observations.


The distribution of the exposure times can be roughly described by a double Gaussian distribution with and ks as centroid peaks (see Fig. 2). In Fig. 3 we plot the distribution of the galactic hydrogen column density after Dickey & Lockman (dickey90 (1990)).
3.2 Catalogue characteristics
The BMW-HRI catalogue consists of 29,089 sources down to a limiting ROSAT HRI count-rate of covering of the sky. A detailed description of all the BMW-HRI parameters together with the ones derived from the cross-correlations (see section 6) can be found in the Appendix A (table A.1, A.2, A.3, A.4 and A.5). The catalogue lists all the sources detected in all the 4,303 fields analyzed, i.e. we did not associate sources detected in different observations of the same area of the sky. An estimate of the number of independent sources in the catalogue can be obtained compressing the number of sources using an error on the source position of (a conservative limit dictated by the uncertainties connected with the boresight correction). We found 20,453 independent objects.
In Fig. 4 we plot the distribution of source off–axis angles showing the typical trend due to the increase of the collecting area together with the decreasing of the sensitivity with off–axis. Clearly, the peak at zero off–axis is due to pointed sources.
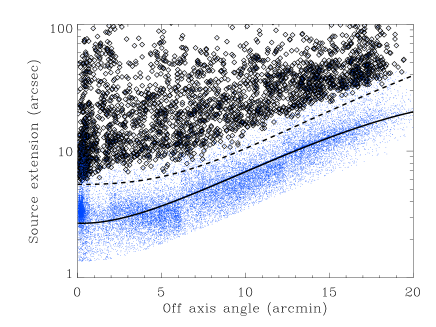
One of the most important characteristics of wavelet algorithms is the ability to determine the source extension, i.e. the scale of the wavelet transform where the S/N is maximized after the application of the fitting refinement procedure (see Lazzati et al. lazzati99 (1999)), and, if a criterion is given, also to disentangle point and extended sources (see Campana et al. campana99 (1999)). To assess the source extension criterion we considered all sources detected in the observations that have a star(s) as a target (ROR number beginning with 2) and that were available in the public archives in a preliminary phase of our catalogue: 6,013 sources in 756 HRI fields. The distribution of the source extension as a function of the source off–axis angle has been divided into bins of 1 arcmin each. To each bin we then applied a clipping algorithm to discard iteratively truly extended sources and to derive the mean value of the source extension in the bin for pointed sources. We then determined the dispersion on the mean for each bin. The mean value plus the dispersion provides the threshold for the source extension. We conservatively classify a source as extended if it lies more than from this limit (i.e. if the source extension error bar lies more than twice from the limit described above). Combining this threshold with the on the intrinsic dispersion, we obtain a confidence level for the extension classification (see also Rosati et al. rosati95 (1995)). In Fig. 5 we plot the distribution of the source extension versus off–axis angle for the 29,089 BMW-HRI sources (small dots). The solid line in Fig. 5 represents the mean value of source extension for pointed sources as described above, while the dashed line is the dispersion on this mean. Open squares in Fig. 5 represent sources we classified as extended, i.e. with a confidence level for the extension classification of .
We end up with 2,717 extended sources (open squares in Fig. 5) containing supernova remnants, galaxies, cluster of galaxies etc. (as well as blending of nearby sources). The distributions of source extensions for the truly extended sources, the full sample and only the high-galactic latitude () one (2,139 sources), are reported in Fig. 6. We assumed that all the high-galactic latitude extended sources are extragalactic in nature. In the plot we also report the on–axis angular resolution of the ROSAT PSPC. X–ray extensions are calculated subtracting in quadrature the relative PSF extension at a given off–axis angle (solid line in Fig. 5). The extended sources were used to select a list of candidate X–ray selected cluster of galaxies that we then studied with optical follow-up (Moretti et al. moretti02 (2002) in preparation; Guzzo et al. guzzo02 (2002) in preparation).

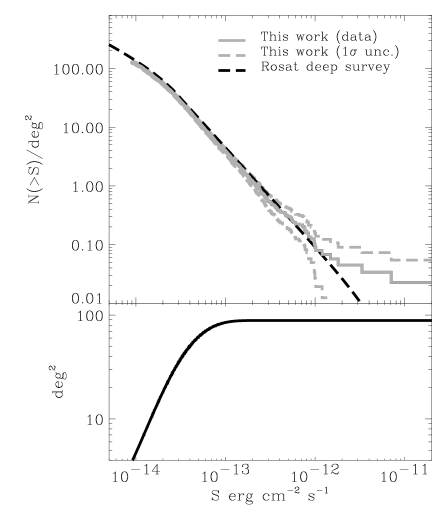
As the sensitivity of the HRI instrument is not uniform over the entire field of view, for a given limiting flux the surveyed area does not coincide with the detector one but it is generally smaller. We calculated the sky coverage of the entire survey as a function of the flux (calculated with the full column density) by means of simulations. To this aim we performed extensive Montecarlo tests using the detection procedures on the simulated data for 12 observations with different exposure times (i.e. 1,680 s, 2,656 s, 4,976 s, 10,000 s, 16,080 s, 20,664 s, 27,488 s, 42,672 s, 52,880 s, 80,288 s, 107,712 s and 200,272 s). For each field of the survey we derived a completeness function that gives the detection probability as a function of flux and position of point-like sources. Because of the worsening of the PSF, within the same field, the detection probability of a given flux decreases for increasing off–axis angle. Therefore, for each observation the sky coverage is the integral of the completeness function over the field of view. Moreover, each observation has different completeness function depending on the exposure time and on the column density values. The sky coverage of the whole survey is the sum of the contributions of each single field. Some of the fields used to build the BMW-HRI catalogue cover the same area of the sky: in this case in the calculation of the total sky coverage we considered only the contribution from the longest observation performed over that area. All the procedures of data simulations and the features of the Montecarlo tests are fully described in Moretti et al. (moretti02 (2002) in preparation). The complete sky coverage for point-like sources is shown in Fig. 7 (for extended sources see Moretti et al. moretti02 (2002) in preparation). The maximum area of the survey is deg2 and corresponds to fluxes above . At the surveyed area is deg2 and deg2 at .

4 Log(N)-Log(S)
In order to compute the integral flux distribution (log(N)-log(S)) of cosmological sources we used a subsample of the catalogue. Firstly, we selected all high galactic latitude fields () observed for more than 5 ks. Then, we filtered out those containing extended sources (like NGC objects and galaxies clusters), Magellanic Clouds targets or crowded areas (e.g. M31). Finally, from the remaining fields, we choose sources with off–axis angles between 3 and 15 arcmin. To summarize, we restricted to 501 fields ( deg2) and 3,161 sources. The survey is inhomogeneous (because of the worsening of the PSF with the off–axis) thus in the computation of the flux distribution different sources have different weights. The weight is defined as the inverse of the area in which the source has a non-zero probability of being detected. Our results are compared in Fig. 8 with those of the ROSAT Deep Survey (Hasinger et al. hasinger98 (1998)). We derive our distribution down to where the surveyed area corresponds to of the total ( deg2). The ROSAT Deep Survey extends to fainter fluxes and it is well fitted by a broken power law, with the break at (Hasinger et al. hasinger98 (1998)). The BMW-HRI distribution is very similar both in steepness and in normalization to the ROSAT Deep Survey, but extends to brighter fluxes, a factor of 2 after the break point. In order to compare the two distributions, we exclude from the BMW-HRI distribution the fainter fluxes (; this is why we cannot constrain the power law below the break with such few points) and we compared the BMW-HRI distribution with the bright part of the ROSAT Deep Survey. By means of a maximum likelihood minimization fit we find that, assuming a single power law for the differential distribution, the best fit for the exponential is given by with a normalization of (in units of ). This value is in very good agreement with the bright part of the ROSAT Deep Survey flux distribution ( and a normalization of 238.1; Hasinger et al. hasinger98 (1998)).
5 Comparison with the ROSHRICAT catalogues
We compared the BMW-HRI with the ROSAT source catalogue of pointed observations with the High Resolution Imager (ROSHRICAT/1RXH, ROSAT Team 2001). This catalogue, derived by reprocessing the public HRI dataset (a total of 5,393 pointings covering 1.94 of the sky) through the SASS, provides arcsecond positions and count rates for 131,902 sources. This version includes detections which were classified as false after a visual inspection (“f” detections), multiple detections of the same source within the same observation (“u” detections) and 331 obvious sources which were not detected by the SASS and added manually (see Appendix A.2). After removing “u” and “f” detections, 56,401 entries are left (ROSHRICAT long version). Additionally, applying a yields to 13,452 high confidence detections (ROSHRICAT short version).
We compared the BMW-HRI catalogue with the ROSHRICAT, both in its short and its long version (hereafter ROSHRICAT-short and ROSHRICAT-long, respectively) by cross-correlating the entries in the two catalogues. The results of these cross-correlations are summarized in this section while a detailed description of specific checks is given in Appendix A. For consistency, we applied to the ROSHRICAT catalogues the same selection criteria applied in the compilations of the BMW-HRI (see section 3). Moreover, we filtered out from the ROSATHRICAT catalogues the 331 entries which were not detected by the SASS (no flux information), plus some detections with a wrong declination (4 sources for the short version and 64 sources for the long version). We remain with 10,708 and 43,252 entries for the ROSHRICAT-short and long respectively. To compute the cross-correlation radius we first calculated the positional error corresponding to the 95 of the sources both for the BMW-HRI and for the ROSHRICAT catalogues. By adding in quadrature the two errors we obtain radii of 8 and 12 arcsec, to be used for the cross-correlations with the ROSATHRICAT short and long, respectively. As the number of the ROSHRICAT sources that cross-correlate with each BMW-HRI sources can be, in several cases, more than one, we decided to choose the nearest ROSHRICAT source (minimum distance approach).
5.1 Comparison with the ROSHRICAT short version
We first cross-correlated the BMW-HRI (29,089 entries) with the ROSATHRICAT-short (10,708 entries) using a cross-correlation radius of 8 arcsec, as determined above, and finding 12,442 associations. This means that a single ROSHRICAT-short source matches more than one BMW-HRI object. We remember that, for our catalogue, we did not associate objects detected in different observations of the same area of the sky. The number of ROSHRICAT single sources in the cross-correlation is 9,670. By shifting the coordinates of 3 arcmin we found that the probability of mismatch is of the order of 0.6 (that is 73 mismatches). Comparing the ROSHRICAT-short count rates with the BMW-HRI ones we found that a fraction of 87 has count rates equal within a factor of 2. 1,038 ROSATHRICAT-short sources are found without a correspondence in the BMW-HRI source list. In order to check only firmly detected sources we considered objects with S/N (378 entries). We found that: have a BMW-HRI association within 30 arcsec; are spurious sources while are of ambiguous interpretation and in some cases could be true sources lost by our algorithm (a more extensive discussion is given in Appendix A.1).
The number of BMW-HRI sources without a counterpart in the ROSHRICAT short version is 16,647. We discuss the sources lost in the ROSHRICAT catalogues in section 5.2 since a source lost in the short version can have a counterpart in the long version.
In Fig. 9 we show the distributions of the angular separation ( in arcsec) between ROSHRICAT counterpart position and BMW-HRI position for the 12,442 cross-correlated objects.

The BMW-HRI source count-rates for the common entries are plotted (in logarithmic scale) in Fig. 10 vs. the corresponding values from the ROSHRICAT-short.

5.2 Comparison with the ROSHRICAT long version
The cross-correlation (radius of 12 arcsec) between BMW-HRI and ROSHRICAT-long (43,252 objects) produced 21,982 entries. The probability of misidentification is of the order of (that is 595 mismatches). The number of ROSHRICAT single sources in the cross-correlation is 21,120. Thus 22,132 ROSHRICAT sources are not present in the BMW-HRI catalogue. We note that the great majority of them (21,924) have S/N lower than 5.
There are 7,107 BMW-HRI sources without a counterpart in the ROSHRICAT-long. Using a cross-correlation radius of 18 arcsec (i.e. corresponding to of the combined average positional error of the two catalogues) the number of unmatched sources reduces to 5,870. Since the number of spurious detections expected in the BMW-HRI is , we expect that of the 5,870 sources to be background fluctuations. In order to investigate in more details these 7,107 sources, we filtered out sources detected in fields with extended emissions or too crowded on which the SASS algorithm may had problems. Moreover, we decided not to investigate sources with as they are near the detection threshold. The analysis of a sub-sample of these sources with S/N (1,170 objects) shows that: are true sources without a counterpart in the ROSHRICAT catalogue; have a ROSHRICAT association with angular separation arcsec while are probably spurious sources (see Appendix A.3). For clarity in Table 1 we put the results of the cross-correlations with the short and long version of the ROSHRICAT respectively.
| BMW-HRI | ROSHRICAT-short | Radiusb | BMW-HRI | ROSHRICAT-short | Mismatches |
|---|---|---|---|---|---|
| entries | entriesa | (arcsec) | cross-correlations | cross-correlations | |
| 29,089 | 10,708 | 8 | 12,442 | 9,670 | 73 |
| BMW-HRI | ROSHRICAT-long | Radiusb | BMW-HRI | ROSHRICAT-long | Mismatches |
| entries | entriesa | (arcsec) | cross-correlations | cross-correlations | |
| 29,089 | 43,252 | 12 | 21,981 | 21,120 | 595 |
(a)All the entries of the ROSHRICAT short/long version except: sources corresponding to fields with ROR number 1 and 5; sources corresponding to all the fields we rejected after or during the analysis; the 331 sources not detected by the SASS and the 4/64 sources with a wrong declination (see section 5.1 for more details);
(b) the radius corresponds to on the source positional errors of the two catalogues.
6 Cross-correlations with existing data-bases
Since the sharp core of the ROSAT HRI PSF allows for a more precise determination of the position of an X–ray source, cross-correlations with catalogues at other wavelengths are less affected by spurious matches. This makes the search for counterparts much easier. We cross-correlated the BMW-HRI catalogue with the largest catalogues available at other wavelengths, from radio to optical. For cross-correlation with catalogues at other wavelengths we used (unless otherwise stated) a search radius of 10 arcsec. This value comes from the major source of uncertainty in the reconstruction of BMW-HRI source positions,which is the uncertainty in the aspect solution of the ROSAT telescope (i.e. the boresight uncertainty).
6.1 The FIRST Survey Catalogue
FIRST – Faint Images of the Radio Sky at Twenty-cm – covers 10,000 square degrees of the North Galactic Cap. The sensitivity of the survey is of 1 mJy with an angular resolution of 5 arcsec (see Becker et al. becker95 (1995)). A catalogue containing 770,000 sources and covering 8,500 square degrees has been constructed (White et al. white97 (1997)). The combined sensitivity and positional accuracy of the FIRST catalogue are unprecedented compared with any previous wide-area radio catalogue. FIRST source locations have an accuracy that matches or exceeds those of all currently available radio catalogues. The cross-correlation with the BMW-HRI found 1,019 entries with a misidentification probability of the order of 2 (that is 18 mismatches). Our cross-correlation is similar to the one made using FIRST and the catalogue of X–ray sources WGACAT from ROSAT PSPC observations (White, Giommi & Angelini white94 (1994); see White et al. white97 (1997)) and represents one of the largest lists of X–ray/radio coincidences available to date. In Fig. 11 we report the distributions of the angular separation ( in arcsec) between the radio and the X–ray position for the 1,019 matched objects.

In Fig. 12 we plot the integrated flux densities measured in mJy versus X–ray flux (full column density) for the 1,019 cross-correlated sources. The integrated flux is derived by fitting an elliptical Gaussian model to all FIRST sources.

As in the FIRST catalogue we have information about the source extension (the major axis, i.e. the FWHM in arcsec derived from the elliptical Gaussian model for the source) we plot in Fig. 13 the radio extension versus the X–ray one for the BMW-HRI objects classified as extended sources (122 entries) in the cross-correlation with FIRST. In the plot, X–ray extensions are the ones derived by our fitting procedure and subtracting in quadrature the relative PSF at a given off–axis angle. All the FIRST parameters with a brief description are reported in Appendix A (Table A.2).

6.2 The IRAS Point Source catalogue
The Infrared Astronomical Satellite (IRAS) conducted a survey of 98 of the sky, from January to November 1983, in four wavelength bands centered at 12, 25, 60, and 100 m leading to the IRAS Point Source Catalogue (PSC). The catalogue contains some 250,000 sources (Beichman et al. beichman88 (1988)). Away from confused regions of the sky, the PSC is complete to about 0.4, 0.5, 0.6, and 1.0 Jy at 12, 25, 60, and 100 m. The angular resolution of sources detected by IRAS varied between about 0.5 arcsec at 12 m to about 2 arcmin at 100 m. The positional accuracy depends on source size, brightness and spectral energy distribution but is usually better than 20 arcsec. Using a cross-correlation radius of 20 arcsec (because of the IRAS positional accuracy) we found 1,149 identifications with a misidentification probability of (20 mismatches). We note that all the objects that have been found in common with this catalogue have been detected in all four IRAS bands. In Fig. 14 we plot the distributions of the angular separation ( in arcsec) between the infrared and the X–ray position for the matched objects.

Fig. 15 shows for example the 12 m flux (in mJy) versus X–ray flux (full column density) for the 1,149 cross-correlated sources. All the IRASPSC parameters with a brief description are reported in Appendix A (Table A.3).

6.3 The 2MASS Survey Catalogue
The Two Micron All Sky Survey covers over 19,600 deg2 () of sky observed from both the hemispheres. The catalogue contains positional and photometric information for 162,213,354 point and 585,056 extended sources observed in the three bands (m), (m) and (m). The nominal survey completeness limits are 15.8, 15.1 and 14.3 mag respectively. We have cross-correlated the BMW-HRI with the 2MASS Point Source Catalogue 2000 (Second Incremental Release) finding 7,900 entries with a misidentification probability of (that is 2,174 mismatches). The number of X–ray sources found to have an infrared counterpart with a measure in all the three bands is 7,624.

In Fig. 16 we report the distributions of the angular separation ( in arcsec) between the infrared and X–ray position for the 7,900 matched objects. Fig. 17 shows, for example, magnitude versus X–ray flux (full column density) for the cross-correlated sources with a measured magnitude (7,644). A fraction of the cross-correlated objects, the diagonal line in Fig. 17, shows a rather good correlation between X–ray and infrared fluxes probably due to common dependence on the distance (see also Fig. 19 for the cross-correlation between GSC2 and the BMW-HRI). All the 2MASS parameters with a brief description are reported in Appendix A (Table A.4).


6.4 The Guide Star Catalogue 2
As a reference for our cross-correlations in the optical, we used the extended, yet unpublished, version of the recently released Guide Star Catalogue 2 (GSC2). The GSC2 is an all-sky, multi–epoch and multi–colour optical catalogue based on the digitization of 8,000 Schmidt plates obtained from 13 photographic surveys carried out between 1953 and 1991 (McLean et al. mclean02 (2002), in preparation). The catalogue presently includes more than 1 billion objects. The GSC2 is aimed at providing an all-sky coverage in three photographic bands, namely , and (roughly comparable to Johnson , and filters). In its current version (GSC2.2), the GSC2 covers the entire sky in and bands only, while the coverage in the passband is being completed for GSC2.3. In addition, a partial coverage in the Northern hemisphere and in the South Galactic Plane is available in the band (roughly comparable to Johnson filter). The limiting magnitudes for GSC2 are , and in the , and bands, respectively. In the band, the limiting magnitudes are in the North and in the South Galactic Plane region. The photometry is accurate within 0.2 magnitudes at . The astrometry has been calibrated using as a reference the coordinates of stars extracted from the Tycho (Høg et al. hog00 (2000)) and Hipparcos (Perryman et al. perryman97 (1997)) catalogues and have an absolute, intrinsic, accuracy of arcsec. The GSC2 provides also morphological classifications for all the objects detected in at least two bands, with a confidence level for objects in at and brighter than .
The cross-correlation with the BMW-HRI found 21,311 entries indicating that an optical identification will be available for a sizeable fraction of BMW-HRI sources. The mismatches are 10,508, that is a misidentification probability of . This clearly indicates that the number of optical objects at the GSC2 limiting magnitude is very high and that for many objects one finds more than one association within 10 arcsec beam-size. In fact we found that 4,822 have two possible counterparts while 2,945 have more than two associations. This situation can be improved for those ROSAT HRI fields for which more than two X–ray sources can be tied to the optical reference (i.e. boresight correction). The total number of GSC2 non-star objects in the 21,311 cross-correlations is 9,696, while 11,331 are objects classified as “star” (284 are without classification). The number of X–ray sources found to have an optical counterpart with a magnitude measure in the J and F bands (all-sky coverage) is 13,951, while is 68 if we also consider the N band (coverage completed for GSC2.3).
A cross-correlation with the GSC (limiting magnitude about 15) yields only objects. This indicates that the BMW-HRI source population has a large number of optical matching within the 15–22 magnitude range. In Fig. 18 we report the distributions of the angular separation ( in arcsec) between the optical and the X–ray position for the 21,311 matched objects.
Fig. 19 shows, for example, magnitude versus X–ray flux (full column density) for the cross-correlated sources with a measured magnitude (18,421 objects).


Since in the GSC2 we have an information about the source extension (the semi-major axis of the fitting ellipse) we plot in Fig. 20 the optical extension versus the X–ray extension for the BMW-HRI sources that have been classified as extended sources and having an optical counterpart with a measure of the semi-major axis (1,470 entries). In the plot the X–ray extension is that derived from our fitting procedure subtracting in quadrature the computed PSF. We note that 1,118 optical associations out of 1,470 have been classified as non-star in the GSC2, 330 as star while 22 are without a classification. For the 330 optical objects flagged as a “star” in the GSC2 and with an extended X–ray counterparts we are probably in presence of blending sources or of low intensity sources at high off–axis in the X–ray images. We note that 133 of them have off–axis arcmin and that 65 of these have S/N . While the number of sources with S/N is 107 out of 330. All the GSC2 parameters with a brief description are reported in Appendix A (Table A.5).
The number of BMW-HRI sources with an association in all the 4 catalogue (FIRST, IRASPSC, 2MASS and GSC2) is 51. All but 6 are classified as stars in the GSC2 catalogue.
| Catalogues | Wavelength | All sky fraction | Entries | Correlation | Cross-correlations | Mismatches |
| () | radius (arcsec) | |||||
| FIRST | 20 cm | 10 | 1,019 | 18 | ||
| IRASPSC | 12-25-60-100 m | 20 | 1,149 | 20 | ||
| 2MASS | 1,25-1.65-2.16 m | 162,213,354 (point) | 10 | 7,900 | 2,174 | |
| GSC2 | J-F-N-V | all sky (J,F) | 1 billion objects | 10 | 21,311 | 10,508 |
For clarity in Table 2 we report the main informations about the FIRST, IRASPSC, 2MASS and GSC2 catalogues and the results of the cross-correlations with the BMW-HRI.
7 Summary
The BMW-HRI catalogue counts all sources detected through a wavelet based algorithm over the entire set of available ROSAT HRI images with exposure time greater than 100 s. The BMW-HRI catalogue contains 29,089 sources found in 4,303 fields with a detection probability of . For each source, the primary catalogue entries provide name, position, count rate, flux and extension along with the relative errors. The catalogue covers an area of 732 deg2 down to a limiting flux of . The detection thresholds over the entire field of view were calculated by means of simulations and extensive Montecarlo tests. This allowed us to recover the log(N)-log(S) distribution for cosmological sources down to a flux of (see section 4). The BMW-HRI catalogue has been compared with both the short and long version of the ROSHRICAT catalogue and the cross-correlation for the high confidence detections is at the level and at the level for the long version (see appendix A). To test the utility of the BMW-HRI catalogue in searching possible counterparts at different wavelengths, we cross-correlated it with some of the largest existing catalogues: the radio FIRST survey catalogue, the infrared IRAS PSC catalogue, the near-infrared 2MASS catalogue and the optical Guide Star Catalogue 2 (section 6). For the radio and infrared wavelength of the BMW-HRI sources have an association in the FIRST and in the IRASPSC catalogues, respectively. While have a probable counterpart in the near-infrared (2MASS catalogue). As 2MASS survey covers of sky this result is comparable with the one obtained in the optical (all-sky survey), from the cross-correlation between BMW-HRI and GSC2 ( band). If we consider all the GSC2 bands of the BMW-HRI sources have an optical associations.
In order to access the service of the BMW-HRI catalogue a WEB based browser (via DIANA 111DIANA is a joint effort of three Italian astronomical observatories (Brera, Palermo and Roma) and the Italian Space Agency’s Science Data Center (ASDC). DIANA is a step towards the creation of a modern high energy astrophysics archive and advanced database system with extensive access to multiwavelength information. Interface) with extensive access to multiwavelength information has been built up and can be found at:
http://www.asdc.asi.it/diana/
The source by coordinate environment allows the search by object name or coordinates and to choose the output format (table only or table and sky chart). Full catalogue information is available via the HEADS - High Energy Astrophysics Database Service on line Service (mirror of HEASARC at the Osservatorio Astronomico di Brera) with a remote telnet to ares.merate.mi.astro.it with “xray” as login (no password needed) and typed “browse bmw” to access the catalogue.
Acknowledgements.
We thank A. Mistò for his help with the database software. We are grateful to P. Giommi for discussions and M. Capalbi for help with the WEB based browser via DIANA interface. This research made use of data obtained through the NASA’s HEASARC at GSFC and through the archive at MPI. This publication makes use of data products from FIRST, IRAS, 2MASS, GSC2 surveys. The 2MASS Survey is a joint project of the University of Massachusetts and the Infrared Processing and Analysis Center/California Institute of Technology, funded by the NASA and the National Science Foundation. The Guide Star Catalogue 2 is a joint project of the Space Telescope Science Institute and the Osservatorio Astronomico di Torino. STSI is operated by the Association of Universities for Research in Astronomy, for the NASA under contract NAS5-26555. The participation of the Osservatorio Astronomico di Torino is supported by the Italian Council for Research in Astronomy. Additional support is provided by ESO, ST-ECF, the International GEMINI project and the ESA Astrophysics Division. This work was supported through Cofin, CNAA and ASI grants.Appendix A Comparison between BMW-HRI and ROSHRICAT catalogues
A.1 Cross-correlation between BMW-HRI and ROSHRICAT-short
In the following we report all the checks done on the 1,038 ROSHRICAT-short sources which lack a BMW-HRI counterpart (see sub-section 5.1). Single cases were studied as a function of their S/N.
(a) ROSHRICAT-short sources with S/N (20 objects). We found that all but one of the sources have a counterpart in the BMW-HRI catalogue. If we extend the cross-correlation radius we found that 18 sources have a counterpart within arcsec and one within arcsec. We checked each of these source to investigate possible mismatches. For the remaining source we checked that it is a spurious detection near a very bright source (with a positional shift of 1.5 arcmin).
(b) ROSHRICAT-short sources with S/N between 5 and 20 (358 objects). To minimize the number of mismatches, we cross-correlated these sources using a radius of 18 arcsec, corresponding to the on the combined positional error of the two catalogues. The cross-correlation found 369 BMW-HRI sources corresponding to 221 ROSHRICAT sources, i.e., 137 ROSHRICAT objects have no counterpart in our catalogue. We checked 20 of these sources (28 objects) finding that: (i) 47 are spurious detections close to bright sources; (ii) 32 are associated with extended emission and likely spurious since the SASS detection algorithm is not suited to the detection of extended sources; (iii) 7 are from a blending of two nearby point-like sources; (iv) 14 are detected with a S/N lower than what reported by the SASS and we recover them if we use a lower detection threshold (detection probability of instead of ).
(c) ROSHRICAT-short sources with S/N 5 (660 objects). These sources are rather faint and 16 have S/N lower than 4 even in the ROSHRICAT-short itself. Their detection depends critically on the extraction radius and on local background. The great majority should have been missed by our detection algorithm because they are indeed too faint to satisfy our detection threshold (which is not based on S/N ratio).
A.2 Check on the 331 obvious sources not detected by the SASS and manually added
We found that 79 of these sources are in fields we discarded (ROR number 1 and 5 or fields rejected during the analysis). We found that 231 of the 252 remaining sources have a counterpart in our catalogue: 230 within 30 arcsec and 1 within 50 arcsec. We checked with a visual inspection the remaining 21 obvious sources finding that: 8 are spurious detections; 8 are very faint sources which we are able to detect if we use a lower detection threshold for our algorithm (significance ); 3 sources are ambiguous since XIMAGE detects only a upper limit; one source is at the edge and can be detected only by integrating its flux over all the HRI energy channels (see section 2); the remaining one is very close to an hot spot and was classified as spurious. For the 8 spurious we note that 5 of them are not far away from bright sources. It could be that the manual insertion of the coordinates were wrong.
A.3 Cross-correlation between BMW-HRI and ROSHRICAT-long
There are 7,107 BMW-HRI sources without a counterpart in the ROSHRICAT-long (see sub-section 5.2). Using a cross-correlation radius of 18 arcsec (i.e. corresponding to on the combined average positional error of the two catalogues) the number of unmatched sources reduces to 5,870. For the visual inspection we excluded sources in fields with large extended emission and too crowded and we selected a sample consisting of 1,170 sources with S/N . These sources were considered and studied as a function of their S/N.
(a) BMW-HRI sources with S/N (27 objects): (i) 63 are bright or relatively bright objects (13 at the detector edge and 4 are targets); (ii) 26 all with off–axis arcmin have a ROSHRICAT counterpart with an angular separation larger than 18 arcsec; (iii) the remaining 11 are at the edge of the detector (off–axis arcmin) and are hardly recognizable at a visual inspection.
(b) BMW-HRI sources with S/N between 5 and 20 (1,143 objects): we checked 10 of these sources. We note that 86 of these have an off–axis angle arcmin and 40 are extended sources. We found that: (i) 36 have a counterpart in the ROSHRICAT-long with an angular separation arcsec. The combination of extended emission with high off–axis angle can explain the highest angular separation. In fact almost all sources with angular separation arcsec have off-axis arcmin and are extended sources; (ii) 48 are sources without a counterpart in the ROSHRICAT-long and 50 of these are well visible at a visual inspection. We note that 85 have off–axis arcmin and that 42 are extended sources; (iii) 16 are sources of ambiguous interpretation: all these sources but one have off–axis arcmin and seem fluctuations of the background at a visual inspection. We note that 11 of these are extended sources. If we use the XIMAGE package at the positions of the point sources (16 objects) we find a upper limits for 11 sources while for the remaining 5 the algorithm detects sources with very low signal to noise ratio: 4 out 5 with S/N and the remaining with S/N .
| BMW Parameter | Description |
|---|---|
| Source Name | name of cataloged detection following IAU conventions, e.g. 1BMW143615.8+524825 |
| RA | source right ascension (J2000, hhmmss.) |
| DEC | source declination (J2000, ddmmss.) |
| RA error | error in RA (arcsec) |
| DEC error | error in DEC (arcsec) |
| Tot error | total positional error (arcsec) |
| JRA | source RA (J2000, degrees) |
| JDEC | source RA (J2000, degrees) |
| LII | source Galactic Longitude (degrees) |
| BII | source Galactic Latitude (degrees) |
| Rebin | rebin of the subimage in which the source was found |
| X pixel | source x coordinate (pixels) |
| Y pixel | source y coordinate (pixels) |
| Offaxis | offset from Target position (arcmin) |
| Field | field name |
| Target RA | target RA (J2000, hhmmss.) |
| Target DEC | target DEC (J2000, ddmmss.) |
| ROR | ROR number (e.g. 200005) |
| Sequence | observation sequence id (e.g. rh200005a00) |
| Start obs date | start observation date (ddmmyy) |
| Start obs time | start observation time (hh:mm:ss.) |
| End obs date | end observation date |
| End obs time | end observation time |
| Exposure | exposure live time (seconds) |
| Map exposure | exposure from the exposure map (seconds) |
| Num reb1 | number of sources detected at reb=1 |
| Num reb3 | number of sources detected at reb=3 |
| Num reb6 | number of sources detected at reb=6 |
| Num reb10 | number of sources detected at reb=10 |
| SNR | signal-to-noise ratio for detection |
| Wavelet SNR | signal-to-noise ratio in the wavelet space |
| Probability | probability for detection |
| Count rate | estimate of net count rate (CR, count s-1) |
| Fit CR error | count rate error from the fit procedure (count s-1) |
| Stat CR error | count rate error from statistics (count s-1) |
| CR error | count rate error (maximum between fit CR error and stat CR error) |
| Total counts | total counts detected (CR by exposure) |
| Vignetting | vignetting correction |
| PSF | PSF correction |
| Counted CR | source CR from the counting procedure |
| Counted CR error | source counted CR error |
| Background | background count rate |
| Near sources | number of sources within 2 sigma from the detected source |
| Nh | weighted average nH (cm-2) |
| Conversion Factor1 (CF1) | conversion factor from null column density (erg cm-2 count-1) |
| Fx1 | HRI X–ray flux from CF1 |
| Conversion Factor1 (CF2) | conversion factor from full column density (erg cm-2 count-1) |
| Fx2 | HRI X–ray flux from CF2 |
| Extension | sigma source in original pixels (arcsec) |
| Extension error | sigma source error |
| Flag sigma | fixed sigma? (Y/N) |
| Flag extended | extended sources? (POINT/EXTENDED) |
| Extension significativity | significativity of the extension |
| Fit | from the fit procedure |
| Cat version | catalogue version |
| SASS version | version of the SASS processing system |
| FIRST Parameter | Description |
|---|---|
| FIRST name | FIRST source name (e.g. 1103038071E) |
| RA | FIRST source RA (J2000, degrees) |
| DEC | FIRST source DEC (J2000, degrees) |
| W | warning flag for sidelobe source |
| Pflux | peak flux density (mJy) |
| Iflux | integrated flux density (mJy) |
| Rms | local noise at the source position (mJy) |
| Maj | major axis after deconvolution (FWHM in arcsec; elliptical Gaussian model) |
| Min | minor axis after deconvolution (in arcsec) |
| PA | position angle after deconvolution (in arcsec; degrees east of north) |
| fMaj | measured major axis (arcsec) |
| fMin | measured minor axis (arcsec) |
| fPA | measured position angle (arcsec) |
| FIRSTBMW | angular distance between FIRST and X–ray position (arcsec) |
| FIRST comp | number of FIRST cross-correlations |
| BMWFIRST version | BMW-FIRST cross-correlation version |
| IRASPSC Parameter | Description |
|---|---|
| IRASPSC name | source IRASPSC name (e.g. 18352+3844) |
| RA | IRASPSC RA source (J2000, degrees) |
| DEC | IRASPSC DEC source (J2000, degrees) |
| F12 | 12 micron flux (mJy) |
| F25 | 25 micron flux (mJy) |
| F60 | 60 micron flux (mJy) |
| F100 | 100 micron flux (mJy) |
| IRASPSCBMW | angular distance between IRAS and X–ray position (arcsec) |
| IRASPSC comp | number of IRASPSC cross-correlations |
| IRASPSC version | BMW-IRASPSC cross-correlation version |
| 2MASS Parameter | Description |
|---|---|
| RA | 2MASS RA source (J2000, degrees) |
| DEC | 2MASS DEC source (J2000, degrees) |
| Jmag | 2MASS J magnitude |
| Jmag error | 2MASS J magnitude error |
| Hmag | 2MASS H magnitude |
| Hmag error | 2MASS H magnitude error |
| Kmag | 2MASS K magnitude |
| Kmag error | 2MASS K magnitude error |
| 2MASSBMW | angular distance between 2MASS and X–ray position (arcsec) |
| 2MASS comp | number of 2MASS cross-correlations |
| BMW2MASS version | BMW-2MASS cross-correlation version |
| GSC2 Parameter | Description |
|---|---|
| GSC2 name | GSC2 source name (e.g. N2320203180) |
| RA | GSC2 source RA (J2000, degrees) |
| DEC | GSC2 source DEC (J2000, degrees) |
| RA error | source RA error (degrees) |
| DEC error | source DEC error (degrees) |
| GSC2 epoch | GSC2 epoch (e.g. 1991.329956) |
| raPM | RA proper motion (mas yr-1) |
| decPM | DEC proper motion (mas yr-1) |
| raPMerr | RA proper motion error (mas yr-1) |
| decPMerr | DEC proper motion error (mas yr-1) |
| Fmag | F magnitude |
| Fmag error | F magnitude error |
| Jmag | J magnitude |
| Jmag error | J magnitude error |
| Vmag | V magnitude |
| Vmag error | V magnitude error |
| Nmag | N magnitude |
| Nmag error | N magnitude error |
| a | semi-major axis |
| e | eccentricity |
| PA | position angle (arcsec) |
| c | class code (0=star,1=galaxy,2=blend,3=non-star,4=unclassified,5=defect) |
| GSC2BMW | angular distance between GSC2 and X–ray position (arcsec) |
| GSC2 comp | number of GSC2 cross-correlations |
| BMWGSC2 version | BMW-GSC2 cross-correlation version |
References
- (1)
- (2) Becker, R. H., White, R. L., & Helfand, D. J., 1995, ApJ, 450, 559.
- (3) Beichman, C.A., et al., 1988, Infrared Astronomical Satellite (IRAS) Catalogs and Atlases, vol. 1, Explanatory Supplement, NASA RP-1190 (Washington, DC: GPO).
- (4) Campana, S., Lazzati, D., Panzera, M.R., Tagliaferri, G., 1999, ApJ, 524, 423.
- (5) David, L.P., et al., 1998, The ROSAT HRI Calibration Report, U.S. ROSAT Science Data Center (SAO).
- (6) Dickey, J.M., Lockman, F.J., 1990, ARA&A, 28, 215.
- (7) Gioia, I. M., Maccacaro, T., Schild, R.E., et al., 1990, ApJS, 72, 567.
- (8) Giommi, P., Tagliaferri, G., Beuermann, K., et al., 1991, ApJ, 378, 77.
- (9) Gotthelf, E.V., & White, N.E., 1997, in “International Symposium on X–ray Astronomy ASCA Third Anniversary”, F. Makino and K. Mitsuda (Eds.), p.31.
- (10) Guzzo, L., et al., 2002-in preparation.
- (11) Hasinger, G., et al., 1998, A&A, 329, 482.
- (12) Høg, E., Fabricius, C., Makarov, V. V., et al., 2000, A&A, 357, 367.
- (13) Lazzati, D., Campana, S., Rosati., P., et al., 1998, A&A, 331, 41.
- (14) Lazzati, D., Campana, S., Rosati., P., et al., 1999, ApJ, 524, 414.
- (15) B., McLean, et al., 2002-in preparation.
- (16) Moretti, A., et al., 2002-in preparation.
- (17) Pavlov, G. G., Zavlin, V. E., Aschenbach, B., et al., 2000, ApJ, L53.
- (18) Perryman, M.A.C., Lindegren, L., Kovalevsky, J., et al., 1997, A&A, 323, L49.
- (19) Pfeffermann, E., et al., 1986, Proc. SPIE, 773, 519.
- (20) Prestwich, A., Callanan, P., Snowden, S., et al., 1996, AAS, 189, 905.
- (21) ROSAT Scientific Team, 2001, ROSAT NEWS No.74.
- (22) Rosati, P., Della Ceca, R., Burg, R., et al., 1995, ApJ, 445, L11.
- (23) Snowden, S.L., 1994, Cookbook for analysis procedures for ROSAT XRT/PSPC observations of extended objects and diffuse background.
- (24) Trümper, J., et al., 1991, Nature, 349, 579.
- (25) Voges, W., Aschenbach, B., Boller, Th., et al., 1999, A&A, 349, 389.
- (26) White, N.E., Giommi, P., & Angelini, L., 1994, IAU Circ. 6100.
- (27) White, R. L., Becker, R. H., Helfand, D. J., & Gregg, M. D., 1997, AJ, 475, 479.
- (28) Zimmermann, H.U., 1994, IAU Circ. 6102.
- (29) Zombeck, M.V., Conroy, M., Harnden, F.R., et al.,1990, in Proc. SPIE Conf. EUV, X–Ray, and Gamma–ray Instrumentation for Astronomy, Calibration of the ROSAT High Resolution Imager, 1344, 267.