Abstract
The kinematics of jets in active galactic nuclei (QSOs, BL Lacs, Radio Galaxies and Empty Field objects) on parsec scales is being studied with Very Long Baseline Array (VLBA) observations at 15 GHz of a sample of more than 170 radio sources. More than 1000 images have been taken since 1994. Here we present an overview of the results of our study, including the proper motions of components in the jets, and their relationship with other source properties.
[The VLBA 2cm Survey]THE VLBA 2cm SURVEY:
KINEMATICS OF pc-SCALE STRUCTURES IN ACTIVE GALACTIC
NUCLEI
Introduction
The emission at radio frequencies from active galactic nuclei (AGN) usually presents the form of collimated “jets” which connect a compact central region (the “engine” of the AGN) with kiloparsec-scale extended lobes and hot spots. The technique of Very Long Baseline Interferometry (VLBI) is the standard tool to study the compact structure of these jets at parsec scales, which corresponds to resolutions of the order of 1 milliarcsecond. Relativistic motion oriented nearly along the line of sight causes an aparent superluminal motion due to the compression of the time frame. There have been different surveys to study the nature of AGN physics. Those studies include VLBI observations at cm and mm-wavelengths, single-dish radio flux monitoring, and observations in the optical, X-ray and -ray. To complement those, we have embarked on the project of monitoring a sample of radio sources with the VLBA at a 2 cm wavelength, which offers a good compromise between the detection of the extended jet features (fainter at higher frequencies because of their optically thin spectrum) and better insight close to the jet “core” (opacity1 region) at a relatively high frequency.
The Survey
Our program consists in monitoring more than 170 radio sources using the VLBA at 15 GHz. We have been observing since late 1994, with more than 40 VLBA runs. With typically 24 images per run, we have over 1000 images to date. The final goal of our research is the characterization of the kinematics of AGN jets and their relationship to other source properties. The definition of the sample and contour maps of each source are given in Kellermann et al. (1998) and Zensus et al. (2002). Overall, 60% of the observed AGN are QSOs, a 20% are BL Lac Objects, and less than a 15% are Radio Galaxies.
Each image of the survey is derived from an observation covering 8 hr of hour angle with a total of 50 min integration time per source at each epoch. The root-mean-square noise level in the images is less than 1 mJy beam-1. Consequently, the dynamic ranges reached are 1:1000, which is enough to measure the kinematics of the objects. The synthesized beam of the VLBA at 15 GHz is typically of 0.5 milliarcseconds (mas) in size. Automatic imaging was carried out in general (applying loops of clean and phase self-calibration) using the difmap software.
An online archive with the results of the survey is available under http://www.nrao.edu/2cmsurvey.
We measured the positions of the absolute and relative peaks of brightness using the task jmfit in . We cross-identified the components between different epochs and with this database we have determined the component motions for more than 100 sources in our sample extending over a time baseline of 4 to 6 years. We have studied particular sources in more detail, such as NGC 1052 (0238084; Vermeulen et al. 2002) or 4C +12.50 (1345+125; Lister et al. 2002).
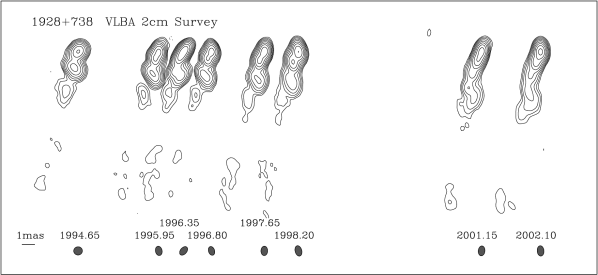
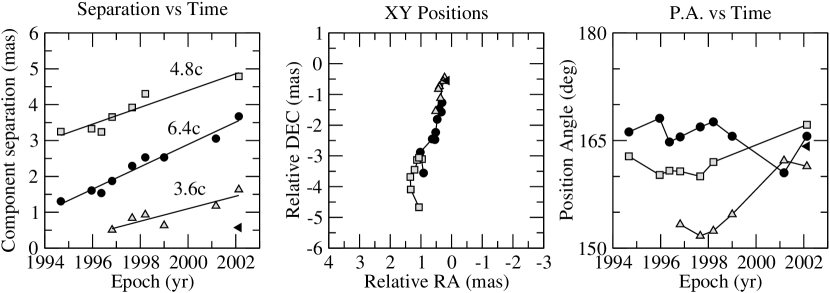
An Example: 1928+738
As an example of our analysis, we show in Fig. 1 the results on the QSO 1928+738 (4C 73.18) from our image database, based on 8 epochs of observations. The images in the top panel have been aligned relative to the brightness peak, although it is known from astrometric results (see Ros et al. 1999 and references therein) that the central engine is somewhere to the north of the brightest component at frequencies lower than 15 GHz. The bottom panels show the estimated positions of the relative peaks of brightness in the images with respect to the main one (associated tentatively with the core). The kinematical analysis based on the procedure described above shows that the components move southwards with superluminal speeds in slightly curved trajectories.
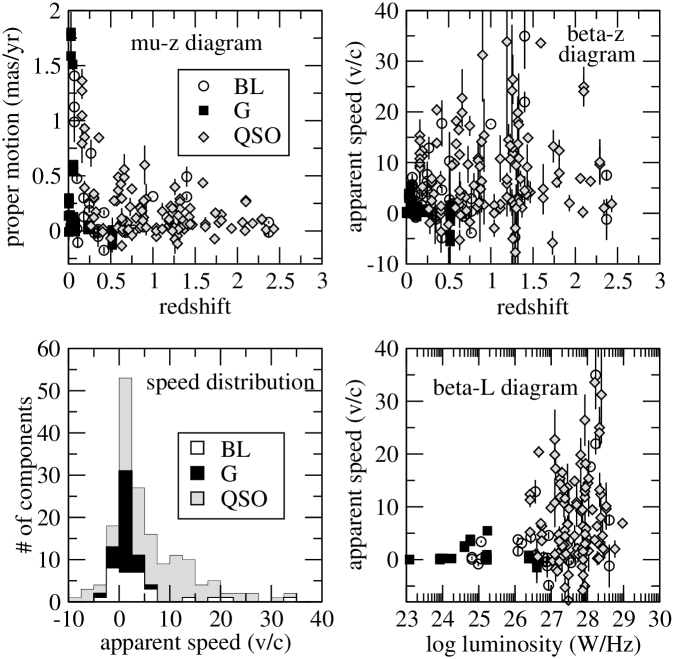
Statistics and kinematics
A detailed description of the kinematic analysis on the radio sources will be given in Kellermann et al. (in preparation), but we give some preliminary conclusions here. In general, radio galaxies have subluminal proper motions, and QSOs have faster motions in mean than BL Lac objects. Notice also that the BL Lac objects have generally lower redshifts. From the bottom, right panel, a correlation between luminosity and apparent jet speed is evident. Especially remarkable is the lack of high velocity jets with low luminosities. See Lister et al. (2003) for a discussion on this subject.
MOJAVE
We are extending now our program in a long-term project named MOJAVE (MOnitoring of Jets in Agn with Vlba Experiments). The observations were begun in August 2002. This observational effort includes also linear and circular polarization studies of the AGN.
Acknowledgments
This paper is based on work done in collaboration with M.H. Cohen, D.C. Homan, M.L. Lister, M. Kadler, K.I. Kellermann, R.C. Vermeulen, and J.A. Zensus. The Very Long Baseline Array of the USA National Radio Astronomy Observatory is operated by Associated Universities, Inc., under cooperative agreement with the USA National Science Foundation.
¡widest bib entry¿
References
- [kel02] Kellermann, K.I. et al. AJ, 115, 1295 (1998)
- [lis02] Lister, M.L. et al. ApJ, in press (2002) (astro-ph/0210372)
- [lis03] Lister, M.L. et al. in Active Galactic Nuclei: from Central Engine to Host Galaxies, Collin, S., Combes, F., Shlosman, I. (eds.), ASP Conference Series, in press (2003)
- [ros99] Ros, E. et al. A&A, 348, 381 (1999)
- [ver02] Vermeulen, R.C. et al. A&A, submitted (2002)
- [zen02] Zensus, J.A. et al. AJ, 124, 662 (2002)