11email: wim.vandriel@obspm.fr, veronique.cayatte@obspm.fr, chantal.balkowski@obspm.fr 22institutetext: Arecibo Observatory, HC3 Box 53995, Arecibo, Puerto Rico 00612, U.S.A.
22email: koneil@naic.edu, hhernand@naic.edu 33institutetext: CNRS URA 2052 and CEA,DSM,DAPNIA, Service d’astrophysique, Centre d’Etudes de Saclay, F-91911 Gif sur Yvette cedex, France
33email: paduc@cea.fr 44institutetext: Department of Astronomy, University of Minnesota, Minneapolis, U.S.A.
44email: john@astro.umn.edu 55institutetext: Laboratoire d’Astrophysique de Marseille, Traverse du Siphon - Les Trois Lucs, F-13376 Marseille, France
55email: jorge.iglesias@oamp.fr 66institutetext: Universitäts-Sternwarte, Geismarlandstrasse 11, 37083 Göttingen, Germany
66email: papade@uni-sw.gwdg.de 77institutetext: Instituto de Astrofísica de Andalucía (CSIC), Granada, Spain
77email: jvm@iaa.es 88institutetext: Astronomy Department, University of Virginia, Charlottesville, VA 22903, U.S.A.
88email: txt@astro.virginia.edu
Non-confirmation of reported HI clouds without optical counterparts in the Hercules Cluster
21 cm H i line observations were made with the Arecibo Gregorian telescope of 9 H i clouds in the Hercules Cluster which were reported as tenative detections in a VLA H i study of the cluster (Dickey 1997) and for which our deep CCD imaging failed to find any optical counterparts. No sensitive observations could be made of one of these (sw-174) due to the presence of a close-by strong continuum source. The other 8 tentative H i detections were not confirmed by the Arecibo H i measurements. The CCD images did reveal faint, low surface brightness counterparts near the centres of two other VLA H i sources invisible on the Palomar Sky Survey, sw-103 and sw-194.
Key Words.:
Galaxies: clusters: general Galaxies: clusters: individual: Hercules Cluster; Galaxies: ISM; Radio lines: galaxies;1 Introduction
Intergalactic H i clouds have been found to be extremely rare, although they were searched for rather intensively in the 21 cm line over the years, in the field as well as in environments with higher galaxy density, using both pointed and “blind” surveys (see Briggs 1990 for a summary of the surveys made until 1989 and, e.g., Spitzak & Schneider 1998; Kraan-Korteweg et al. 1999; Zwaan 2001). Their space density was quantified by Briggs (1990) as less than 1% of that of galaxies in the H i mass range of about 108 to 10 , based on data available at the time, while Zwaan (2001) estimated that in groups of galaxies their total H i mass is less than 10% of the total H i mass of the group.
Furthermore, almost all of the claimed cases turned out to have optical counterparts, e.g., the ‘isolated’ cloud H i 1225+01 discovered at Arecibo by Giovanelli & Haynes (1989), which was later found to be associated with a blue dwarf galaxy (Djorgovski 1991; Salzer et al. 1992). On the other hand, the large intergalactic cloud discovered at Arecibo by Schneider et al. (1983) in the Leo group has a ring shape typical of tidal features and may well have been tidally stripped from one of the galaxies in its vicinity. An example of such a tidal cloud without an optical counterpart can also be found in the Local Group: the Magellanic Stream. A new H i cloud without an optical counterpart found by Kilborn et al. (2000) could have been ejected from the interacting Magellanic Cloud - Galaxy system, and clouds once thought to be in the Sculptor group (Mathewson et al. 1975) were later shown to be part of the Magellanic Stream (Haynes & Roberts 1979). Although in the Hydra cluster we confirmed (Duc et al. 1999) the VLA H i source H1032-2819, for which we did not find an optical counterpart in CCD images, it might be the result of an interaction between two cluster galaxies. In a VLA survey of the Coma cluster (Bravo-Alfaro et al. 2000, 2001) two H i clouds without optical counterparts on the DSS were found with an of 1 and 4 108 , respectively.
In a 21 cm H i line survey of the Hercules Cluster carried out with the VLA by Dickey (1997, hereafter D97) the tentative detection was reported of 12 H i clouds without optical counterparts on digitised Palomar Sky Survey (DSS) images - throughout this paper we will use the designations of H i detections from D97: ce-70, ce-86, ce-102, ce-137, ce-224, sw-89, sw-103, sw-146, sw-174, sw-194, sw-201 and 47-52. Three of these (ce086, sw-103 and sw-194) will not be discussed in the present paper, for reasons explained below.
At the positions of two of these H i detections invisible on the DSS, sw-103 and sw-194, faint optical counterparts were detected in the deeper , and -band CCD images we obtained of all reported H i clouds, except 47-52 (Duc et al. 2001; Iglesias-Páramo et al. 2002, hereafter IP02). Although we could not obtain optical redshifts of sw-103 and sw-194 they are the only galaxies seen within the H i clouds and their optical centre positions are only 4′′ to 11′′ (one fourth and half the VLA HPBW, respectively) away from that of the H i cloud centres. We therefore regard them as tentative optical detections of these two H i clouds.
Given our non-confirmation at Arecibo of the reported H i clouds, it should be noted that we did clearly confirm the D97 VLA H i line signal from, e.g., sw-103, which is as weak as the faintest reported VLA H i cloud profiles, during the same observing run at Arecibo (IP02).
A third H i cloud, ce-86, although it shows a strong line in the VLA survey and remained undetected on our CCD images, is clearly part of the extended H i distribution of the peculiar galaxy IC 1182, and it therefore cannot be grouped together with the other clouds. Our Arecibo and optical observations of these three objects are discussed in IP02.
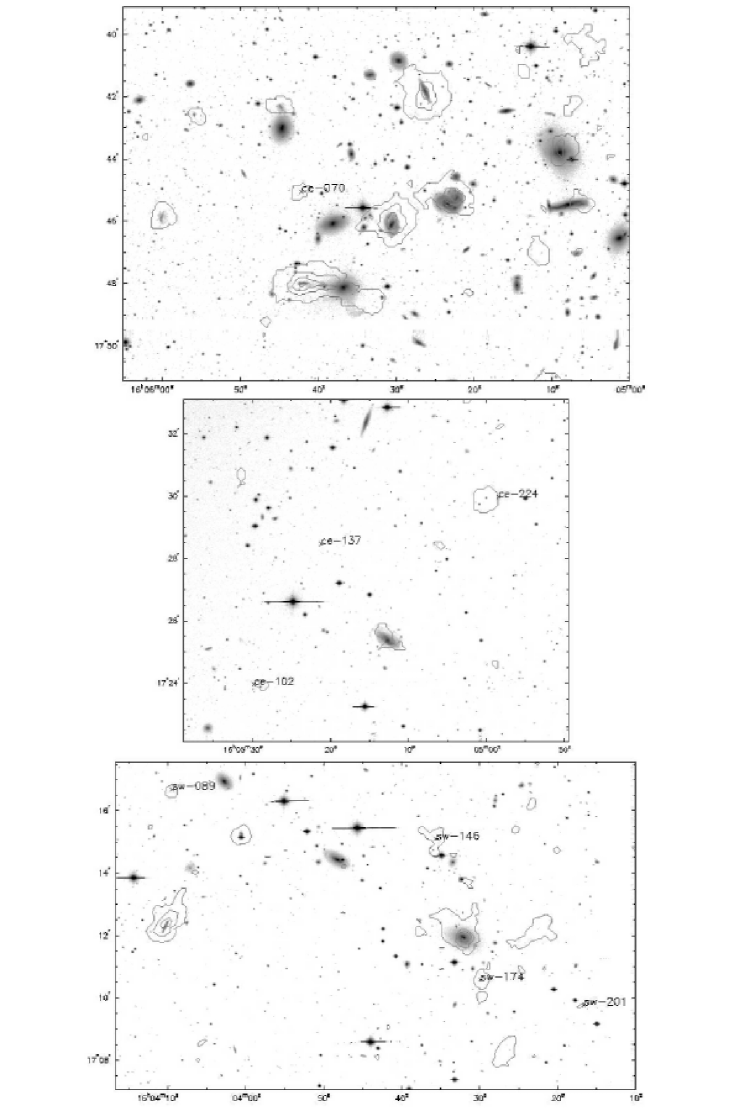
We failed to detect any optical emission from the remaining 8 H i clouds covered by our images (47-52 was not observed) to a limiting V-band surface brightness of about 27 mag arcsec-2. For a contour plot of the D97 VLA H i column density maps superimposed on the V-band images of IP02, showing all of the H i clouds under consideration in the present Paper, except 47-52, see Figure 1.
The present paper concerns the H i line observations we made at Arecibo, the only other radiotelescope with the sensitivity required for checking the reality of the tentative D97 H i detections without optical counterparts. The Arecibo observations are described in Section 2, and their results in Section 3. In Section 4 the results are discussed and the conclusions presented.
2 Observations and data reduction
We made our observations with the refurbished 305 m Arecibo Gregorian radio telescope in May and June 2002. Data were taken with the L-Band Narrow receiver (circularly polarized at 1415 MHz), using nine-level sampling with two of the 2048 lag sub-correlators set to polarization A and two to polarization B. All observations were taken in the position-switching mode, with the off-source observation taken for the same length of time and over the same portion of the Arecibo dish as the on-source observations. Each on+off pair was followed by a 10 seconds on+off observation of a noise diode calibration source. In principle, each scan consisted of a 5 minute on/off pair. The total net integration time (on+off) was on average 90 minutes per source, the maximum being 140 minutes for the faintest reported VLA source, sw-089, and the minimum 40 for sw-174, where a nearby strong continuum source made sensitive observations impossible. Each cloud was observed with each of the 4 sub-correlators centered at its redshifted H i line frequency. Two of the sub-correlators, one per polarization, were set to a 12.5 MHz bandpass, resulting in a velocity coverage of about 2500 km/s and a velocity resolution of 1.3 km/s, while the other two were set to a 3.25 MHz bandpass. The telescope’s HPBW at 21 cm is . For the telescope’s pointing positions the centre coordinates of the VLA H i sources as given in D97 were used (see Table 1). For calibration purposes, a number of strong continuum sources as well as spiral galaxies with strong H i lines from the catalogue of Lewis (1983) were observed throughout the run.
The observations were made at a mean frequency of 1368 MHz, in the 1350-1400 MHz frequency band allocated on a co-primary basis to the Radio Astronomy Service, where its protection from harmful interference is limited. Though care was taken to make the renovated Arecibo telescope more robust against radio frequency interference (RFI), and to coordinate its operation as well as possible with the frequency plan and emission periods of local radar installations, RFI signals with strengths that hamper the detection of faint H i line signals were present during the first half of the observations. After the main terrestrial RFI source was identified halfway through the observing run, a blanker could be implemented that effectively removed these signals from our spectra.
The data were reduced using IDL routines developed at Arecibo Observatory. The two polarizations were averaged and corrections were applied for the variation in gain and system temperature of the telescope as function of azimuth and zenith angle, using the most recent calibration data available. A first-order baseline was then fitted to the data, excluding those velocity ranges with H i line emission or RFI. Once the baselines were subtracted, the velocities were corrected to the heliocentric system, using the optical convention. All data were boxcar smoothed to a velocity resolution of 19.5 km s-1 for further analysis. If the average of all data on an object contained a signal with a peak level exceeding 1 mJy, it was checked if that feature corresponded to RFI signals that did not occur in all spectra - if so, the contaminated spectra were not used for the final analysis. The rms noise levels of the averaged spectra were determined in channels 300-1800, avoiding lines with a maximum exceeding about 1 mJy peak line flux density.
3 Results
The Arecibo H i line spectra of 8 tentative H i clouds, smoothed to a resolution of 19.5 km s-1 are shown in Figure 2. The exception is sw-174 (at 16h03m30s, 17∘10′34′′ (J2000.0) - see Figure 1), for which no sensitive H i observations could be obtained due to the proximity, at separation, of the elliptical galaxy NGC 6034 with its extended, 713 mJy continuum source.
| Table 1. Reported tentative H i clouds without optical counterparts – basic 21cm line data. | ||||||||||||
| —————————————————— VLA data —————————————————— | Are. | |||||||||||
| Name | R.A. | Dec. | rms | rms | ||||||||
| (2000.0) | [km/s] | [km/s] | ———— [Jy km s-1] ———— | [mJy] | [mJy] | [mJy/beam] | [mJy] | |||||
| ce-70 | 16 05 42.2 | 17 45 03 | 11654 | 396 | 0.25 | 0.53 | 0.19 | 1.22 | 1.0 | 1.35 | 0.17 | 0.29 |
| ce-102 | 16 05 29.8 | 17 23 57 | 11300 | 485 | 0.69 | 1.28 | 0.59 | 1.75 | 2.0 | 2.64 | 0.48 | 0.48 |
| ce-137 | 16 05 21.5 | 17 28 27 | 11625 | 351 | 0.36 | 0.92 | 0.37 | 0.34 | 1.5 | 2.63 | 0.30 | 0.39 |
| ce-224 | 16 04 58.5 | 17 29 58 | 11941: | 171: | 0.21: | 0.52: | 0.14: | 4.71: | 1.4 : | 5.85: | 0.25 | 0.39 |
| sw-089 | 16 04 09.5 | 17 16 41 | 11374 | 528 | 0.29 | 0.41 | 0.22 | 0.32 | 0.8 | 0.78 | 0.15 | 0.25 |
| sw-146 | 16 03 35.6 | 17 15 05 | 10424 | 395 | 0.30 | 0.56 | 0.12 | O.17 | 1.1 | 1.43 | 0.15 | 0.44 |
| sw-201 | 16 03 16.6 | 17 09 46 | 10711 | 484 | 0.44 | 0.71 | 0.17 | 0.11 | 1.3 | 1.47 | 0.18 | 0.31 |
| 47-52 | 16 03 16.2 | 16 14 21 | 10136 | 305 | 0.63 | 0.74 | 1.04 | 0.42 | 2.5 | 2.43 | 0.58 | 0.38 |
Global H i properties of the 8 observed clouds for which proper line spectra could be obtained at Arecibo are listed in Table 1. Most data listed are taken from, or based on, the D97 VLA observations. These data have a synthesized beam size (HPBW) varying from 20′′21′′ to 26′′29′′, a velocity resolution of 88.4 km s-1 after Hanning smoothing and an rms noise of about 0.13 mJy/beam per channel map at the field centre, which has been multiplied by the primary beam attenuation factor to indicate the actual rms noise levels at the location of each reported H i cloud in Table 1. With a pixel size of 6′′6′′, there are about 24 pixels per synthesized beam. All radial velocities are heliocentric and calculated according to the conventional optical definition, (-)/.
Unless otherwise indicated, the following values were derived from the line profiles shown in Figs. 9-12 in D97 and plotted here in Fig. 2, which correspond to the integrated line flux: Listed in the 12 columns of Table 1 are: (1) the working designation of the cloud from D97, (2 & 3) the Right Ascension and Declination of the cloud’s centre position, (4) the central velocity of the VLA line profile, (5) the FWHM of the profile, , (6)-(9) four different measures of the integrated H i line flux (, , and) , see the description below, (10) the maximum flux density in the profile corresponding to , , and (11) the mean flux density, , defined as /, which can be larger than (see below). Also listed, in column 12, is the rms noise level of the Arecibo spectra measured at a velocity resolution of 19.5 km s-1.

[h]
Four different methods used for measuring integrated H i line fluxes from interferometric H i line observations (listed in columns 8-11 of Table 1) lead to the four different H i masses listed in Table 2 of D97. We converted these H i masses to the integrated H i line fluxes of Table 1 assuming a distance of 110.5 h-1 Mpc for the Hercules Cluster, following D97. The characteristics of these methods are as follows: is the line flux measured by integrating the spectra over the group of contiguous pixels above threshold, is the line flux integrated over a larger area, estimated by statistical tests to contain the total line emission, while and are obtained by fitting a two-dimensional Gaussian to the velocity-integrated H i column density map, where corresponds to the line flux within the central beam area and to the integrated flux of the Gaussian. The latter is notoriously unstable, as can be seen by comparing the various line fluxes listed in Table 1.
3.1 Notes on individual H I clouds
Our observations of the H i cloud ce-86 is discussed in IP02, as part of our Arecibo H i and optical search for dwarf galaxies in the Hercules Cluster, since this cloud belongs to the extended H i distribution connected to the peculiar galaxy IC 1182 (see Figure 1). It seems to be the counterpart of the tidal dwarf galaxy ce-61 on the opposite side of IC 1182, whose dynamical nature as a gravitationally bound system inside the tidal tail of the merger system has been confirmed recently through H line Fabry-Pérot imaging (Duc & Amram 2003; see also IP02 and Braine et al. 2001).
A search was made for H i signals that could possibly lead to confusion with the Arecibo spectrum of a target object, using the D97 VLA maps, within a 10′ radius around each pointing position. Recent measurements of the Arecibo antenna beam pattern, including sidelobes, were used to estimate which percentage of the line flux of nearby objects would be detected.
ce-70: The VLA detection is a bit tentative, as it is not very strong and there are only 14 pixels above the detection threshold (D97). No confusion from nearby galaxies is expected within the velocity range covered by the D97 H i profile of this cloud. The two 0.8 mJy peaks seen in the 11,050-11,350 km s-1 range are probably due to a number of galaxies at about 3′-6′ distance, which all have redshifts between 11,100-11,189 km s-1: ce-48, 60, 95 and 109.
ce-102: The VLA detection is very tentative: though the line is not weak, there are only 13 pixels above the detection threshold and the emission is weakened by a factor 3.7 due to primary beam attenuation (D97). No nearby galaxy is expected to cause confusion within the D97 H i profile of this cloud. There is no obvious candidate for the 1.3 mJy peak at 10,600 km s-1 in the Arecibo data.
ce-137: The VLA detection is tentative, as the line is weak, there are only 17 pixels above the detection threshold and the emission is weakened by a factor 2.3 due to primary beam attenuation (D97). The H i source ce-155, at separation, could, in principle, be a source of confusion with the profile of this H i cloud, as its VLA line parameters are = 11,620 km s-1, = 551 km s-1 and = 1.0 Jy km s-1 (D97). ce-155 is classified as a tentative detection in D97, however, for the same reasons as ce-137. There is no significant line signal detected at Arecibo within the range of the VLA profile of this H i cloud.
ce-224: Rather tentative VLA detection, as the bandpass ends at 12,000 km s-1, above which the spectrum becomes so noisy that it is impossible to say what it is doing (D97). The central VLA H i velocity of 11,941 km s-1 is therefore uncertain, as are all other profile parameters from D97, and it may be an underestimate - see Figure 2. Only slightly overlapping with the VLA profile of the H i cloud, the Arecibo spectrum shows a 1.2 mJy peak with = 11,849 km s-1, = 163 km s-1 and = 0.096 Jy km s-1, which the Arecibo sidelobe pattern at the time of our observations shows may possibly be due to Sc spiral ce-294, at separation, with VLA line parameters = 11,875 km s-1, = 306 km s-1 and = 0.81 Jy km s-1 (D97). There is no nearby galaxy in the VLA data that could have caused the 1.3 mJy peak around 10,700 km s-1 in the Arecibo data.
sw-089: The VLA detection is extremely tentative, as the line is weak and broad and there are only 5 pixels above the detection threshold (D97). There are no nearby galaxies expected to cause confusion with the D97 VLA profile of this H i cloud. The Arecibo data show two 0.7 mJy peaks with = 10,995 km s-1, = 129 km s-1 and = 0.067 Jy km s-1 which may well be due to galaxy ce-103, at separation, for which we measured = 10,998 km s-1, = 155 km s-1 and = 0.17 Jy km s-1 at Arecibo (IP02).
sw-146: Though a faint red image coincident with the H i cloud was noted on the DSS in D97, no galaxy was found at this location on our deeper CCD images (IP02). The VLA detection is somewhat suspect as the baseline is somewhat degraded due to the presence of the strong (713 mJy) continuum emission from nearby NGC 6034 (D97). In the velocity range of the VLA profile, the Arecibo spectrum shows a 1.5 mJy peak with = 10,451 km s-1, = 176 km s-1 and = 0.042 Jy km s-1. There are no nearby galaxies in the VLA data that could have caused this peak, nor the two 1.2 mJy peaks around 10,000 km s-1. We consider that the reported VLA cloud sw-146 has not been confirmed by the Arecibo data. This Arecibo spectrum has a less smooth baseline than the others and the peaks might be spurious and due to RFI.
sw-174: The strong (713 mJy), extended continuum source in the nearby galaxy NGC 6034 made sensitive Arecibo line observations impossible and the VLA detection tentative. The VLA profile is weak (0.7 mJy peak in the profile) and there are only 6 pixels above the detection threshold. The “line” could be a figment of imperfect bandpass calibration and continuum subtraction, as the continuum emission of NGC 6034 is sufficiently strong to increase the noise in the spectral baselines in its vicinity (D97).
sw-201: The VLA detection is very tentative, as there are only 6 pixels above the detection threshold (D97). There is no nearby galaxy that is expected to cause confusion with the VLA profile. The Arecibo data show 2.3 mJy peaks with = 10,088 km s-1, = 220 km s-1 and = 0.35 Jy km s-1, which appear due to nearby galaxy sw-222, at separation, for which we measured = 10,079 km s-1, = 215 km s-1 and = 0.76 Jy km s-1 at Arecibo (IP02).
47-52: The VLA detection is extremely tentative, as there are only 9 pixels above the detection threshold and the emission is weakened by a factor 4.4 due to primary beam attenuation (D97). There are no nearby galaxies expected to cause confusion with the D97 VLA profile. Further smoothing in velocity of our spectrum only boosts the narrow peak at 10,000 km s-1, but not the signal in the velocity range of the VLA profile.
4 Discussion and conclusions
Both single-dish and interferometric 21cm observations have their strong and weak points in determining integrated line profiles of small, weak extragalactic H i sources like the tentatively detected H i clouds we studied.
Although for a single-dish telescope like Arecibo observations result in only one spectrum per pointing position and the derivation of integrated H i profile parameters is straightforward, these profiles depend on the instrument’s beam pattern, which can lead to confusing detections of nearby objects (see Section 3.1), and single-dish data are more sensitive to RFI than interferometric data.
From interferometric data it is not straightforward to determine the integrated H i line flux, as pointed out in Section 3, hence the four different values listed for the VLA data in D97 (see Table 1): of the flux determinations, and can in principle be considered as lower limits, and and as upper limits. Together, they give an indication of the uncertainties involved. A comparison of the various VLA fluxes with our Arecibo fluxes for a sample of 20 small galaxies in the Hercules Cluster (from D97) shows (IP02) that the fluxes are a reasonable estimate for the integrated flux of weak H i line signals detected over a small area: for the galaxies, on average, is 0.70.3 (Arecibo) and is 1.00.5 . On average, the clouds’ fluxes are 1.90.5 times their VLA values.
Using the line fluxes and the widths of the profiles of the clouds, in the absence of published widths of their profiles, they have estimated average line flux densities, , varying between 0.8 and 5.8 mJy (mean 2.3 mJy). In comparison, the average rms noise level in our Arecibo data is 0.37 mJy at the used velocity resolution of 19.4 km s-1, which is considerably smaller than the 88.4 km s-1 of the VLA data. We statistically expect to obtain signal-to-noise ratios of 6.23.5 for signals of the level of . Thus, for 6 out of the 8 observed sources we would expect to obtain detections at Arecibo with a signal-to-noise ratio of at least 4.5 for a signal at the mean level of the H i line, while the remaining two have an expected ratio of about 3.2 for such a signal.
The reported VLA H i cloud signals were not confirmed at Arecibo, however, as shown by a comparison of the profiles (Figure 2). The non-confirmation would be even more evident if the plotted VLA profiles would be scaled by a factor of 1.9 in flux density (the average / line flux ratio).
On the other hand, VLA H i lines from a score of small galaxies in the Hercules Cluster, some of which are as weak as those of the H i clouds discussed here, were confirmed by us during the same Arecibo observing period (IP02). The two faintest confirmed detections are of ne-204 and sw-103, which have, for example, VLA of 0.9 and 0.85 mJy and of 1.2 and 0.9 mJy, respectively. A comparison with Table 1 shows that these flux densities are among the lowest values for the observed H i clouds. This also indicates that the confirmation of the reported clouds should have been feasible at Arecibo.
Surprisingly, the reported H i clouds have rather broad VLA profiles, with =390110 km s-1 on average - equivalent to the linewidth of a fairly massive, edge-on spiral galaxy. From the Arecibo data we would derive a 5 upper limit of 4 108 to the H i mass of a cloud in the Hercules Cluster with an assumed profile width of 75 km s-1.
Acknowledgements.
We would like to thank the staff of Arecibo Observatory for their help with the observations and data reduction, especially P. Perrillat, and the referee, S.E. Schneider, for his comments. We have made use of the NASA/IPAC Extragalactic Database (NED), which is operated by the Jet Propulsion Laboratory, California Institute of Technology, under contract with the National Aeronautics and Space Administration.References
- (1) Braine, J., Duc, P.-A., Lisenfeld, U., et al. 2001, A&A, 378, 51
- (2) Bravo-Alfaro, H., Cayatte, V., van Gorkom, J. H., & Balkowski, C. 2000, AJ, 119, 580
- (3) Bravo-Alfaro, H., Cayatte, V., van Gorkom, J. H., & Balkowski, C. 2001, A&A, 379, 347
- (4) Briggs, F. H. 1990, AJ, 100, 999
- (5) Dickey, J. 1997, AJ, 113, 1939 (D97)
- (6) Djorgovski, S. 1991, AJ, 99, 31
- (7) Duc, P. A., Balkowski, C., Cayatte, V., et al. 2001, in Dwarf Galaxies and their Environment, ed. K. de Boer, R.-J. Dettmar, & U. Klein (Shaker Verlag), 153
- (8) Duc, P.-A., Papaderos, P., Balkowski, C., et al. 1999, A&AS, 136, 539
- (9) Duc P.-A., & Amram P. 2003, A&A, in preparation
- (10) Giovanelli, R., & Haynes, M. P. 1989, ApJ, 346, L5
- (11) Haynes, M. P., & Roberts, M. S. 1979, ApJ, 227, 767
- (12) Iglesias-Páramo, J., Duc, P.-A., Papaderos, P., et al. 2002, A&A, submitted (IP02)
- (13) Kilborn, V. A., Staveley-Smith, L., Marquarding, M., et al., 2000, AJ, 120, 1342
- (14) Kraan-Korteweg, R., van Driel, W., Briggs, F., Binggeli, B., & Mostefaoi, T. 1999, A&AS, 135, 255
- (15) Lewis, B. M., 1983, AJ, 88, 962
- (16) Mathewson, D. S., Cleary, M. N., & Murray, J. D. 1975, ApJ, 195, L97
- (17) Salzer, J. J., di Serego Alighieri, S., Matteucci, F., Giovanelli, R., & Haynes, M. P. 1991, AJ, 101, 1258
- (18) Schneider, S. E., Helou, G., Salpeter, E. E., & Terzian, Y. 1983, ApJ, 273, L1
- (19) Spitzak, J. G., & Schneider, S. E. 1998, ApJS, 119, 159
- (20) Zwaan, M. 200X, MNRAS, xxx, xxx