Probing the structure of a birthplace of intermediate-mass stars: Ammonia cores in Lynds 1340
Lynds 1340, a molecular cloud forming intermediate-mass stars, has been mapped in the NH3(1,1) and (2,2) transitions with the Effelsberg 100-m telescope. We observed the whole area of the cloud where C18O emission was detected earlier, at a 40 grid, with additional positions towards the C18O peaks and optically invisible IRAS point sources. Our observations covered an area of 170 arcmin2, corresponding to about 5.15 pc2 at a distance of 600 pc, and revealed 10 ammonia cores. The cores, occupying some 7 % of the mapped area, probably represent the highest density regions of L 1340. Their total mass is 80 M☉, about 6 % of the mass traced by C18O. Six cores are associated with optically invisible IRAS point sources. Their average nonthermal line width is 0.78 km s-1, while the same quantity for the four starless cores is 0.28 km s-1. We suggest that the narrow-line cores are destined to form low-mass stars, whereas small groups of intermediate-mass stars are being formed in the turbulent cores. The features traced by NH3, 13CO, C18O and H i obey the line width–size relation . Comparison of sizes, densities and nonthermal line widths of ammonia cores with those of C18O and 13CO structures supports the scenario in which core formation has been induced by turbulent fragmentation. The typical physical properties of the NH3 cores of L 1340, =0.08 pc, =13.8 K, =0.64 km s-1, and =9 M☉ are close to those of the high-mass star forming Perseus and Orion B clouds.
Key Words.:
ISM: star formation – ISM: molecules – ISM: clouds – ISM: individual objects: L 1340 – stars: formation1 Introduction
Observations of nearby star forming regions have shown that high mass stars are born as members of dense clusters in massive molecular cloud cores, whereas small, cold cores give birth to one or a few solar type stars. The transition from isolated to clustered mode of star formation occurs in molecular clouds forming intermediate mass stars (Testi, Palla & Natta TPN (1999)). Molecular cores forming isolated low-mass stars and rich clusters differ from each other in structure, physical properties and evolution (e.g. Caselli & Myers CM (1995)). Observations of various star forming regions are helpful in getting an unbiased view on the physical processes leading to a particular mode of star formation. We studied the structure of Lynds 1340, a medium-mass molecular cloud in order to compare the properties of this HAe/Be star birthplace with well-studied star forming environments.
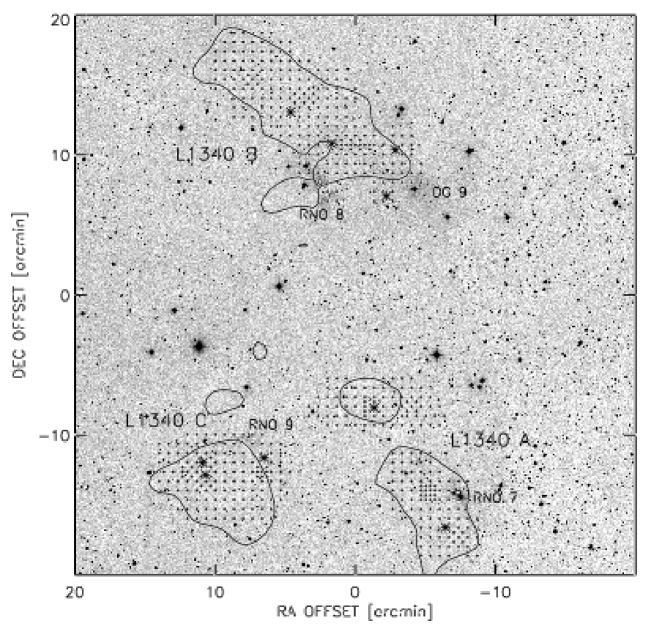
The star-forming molecular cloud Lynds 1340 is located in Cassiopeia, near (l,b)=(130,11), at a distance of 600 pc from the Sun (Kun et al. Paper1 (1994), hereafter Paper I). In optical images, the cloud is visible as the faint, blue reflection nebula DG 9 (Dorschner & Gürtler DG (1966)), which is illuminated by and type stars. RNO 7, 8 and 9 (Cohen RNO (1980)) associated with the cloud are probably signposts of recent star formation in L 1340.
Paper I presented 13CO and C18O maps of L 1340, obtained with the 4-m radio telescope of Nagoya University, its distance determination, and a list of candidate young stellar objects. The 13CO observations revealed a molecular mass of 1200 M☉, distributed in three clumps denoted as cores A, B and C, each associated with a number of IRAS point sources and H emission stars. Following the definition given by Blitz & Williams (BW (1999)), however, it is more appropriate to refer to these 13CO substructures as clumps, which may contain higher density cores.
Yonekura et al.’s (YDMOF (1997)) 13CO survey results have shown this cloud to be fairly isolated, instead of being a part of a giant molecular complex. They also pointed out that earlier Nagoya 13CO and C18O measurements calibrated with S140, including those presented in Paper I, should be revised due to the incorrect value of 6 K used for the 13CO radiation temperature of S140. (C18O measurements were calibrated assuming the same ratio for as that for the 13CO line.) Using the revised value of 9 K, column densities and volume densities derived from the optically thin C18O line can easily be corrected.
Recently, Kumar, Anandarao & Yu (KAY (2002)) found three optical HH objects, HH 487, 488, and 489, emerging from YSOs in L 1340 A. The same work also has shown that RNO 7 is a compact cluster of some 26 stars, and predicted a mass about 6 M☉ for its brightest member. Recent spectroscopic study of the illuminating stars of DG 9 and the candidate YSOs listed in Paper I suggests that L 1340 is a birthplace of small groups of low and intermediate mass stars (Kun 2002a ). No O-type stars have been formed in this cloud. Both its size and star forming properties represent an intermediate mode between the isolated low mass star formation and clustered high mass star formation. Adams & Myers (AM (2001)) proposed that probably a significant part of field stars have formed in small groups consisting of less than a hundred members. Studies of star forming regions like L 1340 therefore add important pieces of information to the star formation history of our Galaxy.
In order to find the distribution of high density gas closely related to star formation, and its connection to the observed signposts of recent star formation we observed the (1,1) and (2,2) inversion lines of ammonia in regions of the cloud which have shown high column densities in the C18O emission. The NH3(1,1) line is suitable for probing the density regimes around cm-3 (Harju, Walmsley & Wouterloot HWW (1993), hereafter HWW). These densities are high enough to shield the gas from interstellar UV radiation, and thus disconnect them from the magnetic fields. Ammonia cores are those regions of the molecular clouds, where the self-similar structure resulted from interstellar turbulence breaks down and star formation becomes possible.
In this paper we present the results of the ammonia observations. On one hand, we expect to get a better view of the structure of the highest density parts of L 1340, owing to the higher angular resolution of our observations than those presented in Paper I. Comparison of physical parameters derived from NH3, C18O and 13CO observations, on the other hand, may reveal a relationship between different density regimes of the molecular gas. The ammonia database by Jijina, Myers & Adams (JMA (1999), hereafter JMA) makes it possible to compare L 1340 with other star forming regions. A spectroscopic and photometric follow-up study of the candidate YSOs associated with the cloud will be published in a subsequent paper (Kun 2002b ).
We describe our ammonia observations in Sect. 2. The methods of our data analysis are presented in Sect. 3, and the results of observations in Sect. 4. In Sect. 5 we discuss the connection of ammonia cores with candidate YSOs and with their environment revealed by 13CO, C18O, H i and visual extinction. We also compare the dense cores of L 1340 with other star forming clouds. Sect. 6 gives a brief summary of our results. Appendices A and B briefly outline how the use of publicly available H i and star count data contribute to get a coherent picture of the cloud.
2 Observations
We mapped the (1,1) and (2,2) inversion transition lines of ammonia towards L 1340 using the 100-m radio telescope of MPIfR at Effelsberg in February and October 1997. The half-power beam width of the telescope at 23.7 GHz is 40, corresponding to 0.12 pc at the distance of L 1340. The facility 1.3 cm maser receiver was used with a typical system temperature of 90 K. The spectrometer was a 1024-channel autocorrelator split into two bands of 6.25 MHz in order to observe simultaneously at the frequencies of NH3(1,1) (23694.495 MHz) and NH3(2,2) (23722.633 MHz). The spectral resolution was 0.15 kms-1.
The mapping was done in total power mode with 3 ONs per OFF on a 40″ grid, with additional positions towards the C18O peaks and optically invisible IRAS point sources. The integration times were 3 minutes per position. We calibrated our measurements using continuum scans of NGC 7027 for which we adopted =8.2 K, corresponding to 5.86 Jy (Baars et al. BGPW (1977)). The pointing was checked each 2–3 hours on nearby continuum sources. Its accuracy was about 5. The typical rms noise in our spectra is 0.15 K ().
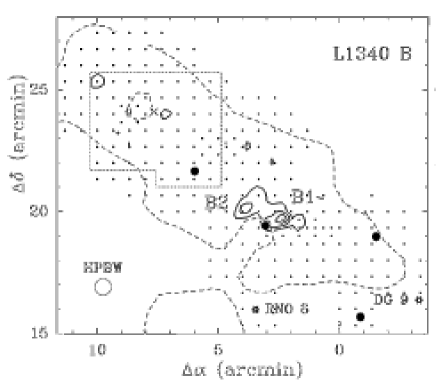
Our ammonia observations covered an area of 170 arcmin2, or 5.15 pc2 at a distance of 600 pc. Virtually the whole area was observed where (Paper I) was higher than about 0.45 K km s-1. Figure 1 shows the observed positions overlaid on the red optical image of L 1340 obtained from DSS-1111Based on photographic data of the National Geographic Society – Palomar Observatory Sky Survey (NGS-POSS) obtained using the Oschin Telescope on Palomar Mountain. The NGS-POSS was funded by a grant from the National Geographic Society to the California Institute of Technology. The plates were processed into the present compressed digital form with their permission. The Digitized Sky Survey was produced at the Space Telescope Science Institute under US Government grant NAG W-2166..
3 Data analysis
3.1 Physical properties of the ammonia gas
Our ammonia spectra were reduced and analysed using the CLASS software (Forveille et al. CLASS (1989)). We derived the physical parameters of the NH3 gas following the procedure described by HWW. During this procedure we took into account the beam filling factor. It was estimated from the half-maximum sizes of the structures in the integrated intensity maps (Figs. 3–5, Sect. 4) and the HPBW of the telescope using Martin’s & Barrett’s (MB (1978)) Eq. 7. We obtained average beam filling factor of 0.5, which value we used in the data analysis.
The rotational temperature can be determined from the (1,1) and (2,2) brightness temperatures (Ho & Townes HT (1983)). At most positions of L 1340, however, the (2,2) line was too weak (), therefore we averaged the (1,1) and (2,2) spectra for the regions around (1,1) maxima in order to enhance the S/N and determined from the averaged spectra, using Ho & Townes (HT (1983)) Eq. 4. The values were then transformed into kinetic temperatures according to Walmsley & Ungerechts (WU (1983)), using collisional rate coefficients given by Danby et al. (DFVSW (1988)).
The excitation temperature of the transition was determined where , the signal-to-noise ratio allowed us to fit the (1,1) spectra with the pattern of the hyperfine components. We obtained excitation temperatures of 5–6 K for these positions, therefore we assumed 6 K for the parts of the clouds where the S/N of the spectra was insufficient for the determination of .
The column density was computed using different assumptions depending on line intensities in accordance with the criteria given by HWW, and total ammonia column densities, (NH3), were derived using HWW’s Eq. 7.
3.2 Physical properties of ammonia cores
The distribution of NH3(1,1) integrated intensity shows several peaks, that define the positions of the dense cores of L 1340. We defined the ammonia cores as closed areas bordered by the lowest significant (3 =0.45 K km s-1) contours in the NH3(1,1) integrated intensity maps. Multiple peaks inside a closed contour are regarded as different cores if they are separated below the half-maximum contour. Table 1 shows the observed properties of the ammonia cores. The following quantities are listed: Column 1: the name of the core; Cols. 2–3: the offsets of the peak position of the integrated intensity in arcmin with respect to RA(2000)=2 and Dec(2000)=+72°43′222; Col. 4: the radial velocity obtained by fitting the NH3 hyperfine structure to the observed spectra, averaged for the points within the border of the core, and its standard deviation; Col. 5: the average line width of the clump and its dispersion; This quantity was derived from the NH3(1,1) fit to the mean spectra, obtained by averaging individual spectra within the 3 contour of the integrated intensity maps. was corrected for the spectral resolution. Col. 6: the full angular size of the core within the 3 contour of the integrated intensity map in arcsec, not corrected for the beam size. We obtained this information by approximating the contour with an ellipse; Col. 7: the angular distance of the nearest IRAS source from the ammonia peak in arcsec; Col. 8: the name and type of the nearest IRAS source. An ‘s’ following the IRAS name marks sources associated with visible stars, and ‘i’ is for optically invisible sources.
In this section we describe the methods used for deriving sizes, kinetic temperatures, hydrogen column densities, masses, and nonthermal velocity dispersions of ammonia cores. We estimate their stabilities, and define their connection to IRAS point sources.
| Core | RA offset | D offset | Ang. size | d(*) | Nearest | ||
|---|---|---|---|---|---|---|---|
| (′) | (′) | (km s-1) | (km s-1) | () | IRAS source | ||
| A1 | 6.00 | 8.33 | 14.13 (0.03) | 0.64 (0.06) | 14060 | 60 | 02238+7222 i |
| A2 | 4.00 | 5.33 | 14.35 (0.03) | 0.36 (0.04) | 8020 | ||
| A3 | 2.33 | 0.00 | 14.56 (0.01) | 0.28 (0.02) | 7060 | ||
| A4 | 0.33 | 0.33 | 13.75 (0.30) | 0.99 (0.08) | 9060 | 10 | 02249+7230 i |
| B1 | 2.33 | 19.67 | 14.37 (0.15) | 0.63 (0.03) | 8570 | 40 | F02256+7249 i |
| B2 | 4.00 | 20.00 | 14.67 (0.03) | 0.29 (0.05) | 9040 | 68 | |
| C1 | 8.33 | 4.33 | 14.63 (0.09) | 0.67 (0.04) | 10070 | 80 | 02267+7226 i |
| C2 | 12.33 | 3.00 | 15.89 (0.14) | 0.84 (0.04) | 8070 | 20 | F02277+7226 i |
| C3w | 12.67 | 4.67 | 15.71 (0.36) | 0.97 (0.05) | 10060 | 50 | 02276+7225 i |
| C3e | 13.67 | 4.00 | 15.92 (0.10) | 0.40 (0.03) | 8050 | 40 | F02279+7225 s |
The half-maximum radii of the cores, corrected for the angular resolution of the observations were derived as , where was the area of the core within the half-maximum contour of the integrated intensity maps.
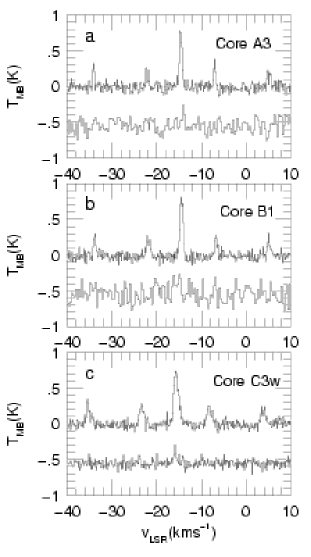
In order to determine the mean kinetic temperatures of the cores we averaged the (1,1) and (2,2) spectra over the positions within the lowest significant integrated intensity contours. The resulting spectra, due to their higher S/N made it possible to measure the integrated intensity of the (2,2) lines. Figure 2 shows the average spectra for cores A3, B1 and C3w.
Having estimates on the kinetic temperatures the nonthermal line widths of the cores can be determined: where is the FWHM of the nonthermal (turbulent) motion, and is the mass of the ammonia molecule.
Hydrogen column densities (H2) were calculated from ammonia column densities with the assumption that NH3/H, a mean value predicted by the models of chemical evolution of protostellar cores (Bergin & Langer BL (1997)). According to the models NH3/H2 is constant during the protostellar collapse, but increases during the later evolution of cores, when shocks accompanying star formation release the molecules formed on grains (Nejad et al. NWC (1990); Suzuki et al. SYOKIHT (1992)). For those positions of the cloud, where both and were determined, (H2) was derived independently of NH3/H2 (Ho & Townes HT (1983), Eq. 2). These positions allow us to check the adopted value of NH3/H2 when we make an assumption on the geometry of the cores.
Core masses were determined by summing up the mass elements for each position with cm-2, the lowest closed contour for most of the cores, and adding 20% helium (in number density). Here is the hydrogen column density and is the area corresponding to the grid spacing at a distance of 600 pc. We observed at a 40″ grid, with several additional points halfway between two grid points, therefore we interpolated linearly the column densities so that we got a regular grid with spacing of 20″.
In estimating the dynamical states of the ammonia cores their gravitational and kinetic energies, as well as the external pressure due to the weight of the overlying cloud have to be taken into account. Inserting the mass and radius of L 1340 obtained from 13CO data (Yonekura et al. YDMOF (1997)) into the formula (Bertoldi & McKee BMK (1992)) resulted in the mean external pressure K cm-3. With this data we estimated the critical Bonnor–Ebert mass of the cores, , where , and is the gravitational constant. Cores more massive than will collapse to form stars in this environment, if other effects are neglected.
3.3 Connection of cores with YSOs
Optically invisible IRAS point sources projected on the cores are supposed to be embedded YSOs born in the cores. We associate an embedded YSO with a core, following JMA, if it lies within 2 to the peak of the core. Connection of optically visible YSOs with the cores is less obvious. These more evolved objects may either have been born in the core on which they are projected or in another core which has already dispersed. In the following discussions we shall assume the cores having optically identified IRAS point sources or H emission stars within 2 to their peak to be starless. Our classification is somewhat uncertain because, due to the large distance of L 1340, only the most luminous members of the YSO population were detected by IRAS. Most IRAS sources in L 1340 are faint, close to the detection threshold, have less than four good quality fluxes, and are extended in the 100 m image. We note that only one optically invisible source, IRAS 02249+7230 has a good flux quality at 100 m.
4 Results
4.1 Distribution of ammonia in L 1340
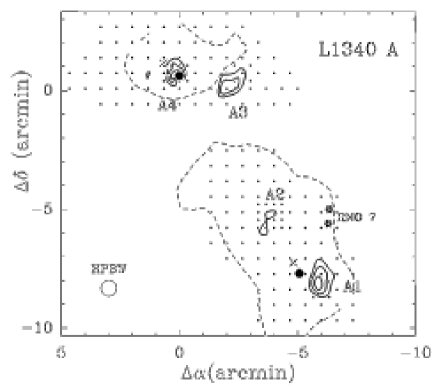
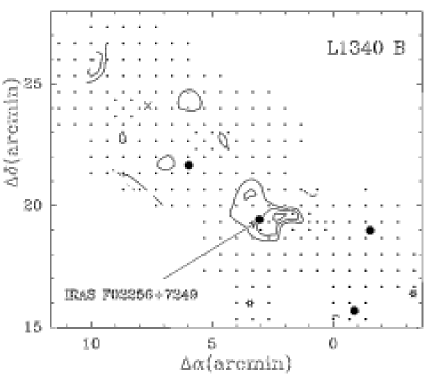
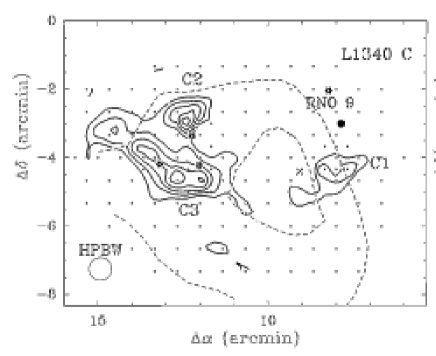
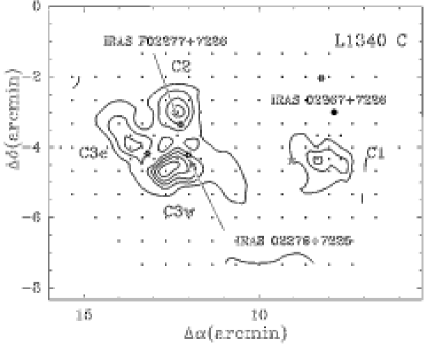
The ammonia cores defined by the integrated intensity distribution of the main-group of the (1,1) line are shown in the left panels of Figures 3–5 for clumps A, B, and C, respectively. For comparison, we also plotted the C18O contours = 0.45 K km s-1 and 0.75 K km s-1. The ammonia cores are labelled in the figures.
In addition to the cores defined in Sect. 3.2 there is an extended region of weak NH3(1,1) emission in the northern part of clump B, around the position of the C18O peak. The integrated intensity of the (1,1) line is below the 3 limit at most positions. The optically invisible source IRAS 02263+7251 lies in this area. Averaging 56 spectra around the position the C18O peak (bordered by a dotted polygon in Fig. 4) we obtained the spectrum displayed in Fig. 6. The weak line indicates low average column density for this region. Because the critical density of the excitation of NH3(1,1) emission is about 104 cm-3, this part of the cloud probably contains high density regions much smaller than the angular resolution of our observations.
Column density maps are shown in the right panels of Figs. 3–5. IRAS point sources associated with the cores are labelled in these figures. Because of the effect of the optical depth, column densities are not directly proportional to the integrated intensities. Comparison of the two sets of maps shows the main structures to be largely similar, with the exception that core C3 splits into two parts, C3w and C3e, in the column density map.
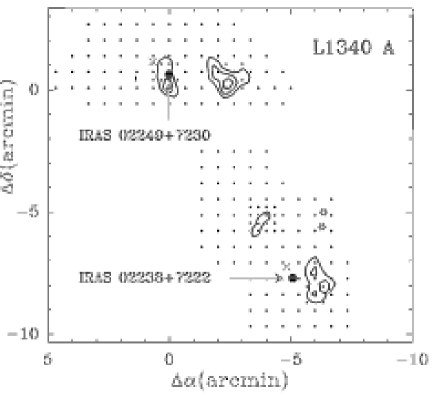
The physical properties of the cores, derived by the procedures described in Sect. 3.2, are displayed in Table 2. The following quantities are listed: Col. 1: name of the core. An asterisk following the name indicates that we associated the core with an embedded YSO; Col. 2: the half-maximum radius , in parsecs; Col. 3: at the peak position where the S/N of the line allowed its determination; Col. 4: the mean kinetic temperature ; Col. 5: the nonthermal component of the line width ; Col. 6: the maximum column density (NH3); Col. 7: volume density (H2) of the hydrogen derived from ; Col. 8: the mass of the core in solar masses. The Bonnor–Ebert mass is shown in Col. 9. Bolometric luminosity of the optically invisible IRAS point source associated with the core, calculated from the IRAS fluxes adding the long-wavelength bolometric correction (Myers et al. MFMBBSE (1987)) is shown in Col. 10. Where only flux upper limits were available, we estimated the fluxes from the infrared data sets (IRDS) obtained via the IRAS Software Telescope maintained at SRON (Assendorp et al. ABJKRW (1995)).
| Core | (NH3) | ||||||||
| (pc) | (K) | (km s-1) | (1014cm-2) | (104cm-3) | (M☉) | (L☉) | |||
| A1* | 0.08 | 15.2 (2.0) | 0.61 | 2.34 (0.24) | 5.8 | 3.2 | 9.6 | ||
| A2 | 0.04 | 12.5 | 0.31 | 2.10 (0.50) | 1.5 | 0.4 | |||
| A3 | 0.08 | 4.7 | 11.9 (2.3) | 0.21 | 3.40 (0.33) | 0.99 (0.08) | 6.5 | 0.2 | |
| A4* | 0.06 | 13.5 (2.0) | 0.97 | 2.53 (0.60) | 3.7 | 18.6 | 4.9 | ||
| B1* | 0.10 | 5.2 | 14.6 (3.1) | 0.67 | 2.05 (0.27) | 1.44 (0.10) | 5.6 | 3.0 | 8.8 |
| B2 | 0.08 | 15.0 | 0.24 | 1.45 (0.40) | 2.7 | 0.2 | |||
| C1* | 0.10 | 4.7 | 14.1 (1.7) | 0.64 | 3.57 (0.46) | 12.0 | 3.9 | 2.8 | |
| C2* | 0.10 | 4.6 | 16.7 (1.6) | 0.81 | 4.61 (0.60) | 1.07 (0.18) | 10.2 | 9.7 | |
| C3w* | 0.15 | 5.2 | 13.6 (1.1) | 0.95 | 4.89 (1.50) | 1.82 (0.40) | 15.6 | 17.2 | 1.5 |
| C3e | 0.11 | 6.0 | 12.5 (4.0) | 0.36 | 3.73 (0.57) | 1.29 (0.36) | 15.4 | 0.5 | |
| Mean | 0.08 | 5.1 | 14.0 | 0.58 | 3.07 | 1.32 | 7.9 | 5.7 | 5.4 |
| Starless cores | 0.07 | 5.1 | 12.2 | 0.28 | 2.67 | 1.14 | 6.5 | 0.3 | |
| Cores with stars | 0.09 | 5.0 | 14.6 | 0.78 | 3.33 | 1.44 | 8.8 | 9.3 | 5.4 |
The observed ammonia cores probably represent the densest regions of L 1340. B1 and B2, as well as C3w and C3e constitute twin core systems according to the definition by JMA. The cores are located close to the C18O peaks in clump A within the accuracy set by the different angular resolutions. In clumps B and C, however, the high density regions indicated by the ammonia emission are located far from the column density peaks of the C18O. These small dense regions might have been missed during the C18O survey because of their half-maximum sizes are smaller than the grid spacing (2′). The total mass in the dense cores is 79 M☉, some 6 % of the mass traced by C18O.
4.2 Velocity structure
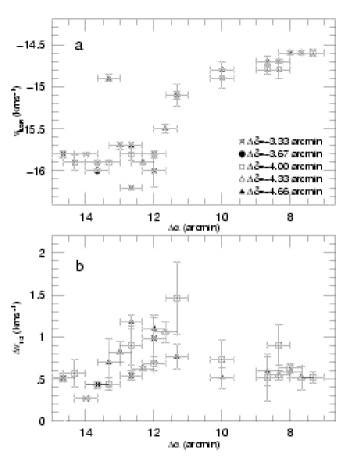
While neither C18O nor NH3 observations have indicated velocity gradients in L 1340 A and L 1340 B, C18O measurements of L 1340 C have shown a clear radial velocity gradient of 0.71 km s-1 pc-1 in the galactic longitude direction, which was interpreted as rotation of the clump in Paper I. The ammonia data, having higher angular resolution, suggest another possible scenario. Figure 3 shows that clump C contains two high density regions, separated by a lower density region between the right ascension offsets of about 916 and 1083. The two subclumps have a velocity difference of about 1.2 km s-1 (Table 2). The observed velocity gradient may result from the overlapping of the two clumps of different radial velocities. A similar situation was found in Orion KL by Wang et al. (WWW (1993)).
Figure 7a displays as a function of , at several offsets. The less negative velocity component at shows a small velocity gradient. The velocity changes abruptly between the offsets 1133 and , and is nearly constant (about 15.6 km s-1) at larger offsets. Both components can be observed at . This overlapping shows up as an increase in the line widths in this interval (Fig. 7b). The region of enhanced line widths coincides with the part of the clump where IRAS point sources are found. This morphology suggests that clump collision might have played role in triggering star formation in L 1340 C.
5 Discussion
Ammonia cores are those regions of the interstellar medium where the volume density is between 104–105 cm-3. In respect of physical properties they do not form a homogeneous group. Starless cores in most clouds have smaller nonthermal line widths and masses, and lower kinetic temperatures than those associated with IRAS sources. Moreover, the cores associated with embedded or nearby young clusters are the most massive and most turbulent objects in JMA’s ammonia data base. The typical mass and turbulent energy of gas in the cores, moreover, varies from cloud to cloud. Most cores in Taurus form isolated stars, whereas some of them in Ophiuchus and Orion give birth to rich clusters (Motte et al. MAN (1998); Mitchell et al. MJMFT (2001)). Several observational and theoretical studies suggest that the observed nonthermal line widths of cores are related to the initial conditions of star formation (e.g. Myers & Fuller MF (1993); Caselli & Myers CM (1995)).
Dense cores of molecular clouds are thought to be created by shocks due to the supersonic turbulent velocity field of the ISM, referred to as turbulent fragmentation (e.g. Elmegreen BGE (1993); Klessen, Heitsch & Mac Low KHM (2000)). In this scenario several observed properties of core/cloud systems are related to the nature of interstellar turbulence (Padoan Padoan (1995); Padoan & Nordlund PN (2002)). In particular, the slope of the line width–size relation reflects the power spectrum of the turbulence, so that and . Density ratio between cores and their environment, typical core diameter and mass, as well as the volume filling factor of the cores are related to the size and velocity dispersion of the ambient cloud.
Cores of various size and velocity dispersion probably define the smallest scale of the self-similar structure of interstellar medium. In low-mass star forming regions they represent the size scale where the nonthermal velocity dispersion becomes subsonic (Goodman et al. GBWH (1998)). Myers (Myers (1998)) has shown that the strongly turbulent, massive cores having km s-1 and N(H cm-2 may contain several critically stable condensations (kernels) cut off from MHD waves due to the high extinction of the core. This model suggests that massive, cluster-forming cores also represent an inner scale of the self-similar structure.
In this section we attempt to deduce some attributes of star formation from the derived properties of ammonia cores of L 1340 (Sect. 5.1), compare the features revealed by different tracers with each other (Sect. 5.2), and L 1340 with other star forming regions (Sect. 5.3).
5.1 Connection of ammonia cores with star formation
Table 2 shows that (NH3) for most of the cores of L 1340. Several observations have shown that this is a necessary condition of star formation (Williams et al. WBMK (2000)). Thus the observed cores probably highlight the positions of present and future star formation. The cores associated with embedded YSOs clearly differ from the starless cores in their nonthermal line widths. This is also true for the twin systems. The mean of cores without embedded or nearby IRAS point source, 0.28 km s-1, corresponds to a velocity dispersion kms-1. This is smaller than the isothermal sound speed at 13 K, =0.21 kms-1. Thus the detected starless cores are among the smallest clumps formed by turbulent fragmentation. Such objects may have a wide range of mass (e.g. Padoan & Nordlund PN (2002)), including small clumps which do not collapse. The weak ammonia emission observed at the northern part of clump B probably originates from such small, dense regions. (NH3) for the starless cores, indicating that they are destined to collapse. Our observations thus suggest that these cores are prestellar. We note, however, that this conclusion has some uncertainties. First, magnetic fields, neglected here due to lack of data, may modify the critical mass so that it will be significantly larger than . Furthermore, recent results by Tafalla et al. (TMCWC (2002)) demonstrate that ammonia abundance is enhanced towards the centres of some starless cores. Detection of the central regions only, enriched in ammonia, may lead to overestimation of the mass. Finally, it is possible that these cores are not starless, but contain low-luminosity embedded YSOs below the detection threshold of IRAS. Observations in other molecular lines with high angular resolution and more sensitive infrared observations can clarify the nature of these cores.
Cores associated with embedded IRAS sources have average km s-1, comparable to the those of Orion B (JMA). From the six cores, column density and nonthermal line width of A4 and C3w fulfil the criteria set by Myers (Myers (1998)) for cluster forming cores. In core A4 IRAS 02249+7230 closely coincides with the peak intensity of C18O, NH3 and . (NH3) for this core, suggesting that it is disrupting. Morphology of HH 489, associated with the IRAS source, however, indicates that the direction of the bipolar outflow from this star lies close to the plane of the sky (Kumar et al. KAY (2002)). The large nonthermal velocity dispersion of this core thus cannot arise from the interaction of outflow with the core gas. It indicates either the presence of other YSOs with outflows along the line of sight, or might have been produced before the star formation. The other cluster-forming core candidate, C3w, has a common envelope with C2 and C3e. Our ammonia observations show this core to be the densest region of L 1340, though it lies far from the C18O peak, and is associated with a single low-luminosity IRAS source IRAS 02276+7225. No outflow, maser source or HH-object have been detected around this source. Core C3w is probably less evolved than A4.
Our observational results suggest that the large turbulent velocity dispersions of IRAS-associated cores cannot be attributed to YSO winds. These cores are not simply more evolved versions of the starless cores, but probably form more massive stars than their narrow-line counterparts, and some of them will evolve into small stellar groups similar to the two sparse young clusters RNO 7 and RNO 8, found in L 1340 (Kumar et al. KAY (2002); Kun 2002a ). In order to reveal the real nature and evolutionary state of the cores, their detailed density and velocity structures and stellar contents have to be studied via higher resolution molecular and submillimeter continuum observations.
5.2 Comparison with H i, , , and
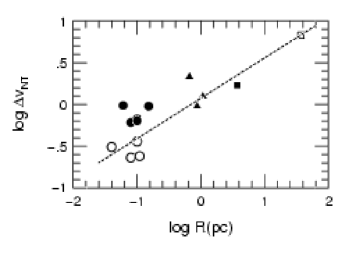
The nonthermal line width–size relation for the structures shown by different tracers, called Type 3 line width–size relation by Goodman et al. (GBWH (1998)), is a useful indicator of the overall density structure of a cloud, which, in turn, is closely related to the mode of star formation. In order to derive this relation for L 1340 we supplemented our ammonia results with C18O, 13CO and H i data.
The and data for the C18O and 13CO structures were taken from Paper I and from Yonekura et al. (YDMOF (1997)), respectively. The size and line width of the H i structure associated with L 1340 were estimated from the Leiden–Dwingeloo H i survey data (Hartmann & Burton HB (1997)). The main properties of the neutral hydrogen in the galactic environment of L 1340 are shown in Appendix A. The H i spectra in this region show definite peaks in the velocity interval whose characteristic FWHM is , and the half-maximum size of the interstellar feature delineated by this gas component is 38 pc.
The vs. relation for the structures observed in NH3, C18O, 13CO and H i is shown in Fig. 8. The values plotted have been corrected for the different beam sizes of the observations, and values have been corrected for spectral resolutions. We obtained the relation
| (1) |
and the correlation coefficient 0.85.
This relationship reveals the self-similar hierarchy of substructures from the large H i cloud to the ammonia cores, i.e. on the 0.1–40 pc size scale, suggesting that they are parts of a physically connected structure shaped by interstellar turbulence (Larson Larson (1981)). The slope is between those obtained for Taurus () and Orion B () cores (Caselli & Myers CM (1995)), from the same tracers.
We compare properties of NH3 cores and their embedding C18O clumps in Table 3. The data listed show that the average density ratio of the cores and their embedding clumps , the typical core diameter and the volume filling factor of the cores are in accordance with the values predicted by the model of turbulent fragmentation (Padoan Padoan (1995); Padoan & Nordlund PN (2002)). The size and velocity dispersion of the 13CO cloud are =3.7 pc and km s-1, respectively, thus the large-scale Mach number is . With these values the model gives , in accordance with the observed . The typical core diameter, pc, is also comparable to the observed average 0.16 pc. The volume filling factor of the cores, obtained from the probability density function of , is 0.02, compatible with the observed average shown in Table 3.
| Clump | A | B | C | Mean |
|---|---|---|---|---|
| (C18O) / pc | 0.9 | 1.1 | 0.7 | 0.9 |
| (NH3) / pc | 0.07 | 0.13 | 0.09 | 0.10 |
| (C18O / km s-1 | 0.89 | 1.25 | 2.16 | 1.43 |
| (NH3) | 0.57 | 0.46 | 0.72 | 0.58 |
| (12CO) (K) | 10.2 | 13.1 | 9.2 | 10.8 |
| (NH3) / K | 12.9 | 14.6 | 14.2 | 13.9 |
| (C18O)b / 1021 cm-2 | 7.1 | 8.4 | 7.8 | 7.8 |
| (NH3) / 1021 cm-2 | 8.6 | 6.8 | 14.0 | 9.8 |
| (NH3)/(C18O) | 7.7 | 11.6 | 10.0 | 9.8 |
| Area(NH3)/Area(C18O) | 0.04 | 0.02 | 0.16 | 0.07 |
| 0.04 | 0.02 | 0.19 | 0.08 | |
| 0.01 | 0.002 | 0.11 | 0.04 |
a The total line width, of a C18O core was calculated from the mean line width obtained by averaging for each observed position within the half-maximum contour of the integrated intensity map and from the dispersion of the mean velocity (): .
b taking into account the revised calibration (Yonekura et al. 1997).
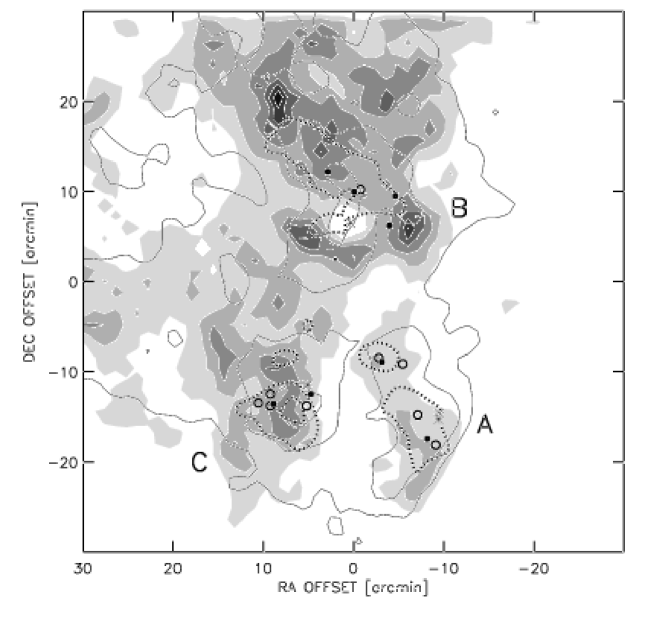
Finally, in Fig. 9 we compare different density cross sections of L 1340, traced by 13CO, C18O, and NH3, with the distribution of total cloumn density shown by the visual extinction . Visual extinction map was constructed from star counts using the USNOFS Image and Catalogue Archive222Operated by the United States Naval Observatory, Flagstaff Station (http://www.nofs.navy.mil/data/fchpix/). (see Appendix B for the details of obtaining ). The angular resolution of 13CO, C18O and maps is equally 3′.. Positions of ammonia cores, embedded YSOs and RNOs are also indicated. The amount of the foreground extinction was estimated and subtracted from the values obtained from the star counts (see Appendix B). The three clumps can be recognized in the distribution of , but some remarkable differences can also be seen between the structures shown by the obscuring dust and molecular gas, At the southwestern edge of the cloud, in clump A, similarity of 13CO and suggests that the total amount of originates from the observed molecular gas. The steep gradients of both the column density and volume density suggest that the gas in this volume has suffered compression from an external shock. Both in Clump B and C large dark patches can be seen which do not correlate with the molecular emission (e.g. around offsets [], []). These features indicate diffuse or overlapping clumps of high total column density. Together with the compact clump A they give asymmetric, cometary shape to the cloud with a ‘head’ pointing towards southwest. Surface distribution of the ammonia cores suggests that they have been formed by external compression or magnetic fields instead of gravity. Most of them (A1, A2, B1, C1, C3) are found far from the bottom of the gravitational potential well of the embedding clumps, indicated either by the peaks of the C18O intensity or by the large-scale distribution of .
5.3 Comparison with other clouds
Comparison of properties of ammonia cores in L 1340 with JMA’s data base (their Tables B9–B20) shows that the typical sizes, kinetic temperatures, line widths and masses of ammonia cores are increasing in the order of Taurus Ophiuchus Perseus L 1340 Orion B Orion A. The IRAS luminosities do not show this trend, being lower in L 1340 than in Perseus. A reason for this departure from the trend may be the difference in cloud distances. L 1340 is the most distant among the clouds listed above, therefore a considerable fraction of YSOs born in it might remained undetected by IRAS. We have shown in Sect. 5.2 that the slope of the line width–size relation also shows the Taurus L 1340 Orion B trend, suggesting that properties of cores and newborn stars are related to large-scale interstellar processes. Comparison of observational results with the continuously improving numerical simulations of such processes will lead to a better understanding of the cloud formation and evolution. This is, however, beyond the scope of the present paper.
6 Summary of the results
The main results of ammonia observations of L 1340 are summarized as follows.
-
(i)
Mapping of the whole area of the cloud where C18O emission indicated high gas volume density () in the NH3(1,1) and (2,2) lines resulted in the detection of 10 dense cores in L 1340. We found the embedding cores of six candidate YSOs, namely IRAS 02238+7222, 02249+7230, F02256+7249, 02267+7226, 02276+7225 and F02277+7226. An additional object, IRAS 02263+7251 is associated with weak ammonia emission near the detection limit.
-
(ii)
for most cores, indicating that they are able to form stars.
-
(iii)
The cores with and without embedded YSOs differ from each other in nonthermal line width. The nonthermal velocity dispersion is subsonic in the starless group. Outflows from the known embedded protostars cannot account for the high values of cores associated with IRAS sources. Therefore the two groups differ from each other not only in evolutionary state. The nonthermal line width of cores is probably related to the masses of stars being formed in them.
-
(iv)
The velocity structure of L 1340 C revealed two clumps moving with supersonic velocities with respect to each other. Star formation has possibly been triggered by clump collision in this region.
-
(v)
The relations between the physical properties of NH3 cores and the 13CO and C18O clumps are consistent with the scenario of turbulent fragmentation.
-
(vi)
The nonthermal line width–size relation revealed by NH3, C18O, 13CO, and H i shows self-similar structure between 0.1–40 pc. Its slope is .
-
(vii)
The typical size, kinetic temperature and line width of NH3 cores rank L 1340 between the high mass star forming regions Perseus and Orion B, whereas its total mass is some two orders of magnitude smaller, and no high mass stars have been formed in it. Apparently most of the ISM around L 1340 is in the form of H i.
Acknowledgements.
This research was supported by the Hungarian OTKA grants T022946, T024027, T034998, T034584, and T037508. We also received support from the German–Hungarian Technological and Scientific Cooperation Project No. 121. L. V. T. acknowledges financial support from the Academy of Finland grant No. 174854. This research has made use of the USNOFS Image and Catalogue Archive operated by the United States Naval Observatory, Flagstaff Station (http://www.nofs.navy.mil/data/fchpix/). We thank to Péter Ábrahám and Attila Moór for their help in handling the H i data, and László Szabados for careful reading of the manuscript.Appendix A Distribution of the HI around L 1340
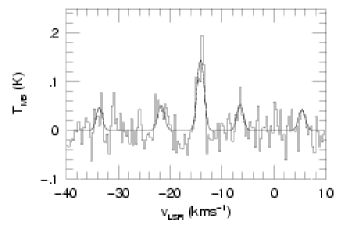
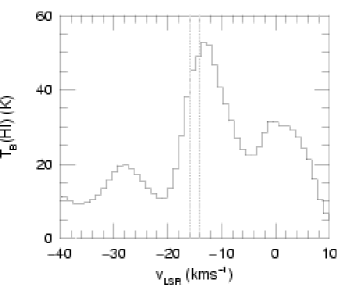
The angular resolution of the Leiden–Dwingeloo H i survey data is 06, corresponding to 6.3 pc at the distance of L 1340, and the velocity resolution is 1.03 km s-1. Fig. 10 shows the H i spectrum at (1305,+115), and in the velocity interval . The peak at 0 kms-1 probably corresponds to the atomic cloud associated with the molecular cloud L 1333 located at a distance of 180 pc around (l,b)=(1289,137), and at the same mean radial velocity (Obayashi et al. OKSYF (1998)). The highest peak of the spectrum at kms-1 represents the H i cloud enveloping L 1340. The characteristic line width of this spectral feature is 7 km s-1.
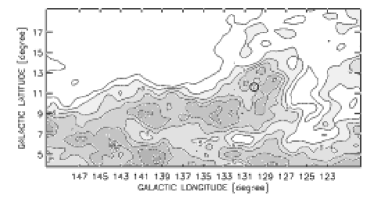
Fig. 11 shows the distribution of the neutral hydrogen integrated over the velocity interval . A large, elongated H i structure can be seen in the area and in this radial velocity interval. Its radius, derived from the area within the half-maximum contour, is 38 pc. The apparent local minimum in H i near the molecular cloud may result both from self-absorption and conversion of a part of hydrogen into molecules. The H i column densities displayed in Fig. 11 were estimated assuming optically thin emission, i.e. using the relationship
| (2) |
(Rohlfs & Wilson 2000). The mass of the H i structure, estimated via summing up the column densities inside the half-maximum contour is (H i) M☉, comparable with those of some well known nearby molecular cloud complexes (e.g. Taurus), and an order of magnitude larger than the mass of the molecular cloud.
Appendix B Deriving the distribution of from star counts
We used the USNOFS Image and Catalogue Archive to derive the distribution of the visual extinction in a field of containing L 1340. We counted the stars on overlapping circles of 3 in diameter, the centres of which were distributed on a regular grid with step of 30. We removed from the stellar list all known candidate pre-main sequence stars associated with the cloud, and all identified foreground stars. We derived from star counts using the method described by Dickman (Dickman (1978)). The extinction-free reference area was a field 20 centred on RA(2000)=1, Dec(2000)=+73°15′. values obtained in this manner saturate at 6 mag.
We estimated the contribution of the foreground diffuse matter to with the aid of the neutral hydrogen spectra (see Fig. 10). Assuming optically thin radiation we used the relationship 2 to derive hydrogen column densities from the spectra, and regarded as foreground all the H i gas at velocities kms-1, as well as half of the gas at 20 kms6 kms-1. Taking the average of four H i spectra covering the face of L 1340, and using the relationship (H i) [cm-2/mag] AV (Spitzer Spitzer (1978)) we obtained 0.55 mag for the foreground extinction to be subtracted from the values derived from the star counts.
References
- (1) Adams F. C. & Myers P. C. 2001, ApJ 553, 744
- (2) Assendorp R., Bontekoe T. R., de Jonge A. R. W. et al. 1995, A&S, 110, 395
- (3) Baars J.W.M., Genzel R., Pauliny-Toth I. I. K. & Witzel A. 1977, A&A 61, 99
- (4) Bergin E. A. & Langer W. D., 1997, ApJ 486, 316
- (5) Bertoldi F. & McKee C. F. 1992, ApJ 395, 140
- (6) Blitz L. & Williams J.P., 1999, The Origin of Stars and Planetary Systems, eds. C.J. Lada & N. D. Kylafis, Kluwer, p. 3
- (7) Caselli P. & Myers P. C. 1995, ApJ 446, 665
- (8) Cohen M. 1980, AJ, 85, 29
- (9) Danby G., Flower D.R., Valiron P. et al. 1988, MNRAS 235, 229
- (10) Dickman R. L., 1978, AJ 83, 363
- (11) Dorschner J. & Gürtler J. 1966, AN 289, 65
- (12) Elmegreen B. G. 1993, ApJ 419, L29
- (13) Forveille T., Guilloteau S. & Lucas R., 1989, CLASS Manual Version 4.0
- (14) Goodman A. A., Barranco J. A., Wilner D. J. & Heyer M. H. 1998, ApJ 504, 223
- (15) Harju J., Walmsley C. M. & Wouterloot J.G.A. 1993, A&AS 98, 51 (HWW)
- (16) Hartmann D. & Burton W. B. 1997, Atlas of Galactic Neutral Hydrogen, Cambridge Univ. Press
- (17) Ho P. T. P. & Townes C. H. 1983, ARA&A 21, 239
- (18) Jijina J., Myers P. C. & Adams F. C. 1999, ApJS 125, 161 (JMA)
- (19) Klessen R. S., Heitsch F. & Mac Low M.-M. 2000, ApJ 535, 887
- (20) Kumar M. S. N., Anandarao B. G. & Yu K. C. 2002, AJ 123, 2583
- (21) Kun M. 2002a, in: Galactic Star Formation Across the Stellar Mass Spectrum, ASP Conf. Ser., in press
- (22) Kun M. 2002b, in preparation
- (23) Kun M., Obayashi A., Sato F. et al. 1994, A&A 292, 249 (Paper I)
- (24) Larson R. B. 1981, MNRAS 194, 809
- (25) Martin R. N. & Barrett A. H. 1978, ApJS 36, 1
- (26) Mitchell G. F., Johnstone D., Moriarty-Schieven G., Fich M. & Tothill N. F. H. 2001, ApJ 556, 215
- (27) Motte F., André P. & Neri R. 1998, A&A 336, 150
- (28) Myers P. C. 1998, ApJ 496, L109
- (29) Myers P. C., Fuller G. A., Mathieu R. D., et al. 1987, ApJ 319, 340
- (30) Myers P. C. & Fuller G. A. 1993, ApJ 402, 635 773
- (31) Nejad L. A. M., Williams D. A. & Charnley S. B., 1990, MNRAS 246, 183
- (32) Obayashi A., Kun M., Sato F. et al. 1998, AJ 115, 274
- (33) Padoan P. 1995, MNRAS 277, 377
- (34) Padoan P. & Nordlund Å. 2002, ApJ, in press
- (35) Rohlfs K. & Wilson T. L. 2000, Tools of Radio Astronomy, Springer, p. 308
- (36) Spitzer L. 1978, Physical Processes in the Interstellar Medium, John Wiley & Sons, p. 156
- (37) Suzuki H., Yamamoto S., Ohishi M. et al. 1992, ApJ 392, 551
- (38) Tafalla M., Myers P. C., Caselli P. et al. 2002, ApJ 569, 815
- (39) Testi L., Palla F., & Natta A. 1999, A&A 342, 515
- (40) Walmsley C.M. & Ungerechts H. 1983, A&A 122, 164
- (41) Wang T.Y., Wouterloot J. G. A. & Wilson T. L. 1993, A&A 277, 205
- (42) Williams J. P., Blitz L. & McKee C. F. 2000, Protostars and Planets IV, eds. V. Mannings, A. P. Boss & S. S. Russell, Univ. of Arizona Press, p. 97
- (43) Yonekura Y., Dobashi K., Mizuno A. et al. 1997, ApJS 110, 21