Structure of the Mid-Infrared Emitting Disk Around WL16
Abstract
WL16 is a unique member of the embedded young stellar population in the nearby Ophiuchi cloud core: its extended, high surface brightness disk is visible only at mid-infrared wavelengths. We present diffraction-limited images, from 7.9 to 24.5 µm, of WL16 acquired at the Keck II telescope. We take advantage of the 03 angular resolution of the mid-infrared images to derive physical parameters for the central object by self-consistently combining them with available near-infrared spectroscopy, point-spread-function fit photometry, and pre-main-sequence evolutionary tracks. We find the central star to be a 250 L☉, 4 M☉, Herbig Ae star, seen through foreground material of the Oph cloud core that provides an extinction of magnitudes. WL16’s disk is detected through all nine observed passbands, not only those four which sample PAH emission features. We confirm, therefore, that the emitting particles are composed of both polycyclic aromatic hydrocarbons (PAHs) and very small (5–100 Å) graphitic grains (VSGs). The disk size as observed through the four PAH filters is 7″35 , corresponding to a disk diameter of 900 AU. The disk’s major axis is at a position angle of and viewed at an inclination angle of to our line-of-sight. Our derived inclination angle is in excellent agreement with the previously inferred inclination for the inner disk ( R☉) from kinematic modeling of the near-infrared spectral lines of CO. We can distinguish structure within the PAH disk at unprecedented resolution. We confirm a resolved (15 diameter) core component at 7.9 and 8.8 µm, due to emission from positively charged PAHs. An enhancement in the emission at 12.5 µm at the disk’s edges is found for the first time, and signals the presence of larger (–80 carbon atoms) PAHs and/or more hydrogenated PAHs than those found in the bulk of the disk. We find a disk asymmetry, observed at all nine mid-infrared wavelengths, at projected radii 1″–25 (corresponding to 125 AU 300 AU) from the central source.
1 Introduction
WL16 was first discovered via near-infrared photometry (Wilking & Lada, 1983) to be a member of the deeply embedded cluster currently forming in the highest extinction core of the nearby Ophiuchi cloud (Barsony et al., 1997, and references therein); it is undetectable at optical wavelengths. WL16 was identified as a few yr old, late-stage protostar based on its rising infrared (2–60 µm) spectral slope, and was assumed to consist of a remnant infalling dust and gas envelope surrounding a central protostardisk system (Lada, 1987; Adams, Lada, and Shu, 1987; Wilking, Lada, and Young, 1989).
Subsequent observations conflicted with the classification of WL16 as a late-stage protostar, however. WL16 lacks, by two orders of magnitude, the amount of millimeter flux expected from a low-mass young stellar object (YSO) at such an early evolutionary stage, and shows no evidence of a molecular outflow (Cabrit & André, 1991; André & Montmerle, 1994). WL16 is the only source in Ophiuchus known to exhibit the entire suite of polycyclic aromatic hydrocarbon (PAH) emission features (Tanaka et al., 1990; Hanner et al., 1992; Deutsch et al., 1995; Natta & Krügel, 1995). It has become clear that PAH emission accounts for the appearance of WL16’s mid-infrared spectral features rather than what had previously been interpreted as a deep silicate absorption feature (Hanner et al., 1992), such as is generally associated with the presence of a cool circumstellar envelope in late-stage, low-mass ( 2 M☉) protostars.
WL16 is also the first YSO in which the presence of a hot (1000K T 6000K), dense, neutral, gaseous, Keplerian disk was inferred via detailed modeling of its 2.3 µm CO overtone emission line shapes (Dent & Geballe, 1991; Carr et al., 1993; Chandler et al., 1993, 1995). The inner disk (3–30 R☉) around WL16 is modeled as having a high inclination angle () with a fairly low accretion rate from the disk to the star of M☉ yr-1(Najita et al., 1996a). Velocity-resolved spectroscopy of the Br hydrogen line toward WL16 provides independent evidence for the low accretion rate infalling gas at spatial scales smaller than that of the inner disk radius (Najita, Carr, and Tokunaga, 1996b; Hartmann, Hewett, and Calvet, 1994).
What makes WL16 truly unique, however, is the large extent (8″ along its major axis) of its elliptically-shaped mid-infrared emission, as revealed by previous imaging studies (Deutsch et al., 1995; Emerson et al., 1996; Moore et al., 1998). Spatially-resolved mid-infrared spectroscopy of this elongated dust structure has confirmed the presence of both very small grains (VSG’s) and polycyclic aromatic hydrocarbons (or PAH’s) throughout (DeVito & Hayward, 1998).
The presence of mid-infrared emission out to such large extents from a central source is not expected from “classical” or “standard equilibrium-emitting” silicate and amorphous carbon or “MRN” grains (Mathis, Rumpl, and Nordsieck, 1977). These “standard” grains range in size from 10 nm to nm, have a size distribution, , and are generally assumed to be large enough to come into equilibrium with the surrounding radiation field (although see Lynch & Mazuk 2000 for a thorough discussion of the shortcomings attendant upon this assumption).
By contrast, the so-called graphitic “Very Small Grains” (VSGs), which range in size from 0.4 nm 10 nm with a size distribution (Draine & Anderson, 1985) and the PAHs, which contain 25–40 carbon atoms, or PAH clusters, containing 50–500 carbon atoms (Siebenmorgen & Krügel, 1992), are heated and emit in a non-equilibrium fashion. They are therefore capable of emitting in the mid-infrared, at large distances from a central illuminating source at (seemingly) “high temperatures” not in equilibrium with the surrounding radiation field.
Detailed radiative transfer modeling of the spectral energy distribution of physically realistic, spherically symmetric dust shells surrounding Herbig Ae stars shows that whereas the mid-infrared ( 2–20 µm) emission from “classical” grains is negligible, the continuum emission from VSGs in this wavelength range accounts for all of the observed mid-infrared excesses (above photospheric) for these sources (Natta, Prusti, and Krügel, 1993). These authors also note that VSGs do not emit in the J band (1.25 µm), and only very little in the H band (1.65 µm) for the same models in which VSGs contribute essentially all of the observed mid-infrared continuum emission. Therefore, the slope of the spectrum in the 1.25–1.65 µm continuum is effectively determined by the underlying stellar radiation field and of the absorption and scattering properties of the “standard” grains, even in the presence of VSGs.
Whereas VSGs essentially determine the mid-infrared continuum emission in the circumstellar environments of Herbig Ae/Be stars (Herbig, 1994), the effect of adding PAH emitters results in emission into several, well-defined solid-state features, with minimal change in the underlying shape of the mid-infrared continuum, as compared with models computed in the absence of PAHs. When a UV/visible photon from the central source interacts with a PAH lattice, the photon energy is redistributed into stretching and bending modes of CH and CC bonds; these modes re-emit energy in broad, solid-state features. These well-known PAH features are centered at 3.29 µm (the CH stretch), at 6.2 and 7.7 µm (CC stretch modes), 8.6 µm (CH in-plane bend), 11.3 µm (CH out-of-plane bend), and 12.5 µm (CH bond resonance) (Tokunaga et al., 1991; Siebenmorgen & Krügel, 1992; Brooke, Tokunaga, and Strom, 1993; Hanner, Brooke, and Tokunaga, 1995). The region between 10 and 20 µm is dominated by a resonance between 10.5 µm µm (encompassing the 11.3 and 12.5 µm features) due to CH out-of-plane bending. Although the approximate wavelength of one resonance is about 11.3 µm, due to a mono-CH vibration, this wavelength can actually be longer, depending on hydrogenation (the number of H atoms attached to the edge carbon rings). Some continuum emission is also produced by the overlapping wings of these PAH features.
The excitation of mid-infrared emission by PAHs and VSGs out to such large physical distances from the central object as is observed in WL16, requires both a fairly luminous source of optical/UV photons and optically thin paths from the central object to the mid-IR emitting regions. The uniqueness of the mid-IR emitting structure observed in WL16 amongst all of the known embedded sources in Oph, combined with the fact that many intermediate mass (2 M M☉) YSO’s show PAH-feature emission (Waters & Waelkens, 1998), leads one to re-consider the central source’s properties.
In order to shed further light on both the nature of the central object and its surrounding circumstellar material, we have obtained images of WL16 at nine distinct wavelengths—through filters which variously either include or exclude PAH feature emission and span the 8–25 µm atmospheric windows—all at unprecedentedly high spatial resolution ( 03). In addition, we have made use of previously published near-infrared photometry, recently published spectroscopy, and up-to-date pre-main-sequence tracks for intermediate stellar masses, to re-examine the nature of the central object.
2 Observations
We observed WL16 with JPL’s mid-infrared camera, MIRLIN (Ressler et al., 1994), at the visitor port of the Keck II telescope on UT 14 March 1998 and 27 January 1999. The sky was clear and dry on both nights ( and , respectively). MIRLIN employs a Boeing HF–16, 128128 pixel, Si:As impurity band conductor detector array, and produces a plate scale of 0138 per pixel (175 field-of-view) with the f/40 chopping secondary mirror at Keck II.
Background subtraction was performed by chopping the telescope secondary mirror 8″ in a north-south direction, then nodding the entire telescope 30″ east-west, completely off the source, in order to remove residual differences. Observations were performed through the six 10 µm “silicate” filters (7.9, 8.8, 9.7, 10.3, 11.7, and 12.5 µm) and the 17.9 µm filter on 14 March 1998, and through the 20.8 µm and 24.5 µm filters on 27 January 1999. All of these filters have a passband of %, except for 24.5 µm where %. Plots of the 9 filter passbands are shown in Figure 1, along with the continuum-subtracted mid-infrared spectrum of WL16 (DeVito & Hayward, 1998), to indicate how the PAH emission features were sampled. Note that the well-known, broad silicate features, due to the Si–O stretching and bending modes, at 9.7 and 18 µm, respectively, were also sampled.

Total on-source integration times through each of the “silicate” filters were approximately 30 seconds—200 coadded chop pairs of roughly 80 msec duration in each of the two beams. Total on-source integration times through the longer wavelength filters were 2.0, 2.7, and 2.4 minutes through the 17.9, 20.8, and 24.5 µm filters, respectively. The primary photometric standard and point spread function calibrator was the A3V star, Leo, which has a magnitude ranging from 1.91 to 1.84 from 7–13 µm. The calibrator at 17.9 and 20.8 µm was Hya, a K3III star with a magnitude of 1.49; the standard at 24.5 µm was Lib, a 2.84 magnitude B8V star. Consistency checks were performed with CMa (mag = 1.39) and Sco (mag 2.40); the latter proved to be an easily-resolved binary with 045 separation. Atmospheric extinction was corrected by observing the calibrators at several different airmasses. The resulting coefficients were found to be quite low ( 0.1–0.2 magnitudes per airmass).

3 Results
3.1 Mid-Infrared Images
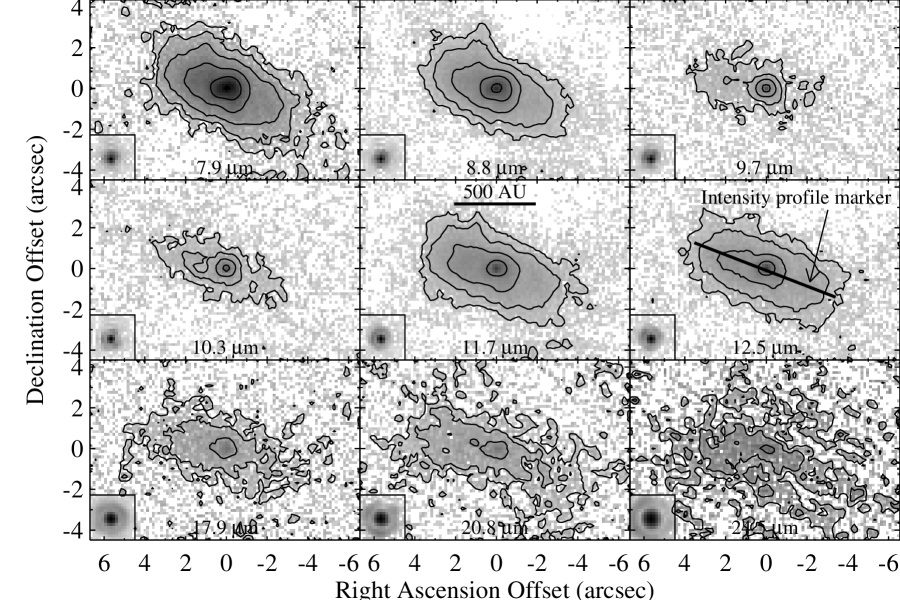
The mid-infrared images of WL16 are presented in Figure 2. It is clear that the circumstellar structure surrounding WL16 appears brighter with respect to the central source in the filters that encompass the PAH features, relative to its appearance in the filters that exclude PAH feature emission over the 7–13 µm region. Nevertheless, the mid-infrared emission is still well-resolved even in the filters that exclude PAH feature emission.
The extent of the emission derived from the images that include the PAH features is 7″35 at 1% of the peak level. This projected source size corresponds to 880 440 AU for an assumed distance of pc (de Geus, de Zeeuw, and Lub, 1989; de Geus, 1992; Knude & Hog, 1998). The position angle of the major axis, measured east from north, is .
Intensity profiles along the major axis of WL16 (indicated on the 12.5 µm image of Figure 2) are presented for each wavelength in Figure 3. The central, bright core is resolved at the shortest (7.9 and 8.8 µm) wavelengths, but is unresolved at wavelengths longer than this. We also find that the contrast of the central peak to the disk emission varies with wavelength (see Col. 5 of Table 1), with the highest PSF/disk contrast occurring in the 9.7 and 10.3 µm images and the lowest PSF/disk contrast in the 24.5 µm image.
3.2 Mid-Infrared Color Ratios
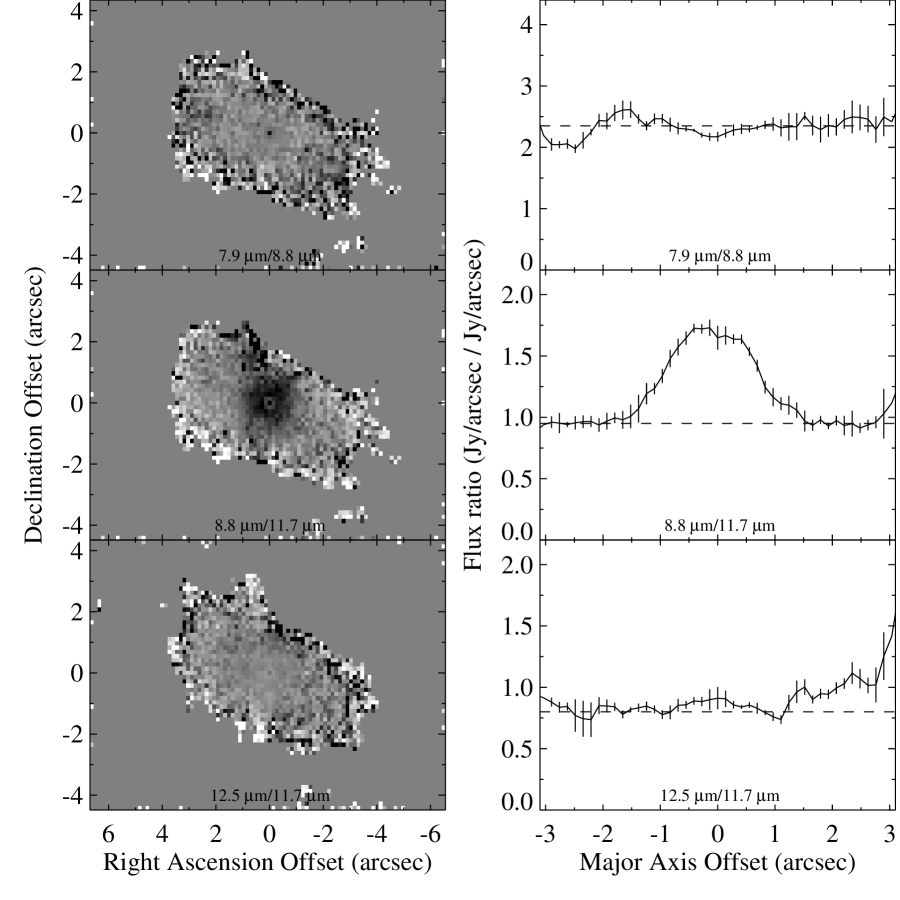
In Figure 4, we present three mid-infrared color ratio images of the WL16 disk: the 7.9/8.8 µm flux ratios in the top left panel, the 8.8/11.7 µm flux ratios in the middle left panel, and the 12.5/11.7 µm flux ratios in the bottom left panel. We find no significant color gradient in the entire 7.9/8.8 µm flux ratio image. This is in contrast to the other two flux ratio images presented in Figure 4. The 8.8/11.7 µm image (and in the 7.9/11.7 µm image not shown here) shows significantly enhanced values within the inner 15 diameter “core” (see also the corresponding panels of Figure 3). This inner core flux ratio enhancement is more quantitatively illustrated in the corresponding cross-cut panel of Figure 4, which shows the 8.8/11.7 µm flux ratio at a peak value of 1.75 within the inner core, declining to a relatively constant value of 0.95 outside this core. By contrast, the 12.5/11.7 µm flux ratio image shows little variation in the inner (″) regions; but shows a small enhancement towards the disk’s edges. This flux ratio rises from a value of 0.85 in the inner regions to values at the disk’s outer edges.
3.3 Photometry
We present new mid-infrared and far-infrared photometry for WL16 in Table 1. To compare our photometry with previous ground-based results (e.g. Lada & Wilking 1984; Moore et al. 1998), we have performed false aperture photometry with an 8″ diameter software aperture. In general, the agreement between our 8-arcsec aperture photometry and that of Lada & Wilking is quite good in the mid-infrared. The random errors in our flux measurements are about 3% at 8–13 µm, 7% at 17.9 and 20.8 µm, and 30% at 24.5 µm. Our fluxes agree with those previously published to 2 at 8.8 µm, 3 at 10.3 µm, and 1 at 11.7 and 12.5 µm. We find some discrepancy, however, between our 9.7 µm flux (2.2 Jy) and the previously published 9.7 µm flux (1.6 Jy) of Lada & Wilking, though this may not be significant due to the strong, telluric ozone absorption feature contained within this band.
We also performed point spread function fit (PSF-fit) photometry of the central peak in each image of WL16 to better determine the flux from just the central source, since the spatial resolution of the mid-infrared images allows a clean separation of the central peak from the surrounding nebulosity. To accomplish this, a PSF image derived from observed standard stars at each wavelength was shifted, scaled, and offset to fit the central source in WL16. This same method was applied to near-infrared images of WL16 to derive PSF-fit near-infrared photometry, as well (Ressler, 1992). At all wavelengths, the PSF-fit flux contains just photospheric light plus any warm dust within the PSF ( AU). Values of these PSF-fit fluxes are also tabulated in Table 1.
| Wavelength | PSF Fitting | Aperture Phot. | Prev. Publ. | Disk/PSF Ratio | Refs. |
|---|---|---|---|---|---|
| Flux | Fluxa | Flux | |||
| (m) | (Jy) | (Jy) | (Jy) | (Aper.-PSF)/PSF | |
| 1.2 | 0.0037 | … | 0.0040 | (1,2) | |
| 1.65 | 0.059 | … | 0.071 | (1,2) | |
| 2.2 | 0.45 | … | 0.48 | (1,2) | |
| 3.4 | 1.17 | … | 1.36 | (1,2) | |
| 3.8 | 1.22 | … | … | (1) | |
| 4.8 | 2.18 | … | 2.02 | (1,3) | |
| 7.9 | 1.49 | 19.13 | … | 11.8 | … |
| 8.8 | 0.65 | 7.89 | 8.3 | 11.1 | (3) |
| 9.7 | 0.35 | 2.18 | 1.6 | 5.2 | (3) |
| 10.3 | 0.30 | 1.97 | 1.8 | 5.5 | (3) |
| 11.7 | 0.49 | 7.07 | 7.1 | 13.4 | (3) |
| 12.5 | 0.57 | 6.30 | 6.25 | 10.1 | (3) |
| 17.9 | 0.28 | 4.53 | … | 15.2 | … |
| 20.8 | 0.25 | 3.19 | 4.8b | 11.8 | (3) |
| 24.5 | 0.19 | 5.67 | … | 28.8 | … |
| 12 | … | 16.0 (HIRES) | 18.8 | (4) | |
| 25 | … | 14.4 (HIRES) | 40 | (4) | |
| 60 | … | 129 (HIRES) | 202 | (4) | |
| 100 | … | 223 (HIRES) | … | (4) | |
| 1300 | … | … | 0.006 | (5) | |
| aafootnotetext: All quoted fluxes are for an 8′′ diameter aperture, except for HIRES fluxes which were determined from a 45′′ diameter aperture after local background subtraction. bbfootnotetext: Broadband Q measurement— 40% |
References. — (1) Ressler (1992), (2) Wilking & Lada (1983), (3) Lada & Wilking (1984), (4) Young, Lada, & Wilking (1986), (5) Motte, André, & Neri (1998)
We present the spectral energy distributions (SEDs) for photometry measured through different-size apertures for WL16 in Figure 5. The data have been separated into PSF-fit points (triangles connected by a solid curve), 8 arcsec aperture photometry points (squares and stars connected by a dotted curve), and the 45 arcsec resolution HIRES-processed IRAS fluxes (connected by dot-dashed lines). In the large (8-arcsec) aperture data, the steep drop in flux approaching the wavelength of 9.7 µm from either side, was at one time mis-interpreted as a very deep silicate absorption feature. The depth of this silicate absorption feature is significantly reduced in the curve connecting just the PSF-fit data points, underlining the important contribution of PAH feature emission to the larger aperture photometry.

In the near-infrared, the flux values found within an 8-arcsec aperture (Wilking & Lada, 1983), are only slightly higher than the flux values derived through PSF-fitting, in contrast to the large observed difference between the PSF–8″ aperture photometry values at all mid-infrared wavelengths, both through filters that include and those that exclude PAH features (see Figure 5). This behavior is as expected of VSG emission: providing only a marginal contribution to near-infrared continuum emission, but being the dominant source of mid-infrared continuum emission. This result also justifies the use of our near-infrared PSF-fit fluxes to derive the extinction and intrinsic central source luminosity (see 4.1 below).
4 Discussion
4.1 Nature of the Central Source
The spectral type of the central source of WL16 has recently been determined from high signal-to-noise, moderate resolution, near-infrared spectroscopy to lie in the range B8 to A7, corresponding to a photospheric effective temperature of 8,000 K 12,000 K (Luhman & Rieke, 1999). We combine this constraint on the central object’s effective temperature with other observational data and theoretical pre-main-sequence tracks in a self-consistent manner to re-determine both the estimated extinction to the central source and its intrinsic bolometric luminosity, mass, and radius. The low millimeter flux (André & Montmerle, 1994; Motte et al., 1998), lack of near-infrared excess (Moore et al., 1998), and the fact that UV/optical radiation is able to illuminate such a large (900 AU) VSG/PAH emitting region in the immediate vicinity of WL16, all lead to the conclusion that the circumstellar material surrounding WL16 is optically thin at these wavelengths. Furthermore, computations of the continuum spectral energy distributions of flared and geometrically thin accretion disks have shown that high accretion rates ( M☉ yr-1) are required to produce optically thick inner disks around HAeBe stars (Hartmann, Kenyon, and Calvet, 1993). For comparison, the upper limit for the inner disk accretion rate for WL16 is M☉ yr-1(Najita et al., 1996a).
If the circumstellar environment of WL16 is optically thin in the near-infrared, then the observed extinction along the line-of-sight towards WL16 must arise in the intervening Oph cloud, which acts as a foreground screen. We note that this is a radically different physical source picture than one in which all of the energetic UV/visible source photons are assumed to be intercepted by the immediately surrounding circumstellar material, and whose energy is subsequently re-radiated by this same circumstellar material at longer, infrared wavelengths.
In order to determine the value of the intervening extinction, we fix the photospheric temperature of the central source at 9000 K. We include only the near-infrared photometry in the fit, since the near-infrared fluxes are essentially uncontaminated by any “classical” grain or VSG emission from circumstellar material. We then fit a reddened blackbody (modeling the extinction with the Mathis (1990) curve for molecular clouds) with only two free parameters, and stellar radius, to determine the extinction through the cloud.
The resulting extinction, , falls within the range of previously derived values. A strict upper limit can be derived from the line-of-sight beam-averaged (55″ FWHM) 13CO observations, from which the extinction through the entire cloud in the direction of WL16 is estimated at mag with a 50% error (Wilking, priv. comm.). At the other extreme, allowing for a wide range of intrinsic NIR source colors, a possible range of was found by Carr et al. (1993). A value for towards WL16 was previously published, derived from its color by Wilking & Lada (1983). The most recent published determination for the extinction towards WL16 is an , determined using the NIR photometry of Greene & Young (1992), and assuming an intrinsic A star photosphere (Moore et al., 1998).
We argue that our determination of for the extinction towards WL16 is the most stringent to date. Figure 6 shows data and a model that have all been dereddened for an intervening screen using the Mathis (1990) extinction curve. The solid curve plotted in Figure 6 shows the resulting spectral energy distribution for a K blackbody photosphere with a radius of 6.5 R☉ at pc. The triangles represent the dereddened PSF-fit data points; the asterisks represent the corrected near-infrared data from Wilking & Lada (1983). Note that the residual silicate absorption feature apparent from the solid curve joining the mid-infrared, PSF-fit photometry in Figure 5 completely disappears from the corresponding extinction-corrected PSF-fit data plotted in Figure 6. This is especially striking in view of the fact that the mid-infrared fluxes were not included in the fit used to determine the extinction to the source. The dereddened, PSF-fit, mid-infrared data points do lie somewhat above the plotted photospheric model curve, however. This slight, remaining mid-infrared “excess” may signal the presence of VSGs within AU of the central source (within the PSF). Nevertheless, the goodness of the fit suggests that the residual “dip” apparent in the mid-infrared, PSF-fit data of Figure 5 is caused by the intervening cloud’s silicate absorption, and not by PAH emission.

Strong constraints on the possible values of the derived extinction can be made via the two requirements of 1) matching the shape and magnitude of the dereddened near-infrared flux data to an appropriate blackbody, and 2) eliminating the residual 9.7 µm silicate absorption feature from the curve joining the PSF-fit fluxes in Figure 5. If were greater than , the dereddened data would show a silicate emission feature in the mid-infrared and the near-infrared points would lie on a curve steeper than a blackbody. For , fits consistent with a 9,000 K blackbody emitter would become problematic. In fact, the derived is relatively insensitive to the assumed temperature: variation from 6,000 to 12,000 K produces only a 1 magnitude change in since the infrared data are well on the Rayleigh portion of the blackbody curve. Therefore, we can confidently assert that the range of foreground extinction falls within .
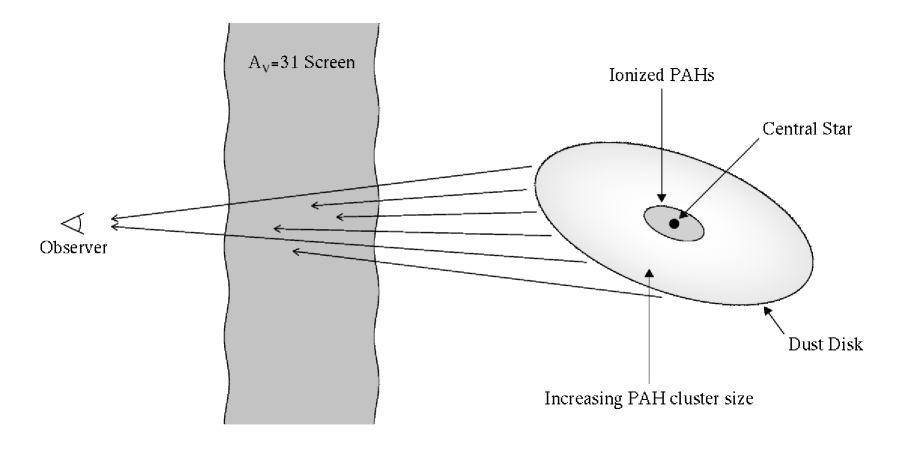
We can now arrive at a new determination of the bolometric luminosity of WL16, simply by integrating under the photospheric curve plotted in Figure 6. We find a bolometric luminosity of 250 L☉ for an assumed distance of 125 pc. This is much higher than previously published values for the luminosity of WL16, which range from 10 L☉ to 22 L☉ for pc (Young, Lada, and Wilking (1986); Wilking, Lada, and Young (1989)). This discrepancy is resolved when one takes into account the very different assumptions that went into the different luminosity determinations. In the absence of evidence to the contrary, previous workers had assumed that all the extinction towards WL16 was local and circumstellar, and that all of the source photons were absorbed and re-radiated locally at mid- and far-infrared wavelengths. However, in view of subsequent multi-wavelength photometry and spectroscopy, the new source picture that emerges is one in which the extinction is provided by a foreground screen, remote from the source, so that the absorbed photons are reradiated well outside our (or anyone else’s) beam (see Figure 7 for the schematic cartoon of the source geometry).
Our new bolometric luminosity determination of 250 L☉, combined with the spectroscopically determined effective temperature determination of 9,000 K, allows placement of WL16 on the H-R diagram for the first time. Comparison of the position of WL16 on this diagram with the pre-main-sequence tracks of Palla & Stahler (1999) yield a source mass of M☉ and a source age of Yr. The Siess et al. (2000) PMS tracks also give a source mass of M☉, but an age of Yr. Previous determinations for the central source’s mass in WL16 were made before pre-main-sequence tracks for more massive objects ( M☉) were available, coupled with an erroneous underestimate (10–20 L☉) of the central object’s true luminosity.
4.2 A Mid-IR Emitting Disk in WL16
Previous mid-infrared imaging of WL16 shows an extended emission region elongated along an approximately NE–SW axis (Deutsch et al., 1995; DeVito & Hayward, 1998; Moore et al., 1998). This emission has variously been interpreted as originating from a nebula, a torus, a bipolar cavity, or a disk. We consider a “nebula” (meaning an H II region) to be unlikely given the lack of narrow spectral features in the near- or mid-infrared, and the fact that the central star has a much later spectral type than B3 (Luhman & Rieke, 1999). It is also not a reflection nebula given that scattering is inefficient in the mid-infrared, and the density necessary to show any scattering would require an optically thick disk; we have already argued that WL16’s emission is optically thin. A torus is unlikely since the intensity profile does not indicate a “hole” in the inner regions of the disk, and a torus would be difficult to maintain physically. A bipolar cavity can be ruled out since the outflow to create such a cavity was searched for, but not found (Cabrit & André, 1991). We propose that the most plausible interpretation of our multi-wavelength imaging dataset favors the notion that the mid-infrared emission originates from a geometrically thin, equatorial disk.
Under this assumption for the source geometry, the minor-to-major axis ratio is found to be , measured from the images as observed in the four filters that include the PAH emission features. This ratio corresponds to an inclination angle of of the disk to our line-of-sight, if we assume the disk to be intrinsically circular and to appear elongated only because of projection effects. This value agrees well with the inclination angle () deduced for the inner disk ( R☉) of WL16 from kinematic modeling of the hot gas ( K) emitting in the near-infrared CO lines (Dent & Geballe, 1991; Carr et al., 1993; Chandler et al., 1993, 1995).
4.3 Properties of the Mid-IR Emitting Disk
It has already been suggested that the mid-IR emitting dust surrounding WL16 consists of at least two components, aromatic hydrocarbons and VSGs (Moore et al., 1998). The present observations strongly support this suggestion. The disk of WL16 is easily visible through all the mid-infrared filters, not just those which contain PAH emission features, although the disk does emit most strongly through those filters which encompass PAHs (Figure 2). Similar results were found by Moore et al. (1998), upon comparison of their images of WL16 through filters which contain PAH emission features at 8.2 and 11.3 µm with their 10.2 µm continuum image, which is PAH-feature-free. Our results extend this finding to a greater number of wavelengths.
Simple modeling of PAH and VSG emission in the mid-infrared from spherical distributions of optically thin dust surrounding an 8,000 K (12,000 K) central source, suggests that 1% (3.5%) of the starlight would be absorbed by PAHs and 15% (20%) by VSGs. However, these values for the PAHs are highly dependent on the assumed absorption cross-sections, and could be as high as 16.6% (17%) for an 8,000 K (12,000 K) central object (Natta & Krügel, 1995). For WL16, we find that 1% of the 9,000 K central source’s luminosity, or 2.6 L☉, are emitted by the PAHs and VSGs. At the very least, this low value, relative to the models, rules out spherical distributions of PAHs and VSGs around the source. For comparison, previous authors have estimated L☉ to be contributed by the 7.7–13 µm PAH band emission within a 5″ beam (Hanner et al., 1992), scaled to pc, and 1.2 L☉, integrated over the entire disk extent (Moore et al., 1998).
4.3.1 Very Small Grain (VSG) Constituent
Figure 2 shows the extended appearance of WL16 at 9.7, 10.3, 17.9, 20.8, and 24.5 µm; passbands which exclude PAH feature emission. Since neither PAHs nor the “standard” MRN grains can account for this emission, as we argue below, the continuum emitter responsible for this extended mid-infrared emission in the disk of WL16 must be in the form of the so-called very small grains (VSG’s) (Natta & Krügel, 1995; DeVito & Hayward, 1998; Moore et al., 1998). It has been shown that such VSGs surrounding HAeBe stars are excited by a much broader spectrum of photons than the PAHs and can reprocess stellar radiation into the mid-IR (Natta, Prusti, and Krügel, 1993).
We have already pointed out (see 4.1) that the systematic mid-infrared excess flux that remains after de-reddening the PSF-fit photometry requires the presence of VSG’s on scales AU (see Figure 6). Similarly, emission from VSGs is required to explain the large spatial extent of WL16’s disk at continuum wavelengths ( AU). This is quantitatively illustrated by Figure 8, where intensity cross-cuts of a model disk, consisting of regular ISM grains, are compared with the actual, observed intensity profiles of WL16’s disk. The model disk intensity profiles were kindly provided by Dr. Barbara Whitney, using a 3-D Monte Carlo code described in Wood et al. (2002), and includes both scattering and emission by standard interstellar grains (Kim et al., 1994) at mid-infrared wavelengths. The model shown is for a 0.01 M☉ flared disk (the maximum disk mass allowed by millimeter observations), inclined at 60∘ to our line-of-sight, at a distance of 125 pc, illuminated by a central source of 250 L☉ and K. The disk density structure is as described in Wood et al. (2002), except the inner radius is set by the dust destruction radius for a K central source, and the disk’s outer radius is determined by the observations presented here. Note that emission from standard, interstellar grains at large radii from the central source would be undetectable, according to the models, in stark contrast to the observed emission. Standard, interstellar grains cannot, therefore, be responsible for the appearance of WL16’s disk at large radii through the filters which exclude PAH emission.


Additional qualitative proof of this assertion is provided in Figure 3. A comparison of the 9.7, 10.3, 17.9, 20.8, and 24.5 µm flux profiles (none of which should have significant PAH emission) with the fiducial 11.7 µm profile suggests a rather constant ratio as a function of distance from the center, despite any differences in the absolute surface brightness values. This also holds true in the fully two-dimensional case, as well, where ratios of any pair of images, including the 10.3 µm/20.8 µm ratio image (not shown), are generally very flat outside of the ionized PAH core. This behavior is consistent with the emission expected from VSGs, but is inconsistent with the emission properties expected from “classical” grains. It also suggests that the PAHs and VSGs are well mixed.
4.3.2 PAH Ionization, Hydrogenation, and Size Effects in the WL16 Disk
The color ratio images presented in Figure 4 can give some qualitative indication as to the charge state, amount of hydrogenation, and size of the emitting PAH molecules. Quantum mechanical modeling and laboratory studies of PAH emission have shown that the charge state of the PAH has an important effect on the emitted IR spectrum. In particular, the intensities of the CC stretching and CH in-plane bending modes, which fall in the 6–9 µm range, are generally an order of magnitude stronger in PAH cations (singly ionized PAHs) than in neutral PAHs (Joblin et al., 1996; Langhoff, 1996; Hudgins & Allamandola, 1995a, b). Viewed in this context, it is therefore not surprising that the 7.9/8.8 µm flux ratio shown in the top panels of Figure 4 is essentially constant over the entire emitting region of the WL16 disk, since both of these features (at 7.7 and 8.6 µm) originate from positively charged PAHs.
DeVito & Hayward (1998) found a central peaking of the continuum-subtracted 8.6/11.3 µm feature ratios in the disk of WL16. We confirm this in the central, left-hand panel of Figure 4, which shows the 8.8/11.7 µm flux ratio image. In contrast to the featurelessness of the 7.9/8.8 µm ratio image, a distinct enhancement within the central 1.5″ core is observed (see also Figure 3).
Recent quantum mechanical calculations show that the 8.6 µm feature originates mostly from CH in-plane bending modes of positively charged PAHs, whereas the 11.3 µm feature originates from CH out-of-plane bending modes of predominantly neutral and anionic PAHs (Bakes et al., 2001). The observed contrast in the 8.8/11.7 µm flux ratio image and cross-cut of Figure 4 may be interpreted as a change in charge state of the PAHs from positively ionized in the central regions to neutral in the outer regions (Joblin et al., 1996; DeVito & Hayward, 1998).
The physical conditions required for the 11.3 m feature to originate mainly from neutral, and not positively charged, PAHs, are expressed by the constraint, , where is the UV radiation field (6–13.6 eV) in units of ergs cm-2 s-1 and is the electron density in cm-3 (Bakes et al., 2001). Of course, the central Herbig Ae star is the photo-ionizing and UV source for the WL16 disk. The calculated UV radiation field in the WL16 disk at different distances from the central source is: at 0″–1″, at 1″–2″, at 2″–4″, and for distances at 4″–6″ (DeVito & Hayward, 1998). Combining these values of the UV flux with the 11.3 m feature neutrality constraint, leads to derived electron densities in the WL16 disk decreasing from cm-3 in the central regions to cm-3 in the outer regions.
The bottom panels of Figure 4 show the 12.5/11.7 µm flux ratios. The most interesting feature in this image is the gradual enhancement of the 12.5/11.7 µm ratio towards the disk edges. Two possible explanations for this enhancement are increasing molecular size and increasing hydrogenation towards the disk edges.
It has been shown that partially hydrogenated small ( C atoms) PAHs, as well as large PAHs with 1, 2, or 3 adjacent H atoms can contribute to the 11.3 µm feature (Cohen et al., 1985; Mortera & Low, 1983). However, only relatively large PAHs, with 1, 2, or 3 adjacent H atoms, are needed to produce the 12.7 µm feature (Duley & Williams, 1981). Quantum mechanical calculations show that the 12.7 µm PAH feature strength increases with molecule size (Bakes et al., 2001). Therefore, one possible interpretation for the enhancement of the 12.5/11.7 µm flux ratio at the disk’s edges is the growth of larger PAHs (–80 C atoms) at greater distances from the central ionizing source.
Alternatively, since the 11.3 µm feature originates from PAHs with isolated H atoms (Cohen et al., 1985), whereas the 12.7 µm feature requires two adjacent hydrogen atoms on the aromatic ring (Verstraete et al., 1996), the slight increase in the 12.5/11.7 µm ratio apparent towards the edges of the WL16 disk might be due to increasing hydrogenation. Increasing hydrogenation may take place due to lower collision rates with electrons that would knock away H atoms due to lower at the disk edges and/or lower UV flux to dissociate H atoms from PAHs.
4.3.3 Disk Asymmetry
The intensity profiles along the disk’s major axis presented in Figure 3 show the presence of an asymmetry in emission strength with respect to mirror reflection about the central position at all observed wavelengths. This asymmetry occurs at angular separations between 1″–25 from the central position, corresponding to radii of 125 AU 300 AU. Since this asymmetry is observed at all wavelengths, it is likely due to either a column density enhancement in one side of the disk or a gap in the other. We do not have enough information to distinguish between these two possibilities.
Although it is tempting to invoke the presence of embedded planets to account for the observed disk asymmetry due to gravitational perturbations, the large radii (125 AU 300 AU) at which this asymmetry is observed conflicts with all current theories which predict AU as a typical outer boundary for planet formation from an accretion disk. Furthermore, any planetary time formation timescale at such large radii would exceed the inferred age of the central star. Nevertheless, objects a few meters to hundreds of meters in size could have had time to form at these radii (Kenyon & Luu, 1999).
4.3.4 Disk Lifetime
One intriguing problem is the question of how the PAH/VSG disk we observe is replenished, since even at the disk’s extremities, the timescales for blowing small particles out of the system by radiation pressure are only years. Condensation from the gas phase is highly unlikely, given the low gas densities throughout most of the disk, and the high activation energies required for PAH synthesis, which leads most researchers in the field to conjecture that PAHs are formed on the surface of grains. This leads us to the suggestion that the most likely scenario for replenishment of the PAHs/VSGs in the disk of WL16 is from the breakup of larger bodies, such as comets or Kuiper belt objects, or from UV or shock processing of larger grains as has recently been suggested by Duley (2000). The presence of PAHs in a possible planet-forming system has interesting implications for the potential seeding of planetary systems with organic materials, and is also consonant with the discovery of PAHs in meteorites.
5 Conclusions
We have presented diffraction-limited images and photometry of the disk surrounding the Herbig Ae star, WL16, at nine mid-infrared wavelengths, as well as photometry of the central star at five additional near-infrared wavelengths. From our newly derived spectral energy distribution for this source, we find that the central star and its disk are observed through a foreground screen which provides an extinction of magnitudes. We find that the star itself has a bolometric luminosity of 250 L☉ (at an assumed 125 pc distance), and the disk contributes 1% due to very small grain (VSG) and polycyclic aromatic hydrocarbon (PAH) feature emission.
The unprecedented spatial resolution of the mid-infrared images presented here allows us to confirm the presence of ionized PAHs in the central disk regions, and we report the discovery of a population of larger (–80 C atoms) PAHs and/or more hydrogenated PAHs at the disk’s periphery. We confirm that a population of graphitic VSGs is required to account for the observed large disk extent through the five mid-infrared filters which exclude the wavelengths of the PAH emission features. These VSGs are also required to explain the observed mid-infrared excess emission within the unresolved inner core (″) of the WL16 images.
The disk size is found to be 7″3.5″, corresponding to a de-projected disk diameter of 900 AU at the source. The disk inclination is found to be to our line of sight at P.A. 60∘. We find an asymmetry in the disk, at all observed mid-IR wavelengths, at 1″–25 from the central source. Finally, continuous replenishment of disk material, possibly from collisions of larger parent bodies, is required to maintain the PAH/VSG disk, which would otherwise be destroyed by blowout by radiation pressure on timescales of years.
References
- Adams, Lada, and Shu (1987) Adams, F. C., Lada, C. J., and Shu, F. H. 1987, ApJ, 312, 788
- André & Montmerle (1994) André, Ph. and Montmerle, T. 1994, ApJ, 420, 837
- Bakes et al. (2001) Bakes, E. L. O., Tielens, A. G. G. M., and Bauschlicher, Charles W. Jr., Hudgins, D.M., & Allamandola, L.J. 2001, ApJ, 560, 261
- Barsony et al. (1997) Barsony, M., Kenyon, S. J., Lada, E. A., Teuben, P. J. 1997, ApJS, 112, 109
- Brooke, Tokunaga, and Strom (1993) Brooke, T. Y., Tokunaga, A. T., and Strom, S. E. 1993, AJ, 106, 656
- Cabrit & André (1991) Cabrit, S. & André, Ph. 1991, ApJ, 379, L25
- Carr et al. (1993) Carr, J. S., Tokunaga, A. T., Najita, J., Shu, F. H., and Glassgold, A. E. 1993, ApJ, 411, L37
- Chandler et al. (1993) Chandler, C. J., Carlstrom, J. E., Scoville, N. Z., Dent, W. R. F., and Geballe, T. R. 1993, ApJ, 412, L71
- Chandler et al. (1995) Chandler, C. J., Carlstrom, J. E., and Scoville, N. Z. 1995, ApJ, 446, 793
- Cohen et al. (1985) Cohen, M., Tielens, A. G. G. M., Allamandola, L. J. 1985, ApJ, 299, L93
- de Geus, de Zeeuw, and Lub (1989) de Geus, E., de Zeeuw, P., and Lub, J. 1989, A&A, 216, 44
- de Geus (1992) de Geus, E. 1992, A&A, 262, 258
- Dent & Geballe (1991) Dent, W. R. F. and Geballe, T. R. 1991, A & A, 252, 775
- Deutsch et al. (1995) Deutsch, L. K., Hora, J. L., Butner, H. M., Hoffman, W. F., and Fazio, G. G. 1995, Ap&SS, 224, 89
- DeVito & Hayward (1998) DeVito, B. and Hayward, T. L. 1998, ApJ, 504, L43
- Draine & Anderson (1985) Draine, B. T. and Anderson, N. 1985, ApJ, 292, 494
- Duley & Williams (1981) Duley, W. W. and Williams, D. A. 1981, MNRAS, 196, 269
- Duley (2000) Duley, W. W. 2000, ApJ, 528, 841
- Emerson et al. (1996) Emerson, J. P., Moore, T. J. T., Skinner, C. J., and Meixner, M. M. 1996, in The Role of Dust in the Formation of Stars, Käufl and Siebenmorgen eds, ESO Astrophysics Symposia, Springer Verlag:Heidelberg, p. 23
- Greene & Young (1992) Greene, T. P. and Young, E. T. 1992, ApJ, 395, 516
- Hanner et al. (1992) Hanner, M. S., Tokunaga, A. T., and Geballe, T. R. 1992, ApJ, 395, L111
- Hanner, Brooke, and Tokunaga (1995) Hanner, M. S., Brooke, T. Y., and Tokunaga, A. T. 1995, ApJ, 438, 250
- Hartmann, Kenyon, and Calvet (1993) Hartmann, L., Kenyon, S. J., and Calvet, N. 1993, ApJ, 407, 219
- Hartmann, Hewett, and Calvet (1994) Hartmann, L., Hewett, R., and Calvet, N. 1994, ApJ, 426, 669
- Herbig (1994) Herbig, G. H. 1994, in The Nature and Evolutionary Status of Herbig Ae/Be Stars, ASP Conf. Ser. 62, eds. Thé, P. S., Perez, M. R., and van den Heuvel, P. J., p. 3
- Hudgins & Allamandola (1995a) Hudgins, D. M. and Allamandola, L. J. 1995a, J. Phys. Chem., 99, 3033
- Hudgins & Allamandola (1995b) Hudgins, D. M. and Allamandola, L. J. 1995b, J. Phys. Chem., 99, 8978
- Kenyon & Luu (1999) Kenyon, S. J. and Luu, J. X. 1999, ApJ, 526, 465
- Joblin et al. (1996) Joblin, C., Tielens, A. G. G. M., Geballe, T. R., and Wooden, D. H. 1996, ApJ, 460, L119
- Kim et al. (1994) Kim, S. H., Martin, P. G., & Hendry, P. D. 1994, ApJ, 422, 164
- Knude & Hog (1998) Knude, J. and Hog, E. 1998, A&A, 338, 897
- Lada (1987) Lada, C. J. 1987 in Star Forming Regions, eds. M. Peimbert and J. Jugaku (Doredrecht: Reidel), p.1
- Lada & Wilking (1984) Lada, C. J. and Wilking, B. A. 1984, ApJ, 287, 610
- Langhoff (1996) Langhoff, S. R. 1996, J. Phys. Chem., 100, 2819
- Luhman & Rieke (1999) Luhman, K. L. and Rieke, G. H. 1999, ApJ, 525, 440
- Lynch & Mazuk (2000) Lynch, D. K. and Mazuk, S. 2000, in Thermal Emission Spectroscopy and Analysis of Dust, Disks, and Regoliths, eds. M. L. Sitko, A. L. Sprague, and D. K. Lynch, ASP Conf. Ser. Vol. 196, 2000, pp. 127-164
- Mathis (1990) Mathis, J. S. 1990, ARAA, 28, 37
- Mathis, Rumpl, and Nordsieck (1977) Mathis, J. S., Rumpl, W., and Nordsieck, K. H. 1977, ApJ, 217, 425
- Mortera & Low (1983) Mortera, C. and Low, M. J. D. 1983, Carbon, 21, 283
- Moore et al. (1998) Moore, T. J. T., Emerson, J. P., Skinner, C. J., Meixner, M. M., Arens, J. F., and Jernigan, J. G. 1998, MNRAS, 299, 1209
- Motte et al. (1998) Motte, F., André, Ph., and Neri, R. 1998, ApJ, 439, 752
- Najita et al. (1996a) Najita, J., Carr, J. S., Glassgold, A. E., Shu, F. H., and Tokunaga, A. T. 1996a, ApJ, 462, 919
- Najita, Carr, and Tokunaga (1996b) Najita, J., Carr, J. S., and Tokunaga, A. T. 1996b, ApJ, 456, 292
- Natta, Prusti, and Krügel (1993) Natta, A., Prusti, T., and Krügel, E. 1993, A&A, 275, 527
- Natta & Krügel (1995) Natta, A. and Krügel, E. 1995, A&A, 302, 849
- Palla & Stahler (1999) Palla, F. and Stahler, S. W. 1999, ApJ, 525, 772
- Ressler (1992) Ressler, M. E., 1992, PhD Dissertation, U. Hawaii
- Ressler et al. (1994) Ressler, M. E., Werner, M. W., Van Cleve, J., and Chou, H. A. 1994, Exp. Astr., 3, 277.
- Siebenmorgen & Krügel (1992) Siebenmorgen, R. and Krügel, E. 1992 A&A, 259, 614
- Siess et al. (2000) Siess, L., Dufour, E., and Forestini, M. 2000, A&A, 358, 593
- Tanaka et al. (1990) Tanaka, M., Nagata, T., and Yamamoto, T. 1990, ApJ, 352, 724
- Tokunaga et al. (1991) Tokunaga, A. T., Sellgren, K., Smith, R. G., Nagata, T., Sakata, T., Nakada, Y. 1991, ApJ, 380, 452
- Verstraete et al. (1996) Verstraete, L., Puget, J. L., Falgarone, E., Drapatz, S., Wright, C. M., and Timmermann, R. 1996, A&A, 315, L337
- Waters & Waelkens (1998) Waters, L. B. F. M. and Waelkens, C. 1998, ARAA, 36, 233
- Wilking & Lada (1983) Wilking, B. A. and Lada, C. J. 1983, ApJ, 274, 698
- Wilking, Lada, and Young (1989) Wilking, B. A., Lada, C. J., and Young, E. T. 1989, ApJ, 340, 823
- Wood et al. (2002) Wood, K., Wolff, M. J., Bjorkman, J. E., & Whitney, B. 2002, ApJ, 564, 887
- Young, Lada, and Wilking (1986) Young, E. T., Lada, C. J., and Wilking, B. A. 1986, ApJ, 304, L45